2010 Analyst Briefing. December 7, 2010
|
|
|
- Edwina Angelina Blake
- 5 years ago
- Views:
Transcription

1 2010 Analyst Briefing December 7, 2010


2 Today s Objectives AGCO s highlights for 2010 Our plans for margin improvement AGCO s sales growth opportunities Our plans for future investments 2


3 Agenda Speaker Greg Peterson Director Investor Relations Martin Richenhagen Chairman, President & CEO Topic Introduction Margin improvement initiatives Growth drivers Break 5 minutes Andy Beck Senior Vice President & CFO Investment Plans 2011 targets 3
, margin and productivity improvements, purchasing initiatives, financing portfolio, cash flow, pension expenses, pricing")
4 Forward Looking Statements Statements that are not historical facts, including the projections of sales, earnings, general economic conditions, population estimates, market conditions, crop forecasts, currency translation impacts, working capital (and its components), margin and productivity improvements, purchasing initiatives, financing portfolio, cash flow, pension expenses, pricing levels, capital expenditures, proposed facilities and plant closures, new products, research and development expenditures and the underlying assumptions, are forward-looking and subject to risks which could cause actual results to differ materially from those suggested by the statements. The following are among the factors that could cause actual results to differ materially from the results discussed in or implied by the forward-looking statements: Our results depend entirely on the agricultural industry, the economic downturn has and will continue to impact sales, we depend upon suppliers for components and parts, a majority of our sales and manufacturing takes place outside the United States, and we are subject to exchange and interest rate changes. Further information concerning these and other factors is included in AGCO s filings with the SEC, including its Form 10-K for the year ended December 31, The Company disclaims any responsibility to update any forward-looking statements except as required by law. 4

5 Martin Richenhagen Chairman, President and CEO
6 Agenda Financial execution Operational execution Industry fundamentals Margin improvements Growth opportunities 6


7 2010 Strong Improvement in Operating Margin; Consolidated Results Full Year Results $6.5B 3.6% $6.7 to $6.8B Sales +~100 bps Adj. Op. Margin* Modest sales growth Strong growth in S. America offset weakness in EAME** Strong improvement in adjusted operating margin ** Europe/Africa/Middle East * Reflects adjusted results, which exclude restructuring and other infrequent items. Please see reconciliations to GAAP metrics provided in the appendix to this presentation. 7


8 Record Sales and Income in South America Full Year Results ~$1.7B $1.2B 5.5% ~10% Op. Margin Sales Dominant market position Market leading brands and distribution Robust market conditions Record sales and income 8


9 Improved North American Profitability North American Sales and Margins $1.3B $1.5B $1.8B 0.5% $1.4B 1.5% $1.5B 2.5% E Significant progress over last 4 years Improvement in 2009 and 2010 despite declining or flat sales Progress driven by: New products Factory productivity Logistics savings Pricing initiatives -2.9% -2.4% 9
10 Agenda Financial execution Operational execution Industry fundamentals Margin improvements Growth opportunities 10


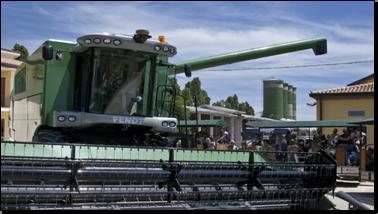
11 Established European Combine Headquarters in Breganze, Italy Announced acquisition of remaining 50% of Laverda Moved all European combine production from Randers to Breganze Well-positioned to grow harvesting business Fendt Challenger Laverda Massey Ferguson 11


12 Factory Productivity Initiatives Launched Massey Ferguson Fast Forward Pricing Complexity Fast Forward GPE/Direct material Manufacturing Working capital 12


13 Factory Productivity Initiatives Beauvais Tractor Plant Rearrangement BEFORE AFTER 13
 Rearrangement Layout in December")
14 Factory Productivity Initiatives Suolahti Tractor Plant (Finland) Rearrangement Layout in December


15 Marketing Events Valtra s 50th Anniversary in Brazil 15


16 Marketing Events 2010 Fendt Field Day in Germany 16


17 Marketing Events Hybrid Combine Product Launch HYBRID 17


18 Marketing Events Launch of New CVT Equipped Sprayer in N. America 18

19 Best-Cost Country Sourcing Spend Moved Advancing Towards Our Goal ~$250M ~$50M E 15-20% Savings Goal 19
20 Agenda Financial execution Operational execution Industry fundamentals Margin improvements Growth opportunities 20


")


21 Positive Industry Fundamentals will Drive Growth Food Stocks Declining Corn Stocks / Use Ratio ( e) Wheat Stocks / Use Ratio ( e) Soybean Stocks / Use Ratio ( e) 70% 100% 30% 60% 50% 40% 30% 20% 10% 80% 60% 40% 20% 25% 20% 15% 10% 5% 0% 0% 0% Source: Bloomberg 21


22 Positive Industry Fundamentals will Drive Growth Prices Are Above Historical Levels $ per bushel $10 $8 $6 $4 $2 Soybeans Wheat Corn Population and diets driving grain consumption Biofuels continuing to consume grains Stocks at low levels Long-term farm fundamentals supportive of investment in farm equipment Source: USDA Agricultural Projections to 2019, February USDA, Economic Research Service. 22
23 Agenda Financial execution Operational execution Industry fundamentals Margin improvements Growth opportunities 23

24 Focusing on ROIC Improvement Revenue ROIC is highly correlated to shareholder value ROIC Margin Invested Capital Costs Working Capital Fixed Capital Roadmap developed to drive improvement Margin expansion biggest opportunity Key initiatives address: material costs manufacturing optimization new product introductions 24


25 Material Cost Improvement Annual Material Spend over $3 Billion Welded Components Electrical Power train The Global Purchasing Excellence (GPE) program Common components Common suppliers Plastic/ Rubber Best-cost country sourcing Raw Materials Tires Hydraulics China Eastern Europe India 25


26 Material Cost Improvement Reorganized Purchasing Department Key to Success is Change to Regional Strategic Commodity Management example EAME OLD NEW EAME Factory-Based Purchasing EAME Commodity-Based Purchasing Finland Plant Purchasing Group Germany Plant Purchasing Group France Plant Purchasing Group Tires Steel Hydraulics Others 26


27 Material Cost Improvement Global Purchasing Excellence - GPE 24 commodity teams covering: $40M in estimated annual savings by 2013 $800M annual spend 27


28 Material Cost Improvement Best Cost Country Sourcing Best-Cost Country Sourcing Savings $175M in cumulative savings by

29 A Broad Focus On Manufacturing Optimization QUALITY TECHNOLOGY AGCO Quality Systems Design leading edge manufacturing methods for our Core Processes Manufacturing Optimization LABOR/MATERIAL EFFICIENCY VALUE ADDING ACTIVITIES AGCO Production Systems AGCO Production Systems 29


30 Manufacturing Optimization AGCO Production Systems Continually decreases waste Continually improves quality Six Sigma Lean Process Imp. Reduces cycle time and cost Increases potential capacity 30
31 Manufacturing Optimization Global Implementation of APS in 3 Phases LEVEL 1 LEVEL 2 LEVEL 3 Status by Region EAME Foundation modules Reduce non-value added work Ensure stable, robust processes Include suppliers Lean leadership S. America N. America Audit 1-2 year process Audit 31
32 Manufacturing Optimization APS Savings APS Cumulative Savings $50M 2010E 2011E 2012E 2013E 2014E $15M in annual savings by
33 Product Cost Reductions Centurion Project New Centurion Project World Platform HP replaces many diverse current products converging to one modular tractor family Centurion Family C1 Light 55-75HP C2/C3 Medium HP C3/C4 Heavy HP ~ $1 Billion in global sales Expected savings of bps on cost of production 33


34 Product Cost Reductions Centurion Project Milestones /2014 Engine; Development Programme China Phase 1: Engine & Tractor Facility ChangZhou Start of production for New Engine range for Current Product Vehicle & Driveline; Development Program (France/Brazil/India) China Phase 2; Greenfield Mfg Site Development Start of production Centurion Project Drivelines & Tractors 34


35 Product Cost Reductions Shifting Engine Sourcing to In-House Tractors and Combine Engine by Source E 25% AGCO Sisu Power Sourced 75% Third Party Sourced ~50% AGCO Sisu Power Sourced ~50% Third Party Sourced 35
36 Agenda Financial execution Operational execution Industry fundamentals Margin improvements Growth opportunities 36


37 Developing Markets China Large, growing market for low/mid horsepower tractors Farm consolidation and government policies drive growth in high horsepower tractors and combines AGCO strategy focusing on growing import business establishing domestic production and localization of tractors and combines leverage of China as global sourcing and manufacturing base 37

 Sisu Engines")
38 Developing Markets China Changzhou hosts the lower horsepower tractor and Centurion drive train operations Higher horsepower tractor and combine assembly are planned for Daqing Daqing Daqing Site / Heilongjiang HHP tractors assembly Combines assembly Balers / Sprayers Changzhou Beijing Changzhou Changzhou Site AGCO China operations LHP / MHP tractors Transmission (Centurion) Sisu Engines (Centurion) 38


39 Developing Markets Russia: Immense Farm Footprint Under-investment in farm equipment Market remains weak due to credit constraints and bad harvest AGCO strategy focusing on continued growth of existing import business establishing combine and tractor assembly plant developing distribution 39


40 Developing Markets India: Strong Partnership With TAFE Massey Ferguson Licensee AGCO owns 23% of TAFE TAFE Provides participation in Indian market sourcing of finished product sourcing of components and parts access to emerging market suppliers TAFE Brands 40


41 Developing Markets Africa: Significant Reserves of Fertile Land Additional Available Cropland (Million ha) Others Latin America Sub-Saharan Africa Sudan 54 DRC 52 Angola 40 Zambia 40 Mozambique 37 Central African Republic 34 Tanzania 29 Others 164 SOURCE: IIASA; World Bank; McKinsey analysis, IFPRI 41


42 Long Term Margin Target ~10% Assumes sales of $8.5B Other Volume New products Productivity +~100bps Material cost savings 3.5%* E ~ 5 Years * Reflects adjusted results, which exclude restructuring and other infrequent items. 42
43 IN SUMMARY Our Priorities Are Clear 1 Execute plans for margin improvement 2 Capitalize on AGCO s sales growth opportunities 3 Meet our ambitions for long-term earnings growth 43
44 Appendix
45 Non-GAAP To GAAP Reconciliation $M Except % s 2010E AGCO Corporation Years ended December 31, 2009 Income Income From Operating From Operating Operations Margin Operations Margin As adjusted $300 to $ % to 4.6% $ % Restructuring and other infrequent expenses 5 to 6 0.1% % As reported $295 to $ % to 4.5% $ %