Demonstrating the Benefits of Asset Management Implementation4
|
|
|
- Sabrina Lynch
- 5 years ago
- Views:
Transcription
1 Demonstrating the Benefits of Asset Management Implementation4 CAIT 2013 State of Good Repair Summit March 27, 2013 Sue McNeil

2 Outline What is asset management? Anticipated benefits Realized benefits Less anticipated benefits Measuring the benefits Communicating the benefits 1
3 Asset Management Is: Transportation Asset Management is a strategic and systematic process for operating, maintaining, upgrading and expanding physical assets effectively throughout their lifecycle. It focuses on business and engineering practices for resource allocation and utilization, with the objective of better decision making based upon quality information and well defined objectives. AASHTO Subcommittee on Asset Management


4 Asset Management Is: Figuring out the best way to use limited resources Making decisions based on performance goals Using complete, accurate data Recognizing the long term effects of short term solutions
5 Transportation Asset Management Is: Decisions are based on accurate data, strong comprehensive planning, and sound engineering and economic analysis Improved decision-making supported by policies, performance-based goals, performance measures, and appropriate service levels Long-term view of assets More robust management and monitoring systems
6 Transportation Asset Management Focuses on the strategic goals for the system including performance measures, and standards Considers all assets comprehensively Uses trade-off analysis and life cycle costing to support decisions Considers needs assessment, public preferences, and risk assessment in tradeoff analysis

7 Anticipated Benefits Improve program quality Improve information and access to information Facilitate economic assessment of various tradeoffs Improve documentation of decisions Improve information on return on investment and value of investments Reduce short-and long-term costs 6
8 AASHTO Transportation Asset Management Guide Long term view with emphasis on lifecycle and stewardship Connects goals and strategy Provides transparency and accountability Delivers agree levels of service Includes plans for growth Maximizes benefits of infrastructure 7
9 International Infrastructure Management Manual Improved governance and accountability Enhanced service management and customer satisfaction Improved risk management Improved financial efficiency More sustainable decisions 8

10 Anticipated Benefits Washington Department of Transportation 2009 Feasibility Study Quantitative Qualitative 9
11 Quantitative Benefits Better and more informed project programming Better cost estimates and risk identification. Improved lifecycle asset cost management Enhanced data entry Improved access to information Additional projects More cost effective solutions More effective replace/maintain decisions Reduction in tort claims 10
12 Qualitative Benefits More effective communication Improved partner selfservice capabilities Enhanced ability to locate assets and events Access to more timely and accurate information Improved constituent trust Better positioned to respond to future changes 11
13 Realized Benefits Payoffs have accompanied the adoption of Transportation Asset Management practices. Counties have reported, among other benefits, enhanced support by citizens and elected officials for preventive maintenance activities, a net reduction in agency costs for managing the roadway network, and improved asset conditions. m 1 2
14 Realized Benefits - Examples Colorado DOT Delaware Department of Transportation Self-assessment process used to promote strengths and identify gaps New ways of reporting information Department of Civil and Environmental Engineering 1 3
15 Colorado DOT. escalating costs, due to factors such as inflation, environmental events, and system growth. Funding shortfalls.. With asset management Colorado DOT has achieved greater benefits investing its limited resources than it could have without the use of asset management tools. Asset management has allowed levels of service to be better than they would have been without it. Importantly asset management has reduced the life-cycle costs of CDOT facilities by substitution preservation for worst-first The return on investment has increased significantly for bridges and pavements. (AASHTO Transportation Asset Management Guide) 1 4
16 Delaware Department of Transportation Self-assessment process used to promote strengths and identify gaps Self assessment undertaken in 2008 Focus on three areas Maintenance Traffic Decision Making 1 5

17 Maintenance Strengths Knowledge of maintenance management systems Monitoring system performance and comparison to targets Customer service Gaps Geographic referencing Risk reduction Data on life cycle histories Knowledge of other tools

18 Traffic Strengths Customer service Gaps Inventory Knowledge of asset management processes Risk assessment and integration with emergency response Information technology and decision support tools

19 Decision Making Strengths Inventory Decisions are consistent with available resources Performance data Customer relations Gaps Inventory not current Life cycle costing Risk assessment Maintenance manuals and policies including preservation methods User friendly information systems
20 Delaware Department of Transportation New ways of reporting information Asset management for interstate highways in Delaware Setting targets Budgeting Dashboard Allocation 1 9
21 Setting Targets 2 0

22 Budgeting 2 1

23 Dashboard 2 2
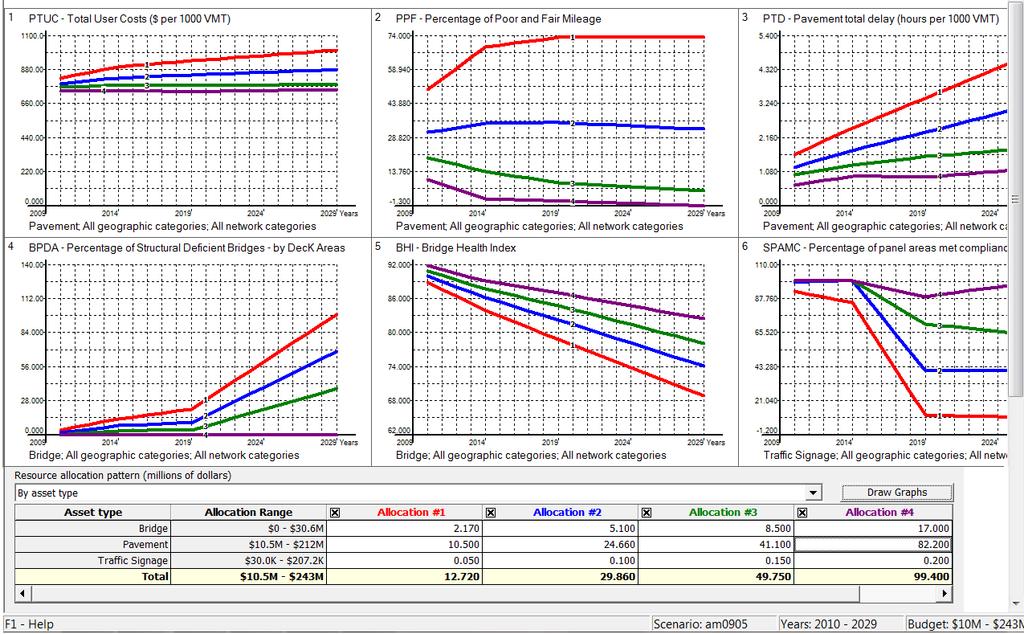
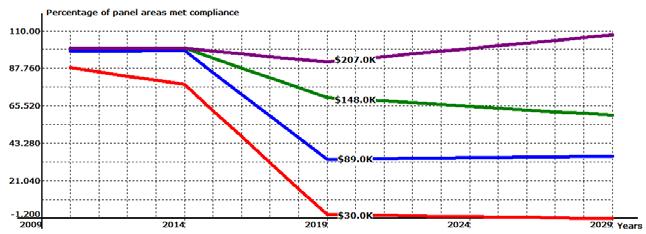
24 Allocation 2 3


25 Less anticipated benefits Asset data and disasters Costs for rebuilding infrastructure after and event Safety Katrina, Irene, Sandy, Saturn Adapatation to climate change 2 4

26 Measuring the Benefits Challenging topic Examples Ancilliary Assets Using HERS-ST 25
27 Benefits Ancillary Assets New Mexico Road Feature Inventory (RFI) system estimated cost $2.5m City of Calgary, Canada (water mains) - saved about $30 million in their rehabilitation and replacement decisions and $16 million in break repairs over a period of 10 years Source: Akofio-Sowah, M. (2011). Quantifying the Benefits of Ancillary Transportation Asset Management. M.S. thesis, Georgia Institute of Technology, Atlanta, GA. 26
28 Using HERS-ST Quantify the benefits of using HERS-ST Demonstrate that the benefits outweigh the implementation and operating costs. 27
29 Methodology Ex Ante (or prospective) evaluation Estimate future benefits of using HERS-ST derived from the comparison between With HERS-ST and Without HERS-ST cases With Case : HERS-ST optimization strategy Without Case: Worst First strategy Performance With HERS-ST (= After implementing HERS-ST) Predicted Without HERS-ST (= Before implementing HERS-ST) Predicted Implementation of HERS-ST Year 28
30 Data Sample HPMS (Highway Performance Monitoring System) data from the state of New Mexico from 2001 included in the HERS-ST package 283 sections consisting of rural principal arterials, rural minor arterials, and urban principal arterials Lengths (lane-mile) very 1 poor 2 poor Rural Principle Rural Minor Urban Principle Average PSR: fair 3 good 4 very 5 good 488 PSR 29
31 Analysis Results (1) Total Initial Costs Average PSR $Millions With FP1 FP Without Initial FP1 FP2 With Without 0.6% (about $4 million) difference b/w the cases Average Speed MPH Initial FP1 FP points higher over 10 years hours/1000vmt Delay - Total Initial FP1 FP2 0.17mph higher in hours/1000vmt lower in 2010 (2.7 min/1000vmt) Billions VMT (All) 8million higher in 2010 Initial FP1 FP2 30
32 Analysis Results (2) $/mile Maintenance Costs With Without FP1 FP2 $/VMT User Costs With Without $185/mile difference b/w the cases $0.04/VMT difference b/w the cases Emission Costs Total Costs $/VMT With Without $Billions With Without $0.003/VMT difference b/w the cases $359 million difference b/w the cases 3 1
33 Analysis Results (3) Benefits derived from treatments in FP 1 $2 billion FP 1 FP 2 FP n Benefits derived from treatments in FP 2 $359 million FP 2 FP m 3 2
34 Discussion What are the sources of the benefits? Different treatments: 46% of the sections in the with case compared to the without case Sections None Resurface Treatment Type Resurf. & Impro. Shoul Resurf.& Add hi cost lane Reconstruction with without Preventive maintenance: appropriate timing and treatments PSR 0 Threshold for Resurfacing t 5 Year Needs Reconstruction Without With 3 3
35 Communicating the Results - 3Es Efficacy Whether HERS-ST work or not With Difference in performance b/w With and Without Without Effectiveness Degree to which HERS-ST achieve goals With Comparison of the difference in degree to the goals b/w With and Without Efficiency Optimal use of resources using the ratio of output/outcome to input of PMS Without With Goal Comparison of the ratios of benefits to costs b/w With and Without Without Costs Benefits 34
36 Observation Demonstrated the benefits of using HERS-ST s asset management and the method to assess the benefits using HERS-ST. The benefits can be observed as the efficacy, effectiveness, and efficiency. The investment in the HERS-ST implementation can be justified if costs are available. 3 5

37 Summary Demonstrating the benefits of asset management is challenging Quantitative analysis can be used for specific tools but requires many assumption Qualitative assessment is difficult to document 3 6