|
|
|
- Dominic Shaw
- 5 years ago
- Views:
Transcription

1


2
3 3

4 4

5 5

6 6

7 7

8 8
9 Managing the Power Grid using Maps, Real-time Data and Rosetta Stones Using ESRI technology and real-time data to visualize and manage the Power Grid Presented by Dayna Aronson

10 Dayna Aronson Enterprise Solutions Architect

11 11 Peak is registered in the NERC Compliance Registry to perform the Reliability Coordinator (RC) function as a statutory activity. Peak performs this function for most of the Balancing Authorities and Transmission Operators in the Western Interconnection which includes all or parts of 14 western states, British Columbia, and the northern portion of Baja California, Mexico.
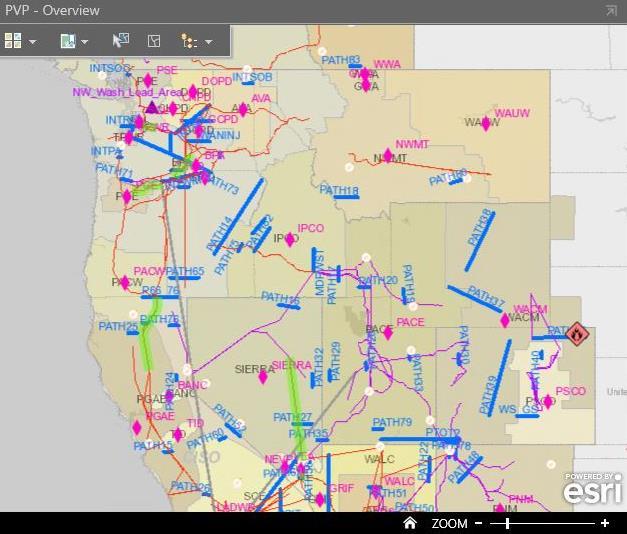
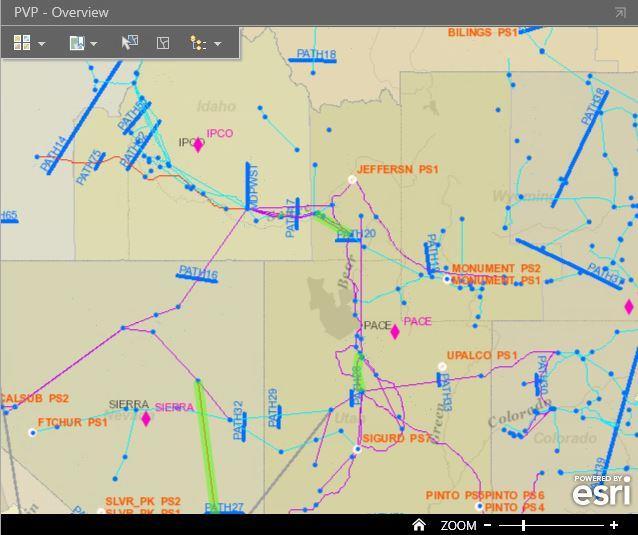
12 Peak Visualization Platform (PVP) 12
13 PVP Solution Summary New ESRI Customer in 2015 OSIsoft Customer since 2008 Total number of SCADA tags we get via ICCP: 160k Updating every 10 seconds Total number of tags in EMS OSIsoft PI System: 1.1m All real-time data comes from OSIsoft PI System Number of GeoEvent services: 50 Polling frequency 30 seconds Events per second Current visualization client: Operations Dashboard Currently ArcGIS moving to 10.5 Will be implementing the Spatiotemporal Big Data Store 13
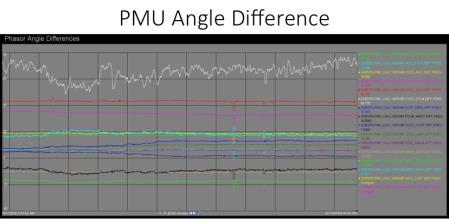
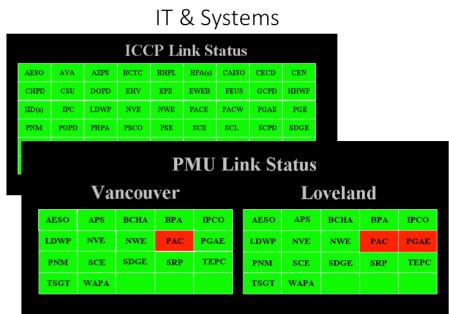
14 Same Problem Different Control Room More and more data coming into the control centers responsible for larger areas than ever before Addition of PMU and other high definition data sources (even more data) Need to make it comprehendible by humans turning data into information allow the most important data to rise to the top and be understood by operations staff Show how one set of data impacts another MUST be maintainable Alarms IROL Flow gate / Paths ACE PMU and wide area Voltage Angle Load Ace AGC RAS Systems / IT 14


15 Options Evaluated etv WAV STI Macomber Map PowerWorld ESRI Lots of solutions available about best match 15


16 ...Failure to Communicate Systems that need to communicate with each other about the same Equipment / Grid speak different languages. They have different models, units, nomenclature, process and terminology. EMS Outag e Mgt Custom SQL Based Apps Share Point Planning & Study Tools 16
17 Model Consolidation & Normalization Performed every five weeks Physical network topology: ETS (EMS vendor Tool) SCADA: In-house databases and scripts ICCP: In-house databases and scripts RTCA Contingencies: Home-grown CSV file and scripts Alarms: EMS vendor UI and scripts RAS: In-house databases and scripts Outages: 3 rd party proprietary software Peak RC spends significant resources to maintain models (meta-data) 17
18 Building the Rosetta Stone Habitat EMS runtime databases Outage Management System Other Systems SQL Server Model & Meta-Data Consolidation & Normalization AF 18
19 Collaboration Kudos Three versions over two years of development, with at least 4-5 days/month dedicated to it. Over 15,000 lines of code Jeffrey Parker Tim Van Prooyen Cody Parker Brian Caserta Ryan Schoppe Michael Nuget Todd Chumley 19

20 Grid Reliability Reducing the amount of time it takes an RC to comprehend actionable information. Blue Cut Fire 11:44 Loss of first 500kV line Over next 4 hours additional facilities are impacted as fire grows RC calls fire bosses to try and determine location and direction of fire growth and what additional facilities are about to be impacted It takes up to 1 hour for this information to get back to the RC No current method for analytic tools to geographically map Sub optimal gen dispatch Extended load shed exposure 20

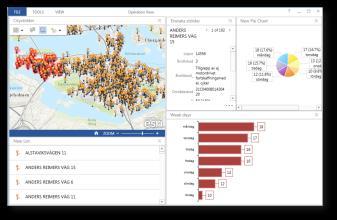
21 Real-time Fire Visualization Fire location, size and spatial geometry boundaries updating every 5 minutes from USGS along side of transmission assets


22
23 Dashboard 23

24 Navigation


25 Context specific App launch Any URL 25
 - IROLs - Lines - BA / TOP SQL Sources Historian Context Launching ArcGIS - Alarms - RTCA ArcGIS Desktop Model Geo")
26 Technical details Operation Dashboard Portal PI Integrator AF CoreSight Manages GIS assets and user security GeoEvent Processor Real time data feeds - Substations - Paths (Flowgates) - IROLs - Lines - BA / TOP SQL Sources Historian Context Launching ArcGIS - Alarms - RTCA ArcGIS Desktop Model Geo Database 26
27 Decision Drivers ESRI and OSIsoft are the best in class in their core technologies Leverage Peak Investment in OSIsoft PI Staff Knowledge and Comfort Relationship Infrastructure Data driven solution 27
28 Solution Highlights Easy display creation and modification with Operations Dashboard Rosetta Stone Data Philosophy Whiteboard philosophy (can build anything not limited) EMS vendor Agnostic Eye toward secure external tablet and mobile use Quickly reconfigure based on input from users 6 months from vendor selection of ESRI to available in the control room as a Pilot solution 28
29 What value was achieved Organization of data to the operation staff Empowered operations staff to control their environment IT focuses on making data available Better decisions in less time 29
30 Contact Information Dayna Aronson Enterprise Solutions Architect - Peak RC daronson@peakrc.com