Plant Simulation in Design and Optimization of Manufacturing Processes of Gas Turbine Burners
|
|
|
- Charleen Murphy
- 5 years ago
- Views:
Transcription


1 Plant Simulation in Design and Optimization of Manufacturing Processes of Gas Turbine Burners Dr. Thomas Stoffel, Siemens AG siemens.com/power-gas Table of content Simulation of the burner manufacturing at Siemens Gas Turbine Plant Berlin Simulation example Summary Page 2
2 Simulation of the burner manufacturing at Gas Turbine Plant Berlin Simulation of the burner manufacturing at Siemens Gas Turbine Plant Berlin Page 3 Simulation of the burner manufacturing Parts Berlin Pilot Nozzle Transition Charlotte Support Housing Basket Simulated parts Parts of turbine classes SGT-8000H series and SGT6-5000F Page 4


3 Simulation of the burner manufacturing Value stream Value Stream Cluster VSC 1: Final Assembly VSC 2: Rockets VSC 3: Manifold Loadplan VSC 4: Swirler Mach. VSC 3a: Small Parts Mach. VSC 6: Pilot Nozzle Turning Milling Welding Assembly & Cleaning Testing Supermarket 4 Rocket Double Rockets 2.0 Druck & Dicht X-Ray 2 1 Finishing Finishing 1.5 Straightening Cell Final Assembly / Machining Manifold 3a Swirler Machining Fuel Supply Machining Page 5 Simulation of the burner manufacturing Customer requirements and level of details Vision - Use of simulation systems for design and optimization of manufacturing processes Flow of parts Routings Human resources Workstations Loadplan Customer requirements: Detection of problems in the connected domains above Finding of quantitative solution proposals Transparency Continuous improvement of manufacturing processes (CIP) Page 6
4 Simulation of the burner manufacturing Added values and challenges Added value for the Gas Turbine Plant: Simultaneous process oriented optimization of Inventory Lead times Workers management Workstations Challenges: The simulation model itself, its granularity and functions Model based on Plant Simulation, incl. added functions, embedded in Microsoft ACCESS for data creation and analysis Model parameters The data must fetched in the shop floor item by item (SAP-data inappropriate) Acceptance of new methods (Change Management) SCRUM project established with shop floor colleagues Page 7 Simulation of the burner manufacturing Functionalities of the simulation model Page 8 Human resources Number Allocation to workstations Multiple workstation operation Shift plan Presence Workstations Cycle times Setup times Delay times Down times Maintenance Disturbances Qualification of other parts Load plan Lots Variants Delivery dates Unexpected changes Overall completion 80 % Software finalized Data in acquisition Parts Machine times Personal times Set up times Waiting times Scrap Rework Routing, flow of parts Instructions Sequence of instructions Lot sizes Quality breaks Parallel workstations Assembly/ join of parts Different parts on the same work station Parts several on the same work station Stocks Kanban, cyclin Jams Idle times
5 Simulation example Simulation example Page 9 Simulation of the burner manufacturing Added values and challenges Manufacturing of the swirler component: Mechanical steps (milling, drilling, eroding) Welding 3D Coordinate-measuring CMM Surface crack testing Mass throughput testing Starting point: Completely de-coupled value stream All lot sizes are of value 1, in simulation workstations are added to avoid crossing value streams Processing times taken from shop floor All workers can do all work Simulation goal: Optimization of output per day by given number of workers and their allocation to workstations Page 10


6 days Swirler 2.0 GO: coupled vs. de-coupled value streams time on and before workstations OFR Wa No OFR Wa No Tage Queuing time Waiting time Working time OFR: surface crack testing Wa No: washing stations Value streams coupled Value streams de-coupled Value stream Queuing time in front of the the workstations / days Working time of the workstations / days Output rate / parts per day coupled ,4 De-coupling of value streams does not necessarily increase the performance of the production De-coupled Picture 1: Sum of working times, waiting times and queuing times of parts on and before workstations Page 11 Utilization of manned and non-manned workstations with a demand for a worker A B poor average Long phases in which no workers are required Periodic repeating sum of workstations waiting for a worker Detail analysis Dt = 44 min time Long phases in which workstations can t be put into operation because no free worker is available Dt = 45 min time Page 12


7 Detailed analysis of the utilization of workstations and workers t = 11 06:28, time A 0 worker without part Page workstations without part 8 workstations working with worker 8 workstations waiting for a worker 2 workstations working without worker Detailed analysis of the utilization of workstations and workers t = 11 07:12, time B 7 workers without part Page workstations without part 1 workstations working with worker 0 workstations waiting for a worker 12 workstations working without worker
8 The periodic oscillation between too less workers and too less parts soldiers bridge Relating attributes in production: Personnel: Number Allocation of workers to workstations Shift plan Parts Packet size when charging Cycling of packets Sequence of packets when mixed Routing: Number of working instructions Sequence of instructions Cycling time per instruction Lot sizes Cycling of workstations Marching lock-step can force the bridge to resonance vibrations An inappropriate combination of one or more of those attributes can force the production to unexpected behavior Page 15 Investigated measures Number Measure 1 Coupling of the value stream by appropriate lot sizes in surface crack testing and washing 2 Adding a milling workstation because of a bottle neck 3 Determination of the optimized workers allocation to workstations 4 Determination of appropriate shift plans (combination and number of workers) 5 Interruption of the routing in two phases, hereby introduction of a new material in the bill of materials 6 De-coupling of the two new routing by a KANBAN controlled stock Page 16


")
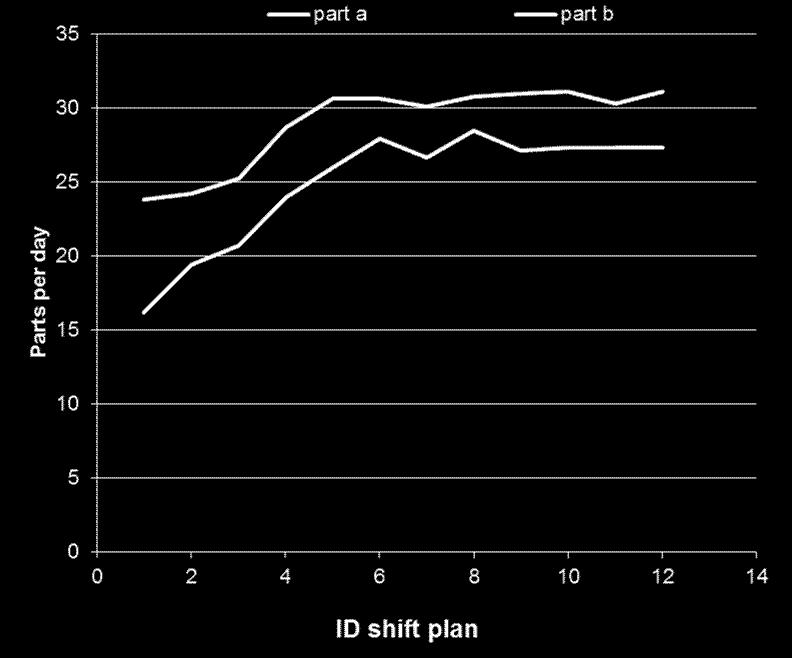
9 Simulated output rate (I) part a Page 17 Simulated output rate (II) Page 18
10 Summary Plant Simulation together with extended data analysis gives strong hints to improve the output of Berlin s swirler production 48% Next steps: Installing a continuous improvement process - CIP - of production and simulation Extending the CIP to all other production clusters of the Berlin plant Page 19 Thank You Dr. Thomas Stoffel Power and Gas Division Large Gas Turbines, Generators PG GT MLGT BLN TS BPM Huttenstr Berlin, Deutschland Tel.: Mobile: mailto: thomas.stoffel@siemens.com siemens.com/power-gas Page 20
11 Disclaimer This document contains statements related to our future business and financial performance and future events or developments involving Siemens that may constitute forward-looking statements. These statements may be identified by words such as expect, look forward to, anticipate intend, plan, believe, seek, estimate, will, project or words of similar meaning. We may also make forward-looking statements in other reports, in presentations, in material delivered to shareholders and in press releases. In addition, our representatives may from time to time make oral forward-looking statements. Such statements are based on the current expectations and certain assumptions of Siemens management, of which many are beyond Siemens control. These are subject to a number of risks, uncertainties and factors, including, but not limited to those described in disclosures, in particular in the chapter Risks in Siemens Annual Report. Should one or more of these risks or uncertainties materialize, or should underlying expectations not occur or assumptions prove incorrect, actual results, performance or achievements of Siemens may (negatively or positively) vary materially from those described explicitly or implicitly in the relevant forward-looking statement. Siemens neither intends, nor assumes any obligation, to update or revise these forward-looking statements in light of developments which differ from those anticipated. Trademarks mentioned in this document are the property of Siemens AG, its affiliates or their respective owners. TRENT and RB211 are registered trade marks of and used under license from Rolls-Royce plc. Trent, RB211, 501 and Avon are trade marks of and used under license of Rolls-Royce plc. Page 21