Investor Presentation 1Q19
|
|
|
- Clyde Harrell
- 5 years ago
- Views:
Transcription


1 Investor Presentation 1Q19 August 7, 2018.
2 Forward-Looking Statements and Non-GAAP Financial Measures This presentation contains forward-looking statements, as that term is defined under the federal securities laws. Any statement that refers to expectations, projections, targets or other characterizations of future events, including financial projections and future market conditions, is a forward-looking statement. Statements included in this presentation that are forward-looking statements include but are not limited to statements regarding market trends and opportunity, our future financial performance, such as our outlook on financial results for the second quarter of fiscal year 2019 and for the full fiscal year 2019, such as revenue, non-gaap operating income, non-gaap earnings per share, deferred revenue, operating cash flow, free cash flow, and gross margin. These forward-looking statements are based on our assumptions, expectations and beliefs as of the date of this presentation and are subject to substantial risks, uncertainties, assumptions, and changes in circumstances that may cause our actual results, performance, or achievements to differ materially from those expressed or implied in any forward-looking statement. We assume no obligation and do not intend to update these forward-looking statements, except as required by law. For more information about factors that may cause actual results to differ materially from forward-looking statements, please refer to our August 7, 2018 press release, as well as the risks described in our filings with the Securities and Exchange Commission ( SEC ), including our Annual Report on Form 10-K for the fiscal year ended March 31, 2018 filed with the SEC, particularly in the section titled Risk Factors. This presentation also contains certain non-gaap financial measures as defined by SEC rules. These non-gaap financial measures are in addition to, and not a substitute for or superior to, measures of financial performance prepared in accordance with GAAP. There are a number of limitations related to the use of these non-gaap financial measures versus their nearest GAAP equivalents. For example, other companies may calculate non-gaap financial measures differently or may use other measures to evaluate their performance, all of which could reduce the usefulness of our non-gaap financial measures as tools for comparison. Please refer to our August 7, 2018 press release for additional information as to why we believe these non-gaap financial measures are useful to investors and others in assessing our operating performance. As required by Regulation G, we have provided a reconciliation of those measures to their most directly comparable GAAP measures, which is available in the appendix to this presentation. However, we have not reconciled our expectations as to non-gaap operating loss and income, non-gaap earnings per share, gross margin, operating margin, non-gaap expenses as a percentage of revenue, or free cash flow in future periods to their most directly comparable GAAP measure because certain items, namely stock-based compensation, lawsuit litigation expenses and employer payroll taxes on equity incentive plans, are out of our control or cannot be reasonably predicted. Accordingly, reconciliation is not available without unreasonable effort, although it is important to note that these factors could be material to our results computed in accordance with GAAP. 2
3 New Relic, Inc. (NEWR) New Relic provides the real-time insights that businesses need to monitor, manage, and operate digital systems. New Relic s cloud platform is designed to make modern software and infrastructure observable, so companies can find and fix problems faster, build high-performing DevOps teams, and speed up software projects. Multi-tenant native cloud Recurring revenue, SaaS model with best-in-class gross margins Gartner Magic Quadrant Leader 2012 to present Multi-billion dollar market opportunity 3
4 Strong Tailwinds For Our Business The percentage of application workflows monitored by APM is expected to quadruple by % 20% Source: Gartner, Magic Quadrant for Application Performance Monitoring Suites, March


5 Modern Software is Changing Businesses Technology Processes Business Models New technology and dynamic infrastructure New processes and faster velocity New business models and revenue streams Cloud Multi-cloud Serverless computing Containerization Continuous integration Continuous deployment DevOps IoT Omnichannel Mobile first Digital transformation 5


6 Dynamics Impacting Broad Range of Industries 60 % of US sales from digital channels in 2017 >75 % of customer interactions with Capital One are digital 10M streaming sessions per day 6


7 Trends Driving Major Market Opportunities Mission critical to all industries Technology Processes Business Models $125B 85% $1.3T Global 2017 Cloud Spend 1 Multi-Cloud Deployment 2 Global IT spending on Digital Transformations 3 1 IDC, Worldwide Semiannual Public Cloud Services Spending Guide, Dec 2017 IDC, Predominance of Multicloud Environments Among Cloud Users, IDC #US , June Respondents identifying multi-cloud as their current or near-term cloud deployment option. n=6,084 worldwide respondents, weighted by country, company size and industry 3 IDC, Welcome to the 3rd Platform's Second Chapter, IDC #DR2018_GS1_FG, Feb
8 Key Technology Initiatives If it s not measured, it s not managed Modern Software DevOps Transformation Greater agility to deliver products to market Cloud Adoption Customer Experience Autonomy to rapidly scale infrastructure Deliver a flawless digital customer experience 8


9 Software Environments are Complex Visibility not included 9


10 Software Businesses Require Real-Time Insights How is my business doing? Business Outcomes What changes influence business success? How are customers engaging? Customer Experience What is the page load time to initial experience? Am I open for business? Application and Infrastructure Performance Is the application working? 10


")

11 The New Relic Platform End-to-end visibility to continuously observe, adapt, align... Business Outcomes Customer Experience KPIs KPIs Multi-Product Subscriptions Feature Uptake Conversion Rate Revenue at Risk Web and Mobile Concurrent Users Revenue per Streaming Video Application Performance QoS Process Abandons Sessions by Geography or Product # of Visitors, Views by Visitor Load Times Trends (social, content, geography) Infrastructure Performance KPIs KPIs Transaction Times Error Rates Application Bottlenecks On-Prem vs. Cloud Infrastructure Status and Changes Server Downtime Host Health Database Performance Cloud Spend 11


12 An Enterprise Cloud Scale All 6 paid SKUs are equipped with New Relic Applied Intelligence Enterprise security ing nd Pe 1.8B Events & Metrics per Minute 7 Programming Languages Cloud & On-Host Integrations SSAE-16/SOC II New Relic Platform SSAE-16/SOC II Data Center CSA-STAR 12


13 Designed to Win the Cloud The future of enterprise workloads SaaS Delivery Easy to Use Quick Time to Value Massive Scalability Full Stack Visibility 13
14 Growth Drivers Add new enterprise logos and extend breadth within existing ones Increase non-apm adoption to raise annualized revenue per average paid business account Further penetrate international markets Expand the platform: new products, deeper integrations, and innovative features and use cases 14
15 Land and Expand Standardize Business Model Standardize CTO and above Expand Platform VP / GVP / CIO for IT / Ops / Dev 1 All new software applications Expand Software applications 2 On-premises displacement Director level IT / Ops / Dev 3 100s - 1,000s of users 4 Executive dashboards Land 5 CTO as advocate 1 Customers adopt multiple IT / Ops / Dev Middle Manager paid products 2 Deployment across all cloud applications 1 Land application usage swells 3 Replacing point solutions 2 Multiple applications 4 Customer Success Investment New digital / software initiative Enterprise: $50K - 100K+ Enterprise: $100K - 500K+ Enterprise: $500K - 1M+ Enterprise: $1M+ 15


16 Financial Highlights 1Q19 * Year-Over-Year 1Q19 Revenue Growth 35% See appendix for non-gaap reconciliations. * Mid-point of FY19 guidance Non-GAAP 1Q19 Gross Margin 85% Non-GAAP 1Q19 Operating Margin 8% Non-GAAP LTM Free Cash Flow Margin 11% 16
17 Key Operating Metrics 1Q19 1Q17 2Q17 3Q17 4Q17 1Q18 2Q18 3Q18 4Q18 1Q19 118% 116% 125% 133% 113% 123% 125% 141% 118% % ARR from Enterprise Paid Business Accounts 43% 43% 44% 46% 49%* 51% 52% 54% 55% Paid Business Accounts >$100K >14,000 >14,500 >14,900 >15,200 >15,400 ~15,900 >16,600 >17,000 >17,000 Annualized Dollar-Based Net Expansion Rate Paid Business Accounts Annualized Revenue / Avg. Paid Business Account >$17,000 >$17,500 >$18,000 >$19,000 >$20,500 >$21,500 >$22,500 >$23,000 >$25,000 * Period included changes to the categorization of existing paid business accounts to reflect that they had expanded beyond the 1,000 employee threshold. See appendix for definitions. 17
18 Strong Operating Leverage 1Q19 See appendix for non-gaap reconciliations. 18
19 Target Operating Model* 1Q19 Long-Term Target (% of Revenue) FY15 FY16 FY17 FY18 1Q19 FY22** Driver Gross Margin 81% 81% 82% 84% 85% 80 84% Continued investments in delivery, support and services 80 84% Sales & Marketing 76% 66% 59% 53% 48% 38-40% Increased mix of productive reps, renewals, installed base 35 38% Research & Development 20% 22% 19% 17% 18% 19-21% Maturation of product portfolio 15 18% General & Administrative 18% 16% 14% 14% 11% 10 12% Economies of scale Operating Margin (33%) (23%) (10%) -% 8% 10 14% 25%+ Free Cash Flow Margin (32%) (8%) (2%) 3% 38% 15-20% 30%+ 7 9% * Metrics are non-gaap and FY15 to FY18 were calculated prior to the April 1, 2018 adoption of ASC606. See appendix for reconciliations and how we define free cash flow. ** Assuming a $1B revenue run-rate for period ending March 31,
20 Second Quarter and Fiscal 2019 Outlook* (August 7, 2018) Q2 FY19 Guidance Revenue: $110.5M $112.5M Non-GAAP operating income: $4.5M $5.5M Non-GAAP EPS: $0.11 $0.12 Deferred revenue to sequentially decline in the low to mid single digits FY19 Guidance Revenue: $457.5M $462.5M Non-GAAP operating income: $18.0M $22.0M Non-GAAP EPS: $0.39 $0.46 Gross Margin ~83% Operating cash flow: $70.0M $80.0M; Non-GAAP Free cash flow: $30.0M $40.0M * Operating income, earnings per share, gross margin, and free cash flow presented on a non-gaap basis; Q2 FY19 EPS assumes 60.2M weighted average diluted shares outstanding, which excludes the anti-dilutive impact of the capped call transactions entered into in the connection with the 0.50% convertible senior notes due 2023 issued in May 2018; FY19 EPS assumes 60.5M weighted average common shares outstanding which excludes the anti-dilutive impact of the capped call transactions entered into in the connection with the 0.50% convertible senior notes due 2023 issued in May 2018; See appendix for non-gaap reconciliations and how we define free cash flow. 20
21 Investment Highlights Large, underpenetrated, expanding multi-billion dollar opportunity Technological competitive advantage $200M+ invested in R&D building massively scalable 100% SaaS multi-tenant platform Strong combination of revenue growth and non-gaap profitability Best-in-class SaaS gross margins help drive significant operating leverage 21
22 Appendix 22

23 Best-in-Class Gross Margin GAAP Gross Margin vs. SaaS Peers Peer Average = 68% NEWR Source: Company earnings releases filed with the SEC covering the most recent quarter reported as of August 3, Peers identified based on Wall Street Research comparable SaaS company groupings. 23

24 ASC 605 to ASC 606 GAAP Reconciliation 1Q19 24

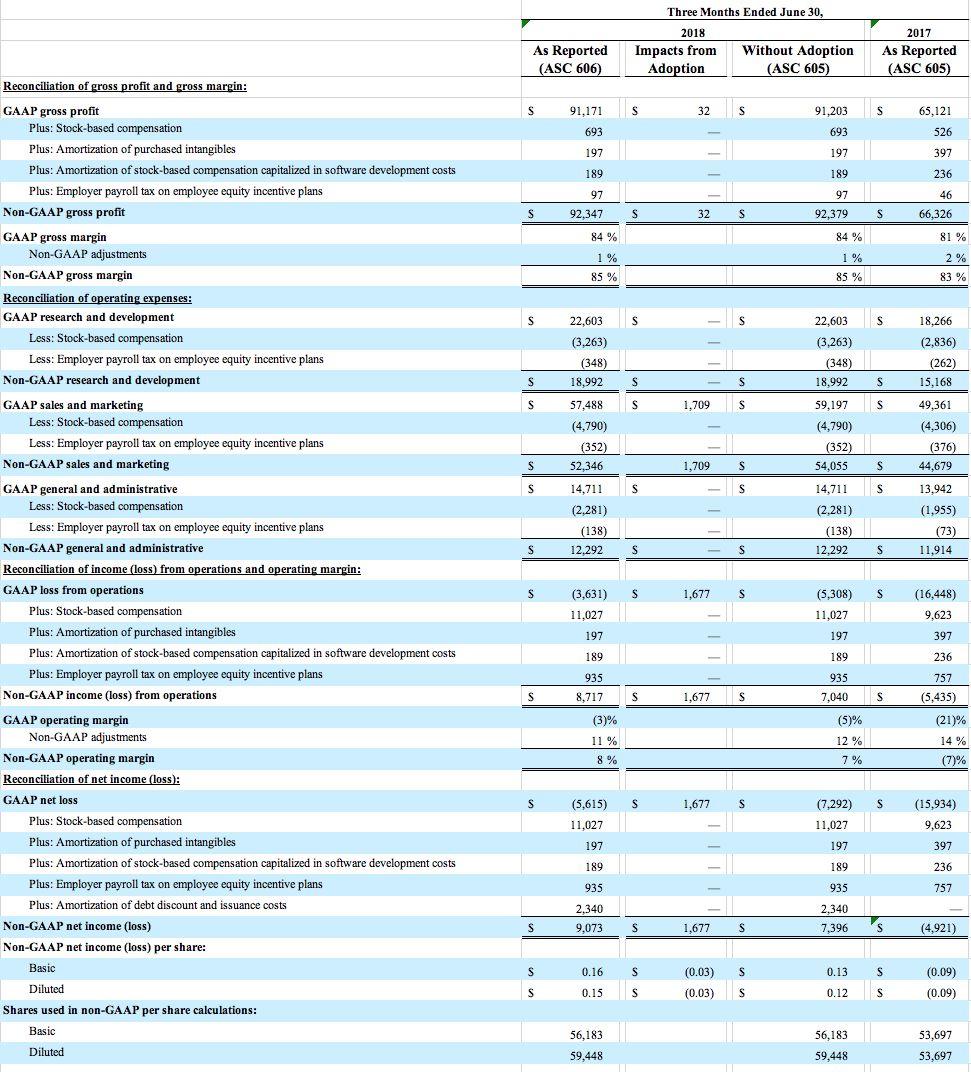
25 ASC 605 to ASC 606 Non-GAAP Reconciliation 1Q19 25
26 Definitions Monthly and Annual Recurring Revenue (MRR and ARR) Our monthly recurring revenue represents the revenue that we would contractually expect to receive from those customers over the following month, without any increase or reduction in any of their subscriptions. Similarly, annual recurring revenue represents the revenue that New Relic would contractually expect to receive from those customers over the following 12-month period, without any increase or reduction in any of their subscriptions. Enterprise ARR is defined as ARR from paid business accounts with >1,000 employees. Number of Paid Business Accounts We define the number of paid business accounts at the end of any particular period as the number of accounts at the end of the period as identified by a unique account identifier for which we have recognized revenue on the last day of the period indicated. A single organization or customer may have multiple paid business accounts for separate divisions, segments, or subsidiaries. We define an enterprise paid business account as a paid business account that we measure to have over 1,000 employees. >$100K and >$1M / year paid business accounts represents paid business accounts who have ARR greater than $100,000 or $1,000,000, respectively. We define our annualized revenue per average paid business account as the annualized revenue for the current period divided by the average of the number of paid business accounts at the end of the current period and the end of the prior period. Dollar-Based Net Expansion Rate Our dollar-based net expansion rate compares our recurring subscription revenue from customers from one period to the next. We measure our dollar-based net expansion rate on a monthly basis because many of our customers change their subscriptions more frequently than quarterly or annually. To calculate our annual dollar-based net expansion rate, we first establish the base period monthly recurring revenue from all our customers at the end of a month. This represents the revenue we would contractually expect to receive from those customers over the following month, without any increase or reduction in any of their subscriptions. We then (i) calculate the actual monthly recurring revenue from those same customers at the end of that following month; then (ii) divide that following month s recurring revenue by the base month s recurring revenue to arrive at our monthly net expansion rate; then (iii) calculate a quarterly net expansion rate by compounding the net expansion rates of the three months in the quarter; and then (iv) calculate our annualized net expansion rate by compounding our quarterly net expansion rate over an annual period. Free Cash Flow We define free cash flow as cash from operating activities minus purchases of property and equipment and capitalized software development costs. 26
27 Thank you.