Carving Up and Drilling Down: Business Intelligence For Revenue Cycle Management
|
|
|
- Rudolf Beasley
- 5 years ago
- Views:
Transcription

1 Carving Up and Drilling Down: Business Intelligence For Revenue Cycle Management Nate Moore CPA, MBA, FACMPE Manage your revenue cycle like your practice depends on it! 1
2 Learning Objectives Communicate your BI vision to IT staff by speaking their language and view example after example of revenue cycle tools currently used by practices nationally. Demonstrate different BI tools that deliver customized, automated data quickly and efficiently. Formulate practical ideas you can apply and catch the vision of what BI should mean to your unique practice s revenue cycle. Work with IT Communicate Comfort Convince 2
3 Work with IT It doesn t have to be in house IT if they don t exist or if they re too busy The Vision Spreadsheets, dashboards, s, maps and visualizations that automatically refresh and can be customized by end users without IT support 3
4 Vision Self Service BI Suite of new Microsoft tools to take BI to a whole new level Comfort Read Only Access 4
5 Comfort Report Server/Data Warehouse won t slow down the system Convince Old Model Build One Report = Get One Report 5
6 Convince New Model Build One Dataset = Get Dozens of Report Convince Get started with software you already own. 6

7 Convince If All Else Fails Unsold Appointments A picture is worth a thousand words... 7
8 Unsold Appointments Attracting Patients Who are the main referring physicians for my practice and what is my market share? 8
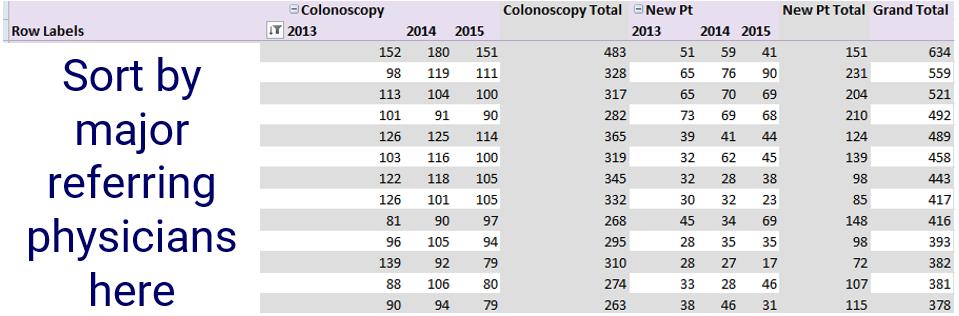

9 Referring Physicians Last New Patient 9
10 Referring Providers Market Share CMS Publicly Available Data From NPI To NPI 30/60/90/180 Day Interval At least 11 beneficiaries Referring Providers Market Share day interval data is 55 million rows 10

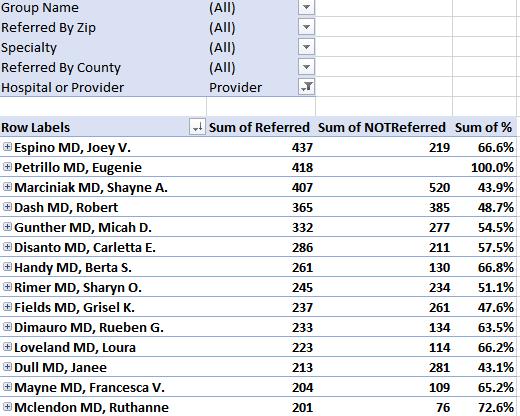
11 Referring Providers Market Share Referring Providers Market Share 11

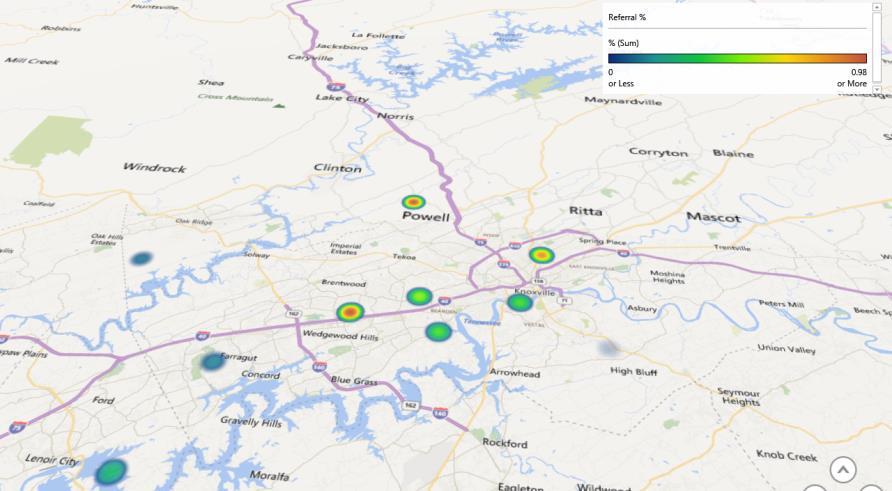
12 Market Share with 3D Maps Market Share with 3D Maps 12

13 Surgical Procedures by Provider Referring Physicians How can I apply these ideas to better track referring physicians? 13

14 Leverage Appointment Data How can I use appointment data to make my clinics more efficient? Average Days to Schedule 14


15 Days to Third Next Appointment Unsold Appointments 15


16 Unsold Appointments Yesterday s Cancelled Appointments 16


17 Available Cancelled Appointments Open Appointment Slots 17

18 Copays to Collect Copays Collected 18
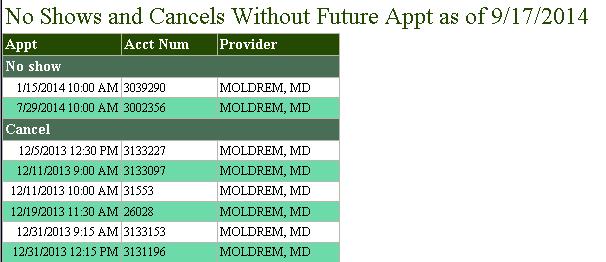

19 Procedure No Shows/Cancellations Which Provider to See Next 19


20 Global Period Appointments Follow Up After Yesterday s Appointments 20
21 Leverage Appointment Data How can I apply these ideas to mine my appointment data and make my practice more efficient? Dashboards How can I use custom dashboards to make my clinics more efficient? 21

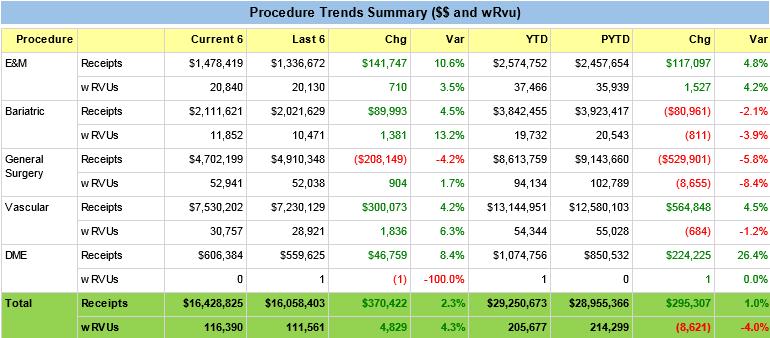
22 Financial Summary Financial Summary 22

23 Financial Summary Financial Summary 23


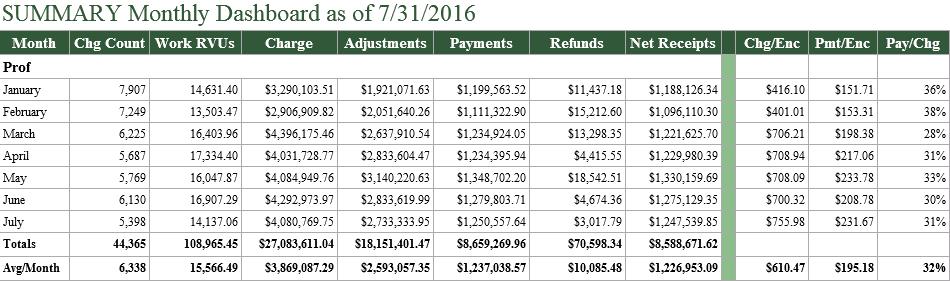
24 Practice Metrics Financial Summary 24

25 Provider Productivity Provider Productivity 25

26 A/R Collections Dashboards How can I apply these ideas to quickly communicate critical information in my practice? 26

27 Denials and Appeals How do I work denials and appeals quickly and effectively? Daily Contract Variance 27


28 Medicare Credit Balances Zero Pays with Appeal Tickler 28

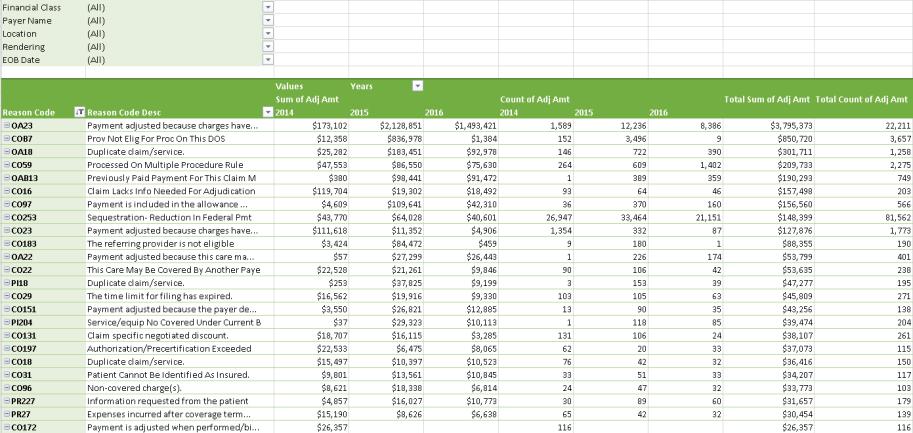
29 Adjustment Reason Codes Adjustment Reason Codes 29
30 Denials and Appeals What can I do differently to improve my practice s response to denials? Power BI New Power BI tools as time permits 30
31 Power BI Power BI 31

32 Power BI Power BI 32


33 Power BI Natural language Q&A Pin favorite visuals to dashboards Power BI 33

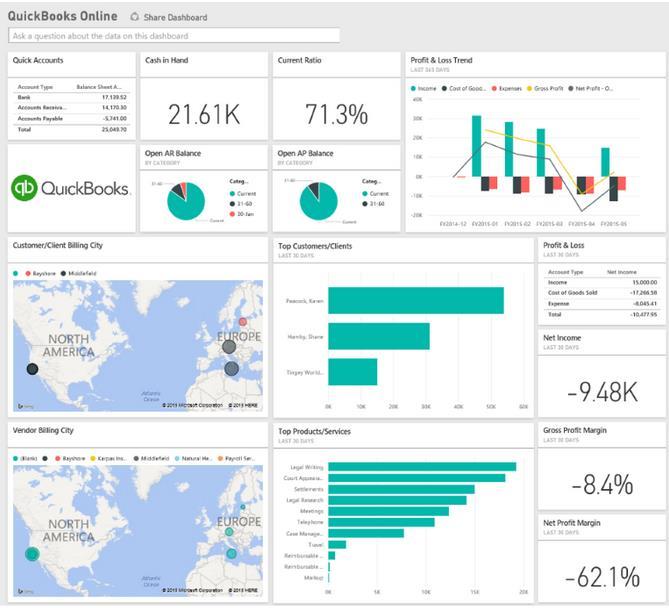
34 Power BI This is my ipad! Sample QuickBooksOnline Dashboard 34
35 More BI Tools Power Query Extract, Transform, and Load Be careful with production data! More BI Tools Power Pivot 35
36 BI Tools Don t forget about SSRS ability to push data Does this remind you of your canned reports? 36

37 We can do better! 37
38 Vision Which examples hit home for your practice? What will you do to have reports like this by January? Get Started Get access to your PM/EHR data in datasets 38
 Next Steps Watch Excel")
39 Get Started Learn how to use one tool (Pivot Tables/SSRS/Power BI) Next Steps Watch Excel Videos 39

40 Next Steps Get Started Create one report that will significantly impact your practice s operations 40
41 Get Started The solution is not simply, Call IT. Login to Join Excel Users MGMA Community Go to My Profile, then click on My Subscriptions from the submenu Choose your delivery preferences for the communities you wish to join Direct link Excel Users is in alphabetical order 41

42 Keep Your Clinic From Looking Like This Nate Moore MooreSolutionsInc.com PivotTableGuy 42