Implementation of a Risk-Centric Optimized Decision Making Approach to Corporate Asset Management at the Region of Peel
|
|
|
- Sherman Boone
- 5 years ago
- Views:
Transcription
1 0.5 Implementation of a Risk-Centric Optimized Decision Making Approach to Corporate Asset Management at the Region of Peel Age (Years) Condition Data80 Points of Interest Trend Projects Technology Outputs ARM Report 2.5 Condition Risk Management Strategy Level of Service Strategy Lifecycle Management Strategy ODM (Optimized Decision Making) Asset & Reserve Management Strategy State of Reserves State of Infrastructure Strategic Asset Plan 100 Annual Budget ($M) Required Funding Year Funding Strategy CNAM Workshop Ottawa, Ontario Troy Mander, Region of Peel David Baldesarra, UEM Consulting

2 The Region of Peel Almost 1.2 million people Over $14B in capital assets Public services include: Public Health, Long-Term Care, Police, Paramedics, Roads, Solid Waste Management, Housing, Homeless Support, Transhelp, Child Care, Water and Wastewater
3 CAM s Function CAM Provide an organizational perspective on state of infrastructure, asset needs and priorities Facilitate organizational asset decision making Assist the organization to improve service delivery Frontline Asset Management is the program s area of expertise!
4 CAM Framework & Projects Projects Technology Outputs ARM Report Risk Management Strategy Level of Service Strategies Lifecycle Management Strategies ODM (Optimized Decision Model) Asset & Reserve Management Strategy State of Reserves State of Infrastructure Strategic Asset Plan
5 Connecting Services to Asset TLOS Strategic Service Objective Customer Level of Service Affected Asset Class Risks Technical Level of Service Example: Pavement Potholes Pavement Condition Index = 70 A safe, reliable road network Safe Roads Structures Excessive Bridge Deck Cracking Bridge Condition Index = 80 Ancillary Road Assets Tilting Noise Wall Noise Wall Condition Index = B
6 Risk Profiles Unmitigated/ starting risk: Inherent Risk Mitigated/ remaining Risk: Residual Risk Current Level of Risk: Current Risk Inherent Risk Residual Current Risk Risk High Density Low 202 Risk Medium Risk High Risk Medium Density Low Density High Local Density Distribution 202 Main (<400mm) Roads Medium Density Low Density Local Distribution Main (<400mm) Roads Inherent Risk Residual Risk Current Risk 337
7 Optimized Decision Modeling Peel s ODM process takes a risk-centric approach to aid strategic decision-making Optimizes funding across all asset groups i.e. How do we best stretch the citizens tax dollar? Helps prioritize asset needs The engine behind the strategic asset management report
8 ODM Functions Calculates & forecasts: asset investments to maintain or improve service delivery levels of service & risk over time
9 ODM Functions Utilizes lifecycle strategies to predict asset condition & risk 0 Age (Years) Unit Breaks (Breaks/ km) CI DI PVC 25 30
10 ODM Process Asset Management Knowledge Base: Asset Hierarchies Risk levels Technical Levels of Service Costing data Typical Life-cycles Service improvement objectives ODM ARM ARM Reports: Reports: Forecasts: Forecasts: Expenditure Expenditure Needs Needs Assets Assets Management Management and and Reserve Reserve Plans Plans Asset Databases


 0 10 20 30")

 15 20 25 30 CI DI")


11 CAM and ODM CAM Residual Current Inherent Risk Risk Risk Low 202 Risk Medium Risk High Risk High Density Medium Density Low Density High Local Density Distribution Main (<400mm) Roads Medium Density Inherent Risk 177 Low Density 118 Residual Risk 157 Current Risk 204 Local Distribution Main 143 (<400mm) 204 Roads Region of Peel Paramedic Services Wastewater ODM Age (Years) Waste Management Unit Breaks (Breaks/ km) CI DI PVC A safe, reliable road network Safe Roads Pavement Structures Potholes Excessive Bridge Deck Cracking Pavement Condition Index = 70 Bridge Condition Index = 80 Ancillary Road Assets Tilting Noise Wall Noise Wall Condition Index = B
12 Data Types 1. Detailed Condition Data Available Lifecycle curve creation (watermains) Building from current AM systems (roads) 2. Forward Works Program Inspection and work plans (Buildings) 3. Limited Asset Data Estimated Service Life Analysis
13 Lifecycle Curve Creation Age (Years) Condition Data Points of Interest Trend Condition
14 ODM Pilot A Practical Example 1. Distribution Mains 2. Roads Detailed condition data available Lifecycles created based on condition data Lifecycles in place already Sourced from current AM systems 3. Social Housing Forward works program in place Sourced from current works program data
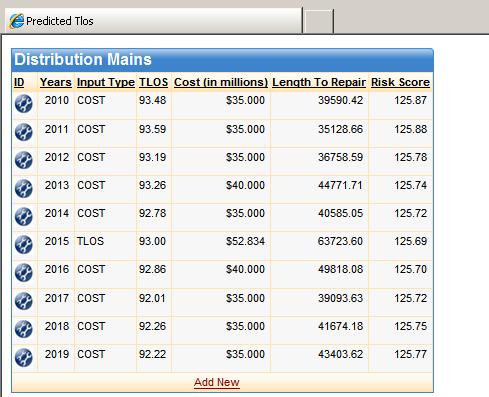
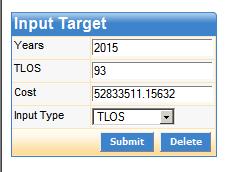
15 ODM Calculations
16 ODM Assessing Spending Requirements Replacement Cost ($M) Year Social Housing Roads Local Distribution Mains
17 ODM Allocating Funding Risk Score Reduced per $M Years Social Housing Roads Local Distribution Mains
18 Optimized Budget Forecasting Annual Budget ($M) Year Required Funding Funding Strategy
19 Lessons Learned Stakeholders must understand the value of AM Make it understandable & logical Keep the momentum going Don t get bogged down in making the system perfect the first time it won t be Equality for all Programs (hard & soft services) in the development of the AM strategies
20 Lessons Learned Allow significant time & resources to organize & screen the data to provide meaningful information Keep the perspective strategic planning is the Corporate objective Component planning is the Program s expertise & domain
21 Conclusion Benefits of Strategic AM A transparent method to prioritize organizational asset needs & rationalize Program budgets Demonstrates responsible stewardship of resources to the public Increases credibility with Council Moves the debate from short-term issues to long-term objectives & strategies
22 Thank You Questions?