Sage ERP MAS 90 and Intelligence Release Notes
|
|
|
- Sybil Elliott
- 5 years ago
- Views:
Transcription

1 Sage ERP MAS 90 and Intelligence Release Notes
2 Table of Contents 1 New Reporting Trees Reporting Tree Example Reporting Trees Linking Reporting Tree Units to Distribution Instructions New Report Distribution Process Flow BI Tools Tab Extension Distribution Instructions File Publish File Transfer Protocol (FTP) Automated Report Distribution Report Designer Progress Bar Improved Refresh Data in Report Designer Easier Right Click Drill Down Remember Login Credentials Universal Query Engine Performance & Efficiency Improvement Financial Reports Performance Improvement (Up to 6x Faster) New Reports: Aggregated Financial Reports and Financial Reports Designer New BI Tools Tool Tips Added Numerous Report Improvements

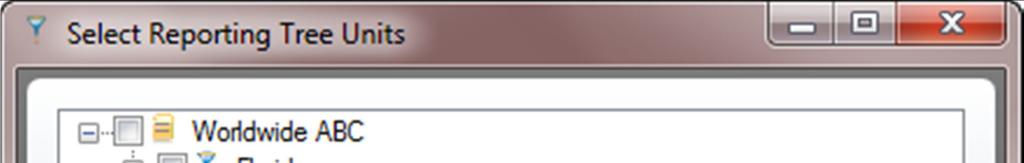
3 1 1.1 New Reporting Trees Reporting Tree Example 1.2 Reporting Trees One the highlight features within MAS 90/ Intelligence is the inclusion of Reporting Trees. Although you can create financial reports without the aid of a reporting tree, a reporting tree allows you to model a very sophisticated reporting structure and view your organization in many different ways with the click of a button. Some companies may have very complex corporate hierarchies that require hundreds of tree units, as well as other hierarchies that require much fewer tree units. Most organizations have a hierarchical structure in which departments (or other business units) report to one or more higher-level units. In a traditional organizational chart, the lower units on the chart typically report to increasingly higher units. Sage MAS 90/ Intelligence uses the term reporting unit for each box in an organizational chart. A reporting unit can be an individual department from the general ledger, or it can be a higher-level, summary unit that combines information from other reporting units. For a Report Designer layout that includes a reporting tree, one report is generated for each reporting unit and at the summary level. All of these reports use the text columns, row and column layouts that are specified in the Report Designer. Each reporting tree contains a group of reporting units. Sage MAS Intelligence allows you to easily add or change reporting units without requiring a change to your financial data. After saving a Reporting Tree, simply link it to one or more Report Designer layouts that you have saved within your workbook. Financial Reports Designer > BI Tools tab Consolidated Financial Reports Designer > BI Tools tab 2

4 Screenshots 3


5 4
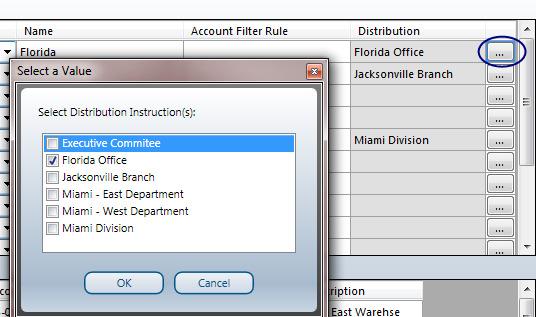
6 1.3 Linking Reporting Tree Units to Distribution Instructions Once a report is generated using MAS 90/ Intelligence, Distribution Instructions need to be selected manually to set up links between worksheets inside a report and available Distribution Instructions. These links or relationships are stored within the report workbook only meaning that every new workbook needs to have the links set up manually. The new Reporting Tree enhancements made to the Report Designer in MAS 90/ Intelligence allows users to save time by eliminating the need to manually select Distribution Instructions every time a new report is generated. By specifying which Distribution Instructions should be linked to each Reporting Tree unit before layout generation, these settings are stored inside the Reporting Tree which saves its data centrally with the MAS 90/ Intelligence reports repository. Once a Reporting Tree has Distribution Instructions linked to any of its units, relationships between the resulting worksheets and available Distribution Instructions will be set up automatically during layout generation, saving users the need to manually set these relationships up. Report Designer Enabled Report > BI Tools Toolbar > Reporting Trees Screenshots 5
7 6


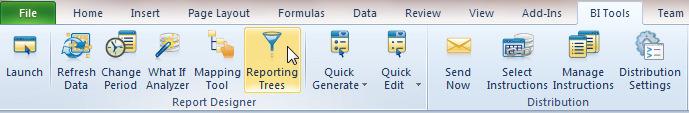
8 3 New Report Distribution Improve workflow and speed up business processes by automating report delivery and distribution. Report distribution is a powerful feature which saves time and effort by allowing you to send reports to a file, ftp site or in a number of standard formats. Simply set up which reports you would like to distribute, whether you would like them in Microsoft Excel, MHMTL or PDF and who it should be sent to. You can even create custom criteria for sending out reports. Features include the ability to customize each format, use your existing outlook profile and address book, or specify a SMTP or Exchange server. The same report can be set up to be distributed to different destinations. Distribution is ideal for sending reports out to line managers or providing corporate management with tailored reports. 3.1 Process Flow 3.2 BI Tools Tab Extension The BI Tools tab now contains additional functionality to cater for the new powerful report distribution engine within MAS 90/ Intelligence. Any MAS 90/ Intelligence Report > BI Tools Tab Screenshot 7

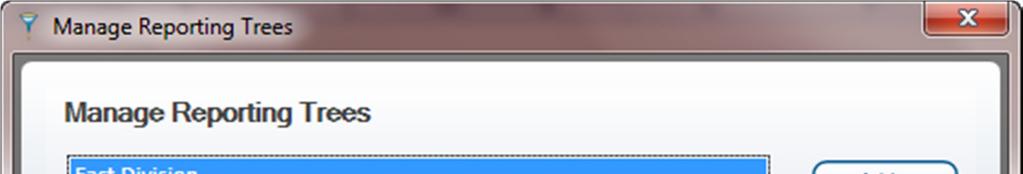
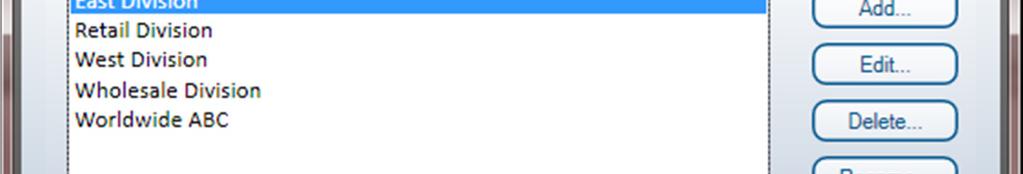
9 3.3 Distribution Instructions Distribution Instructions save time by sending reports, along with pertinent information, automatically to the right person/people using the chosen electronic method. Use the Manage Distribution Instructions to set up different instructions for each report that requires a unique distribution method, i.e. distributed to different people or via different methods e.g., , FTP or File Publishing. Any MAS 90/ Intelligence Report > BI Tools Tab > Manage Instructions > Add Screenshots 8
10 Distributing your reports via rich text s is now possible with the functionality found within a Distribution Instruction. Choose a format to attach your reports as from a selection including PDF, HTML and XLSX. Look out for the powerful Cell References which allow you to place a reference to your report within your allowing you to pull pertinent report data directly into your . Any MAS 90/ Intelligence Report > BI Tools Tab > Manage Instructions > Distribution Instruction > tab Screenshot 9
11 3.3.2 File Publish Easily distribute your reports to locations within your business s network using the File Publish feature within a Distribution Instruction. Choose the format you would like to publish your reports as including PDF, HTML and XLSX. Any MAS 90/ Intelligence Report > BI Tools Tab > Manage Instructions > Distribution Instruction > File Publish tab Screenshot 10
12 3.3.3 File Transfer Protocol (FTP) Distributing your reports to a FTP location is not a problem with the FTP distribution feature found inside a Distribution Instruction. Choose the format you would like to distribute your reports as including PDF, HTML and XLSX. Any MAS 90/ Intelligence Report > BI Tools Tab > Manage Instructions > Distribution Instruction > FTP tab Screenshot 11
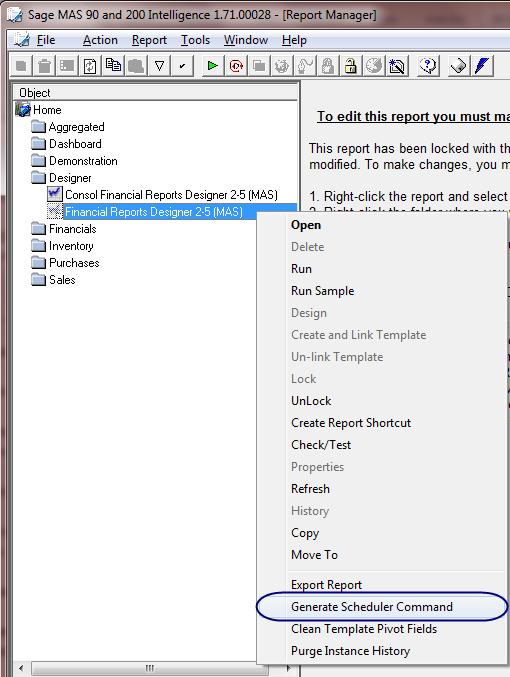
13 3.4 Automated Report Distribution MAS 90/ Intelligence gives you the ability to set up convenient fully unattended report distribution. Once the required Distribution Instructions are setup and linked to worksheets within a report, users can flag the linked distribution instructions to be automatically sent whenever the current report is run by a Scheduler Command within the Report Manager. Any MAS 90/ Intelligence Report > BI Tools Tab > Select Instructions Screenshots 12
14 13

15 4 Report Designer Progress Bar Previously when generating layouts with the Report Designer software there was no way to cancel the generation of a report layout mid-way. This meant that if a mistake was made during the design of the layout, users would need to wait until the layout had finished generating before being able to correct the design mistake. Furthermore there was no indicator for users to track the progress of the layout generation. MAS 90/ Intelligence now displays a progress bar when any layouts are generated using the Report Designer. This progress bar has a Cancel button allowing users to cancel report layout generation before the report has finished generating. Especially useful for eliminating the need to wait unnecessarily if large datasets are being reported off. Financial Report Designer > Report Designer > Generate Layout Screenshot 14

16 5 Improved Refresh Data in Report Designer The Refresh Data function refreshes the data in your workbook. For example if someone has added new accounts in your accounting package, and you have created and linked a layout, the refresh data will bring through all new accounts or remove deleted accounts if you have created and linked the layout Previously in MAS 90/ Intelligence, using the Refresh Data function within any Report Designer enabled report (i.e. Financial Reports Designer) would result in any new accounts being highlighted in a color and moved to the bottom of the account grouping within the open report this would require you to do some manual formatting and reordering work to get your report presentable. Improvements have been made to the Refresh Data function within MAS 90/ Intelligence to ensure that you no longer need to perform any manual work after new accounts are discovered. The Refresh Data function will now ensure that all new accounts are placed into the correct account groupings in the correct order (ordered by account number) with the same formatting as the rest of the report (complex custom formatting support is limited). Financial Reports Designer > BI Tools Tab > Refresh Data Screenshot 15
17 16

18 6 Easier Right Click Drill Down The current method for drilling down into transactional detail on Financial Reports is to select an account value, navigate to the Add-ins section within Microsoft Excel, select Report Tools and then Drill Down. In MAS 4.5 Intelligence this has been simplified and all that is required now is to right click on the value you would like to drill down on and then select Drill Down. As before this will display the Select Drill Down dialog screen which allows you to execute one of the available Drill Down reports. This Drill Down context menu option will only appear if a MAS Intelligence Report has been loaded into Microsoft Excel. Financial Reports > Right Click Context Menu Financial Reports Designer > Right Click Context Menu Screenshots 17


19 7 Remember Login Credentials When logging into MAS 90/ Intelligence you now have the option to either save your User and Database credentials or not save them. If security is very important, you can choose for the login form to not remember your credentials so that unauthorized access is prevented. Login Sage MAS 90 and 200 Intelligence Screenshot 18
20 8 Universal Query Engine Performance & Efficiency Improvement To cater for limitations within the MAS 90 ProvideX ODBC driver, MAS 90/ Intelligence utilizes the Universal Query Engine (UQE) to transfer reporting data into a Microsoft SQL Compact Database before running complex data manipulation queries. Many enhancements have been made to the UQE in MAS 90/ Intelligence to improve the performance and efficiency of this engine, resulting in quicker report executions. UQE is now using a newer version of SQL Compact Edition. Parsing of the SQL query has been sped up. Improved speed of data cache creation. UQE engine can now understand SQL hints - this can reduce the amount of data stored in the data cache - this in turn speeds up query performance. Hints have been added to the Financial Reports container to restrict the amount of data being returned - this has resulted in improved performance of the UQE in the Financial Reports Designer report and Financial Reports. Improved error trapping any UQE errors are now more descriptive allowing users to better understand why their reports are failing. Run any MAS 90/200 ProvideX 4.5 Intelligence Report 19

21 Screenshot 20


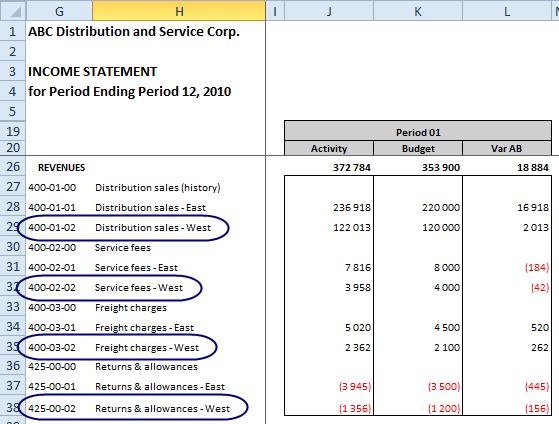
22 9 Financial Reports Performance Improvement (Up to 6x Faster) The Financial Reports report within MAS 90/ Intelligence uses an add-in called TBSync to manage the process of inserting financial data into Microsoft Excel. This TBSync add-in has been significantly improved within MAS 90/ Intelligence to ensure that financial data is inserted into Microsoft Excel faster than ever. Additionally the Financial Reports Container also takes advantage of the new SQL hints feature within the Universal Query Engine, allowing overall report execution to be improved significantly. Run Financial Reports report. Screenshot 21
 of rows being pulled through into Excel on large MAS 90/200 databases - this can have a negative impact on performance.")
23 10 New Reports: Aggregated Financial Reports and Financial Reports Designer The current Financial Reports and Financial Reports Designer reports are pulling through the lowest level of transactional detail resulting in large quantities (20000+) of rows being pulled through into Excel on large MAS 90/200 databases - this can have a negative impact on performance. These new reports will allow users to run the Financial Reports and Financial Reports Designer aggregated to natural account and one other segment. Report Manager > Aggregated Folder Screenshot 22


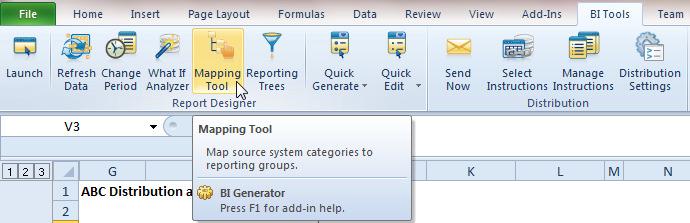
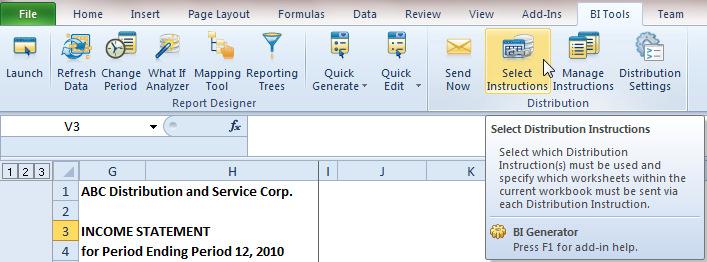
24 11 New BI Tools Tool Tips Added Useful Tool Tips have been added to selected buttons within the BI Tools ribbon tab to ensure the purpose of each function is clear. Simply hover a cursor over the button and the tool tip will appear automatically. Report Designer Buttons Financial Reports Designer > BI Tools Tab Distribution Buttons Any MAS 90/200 Intelligence Report > BI Tools Tab Screenshot 23
25 24

26 12 Numerous Report Improvements Many of the reports that shipped with MAS 90/ Intelligence have been improved to ensure they are even easier to use and professionally presented. You will find newer versions of most reports available within MAS 90/ Intelligence. Report Manager Report Viewer Screenshot 25