Forward-Looking Statements
|
|
|
- Ezra Atkinson
- 5 years ago
- Views:
Transcription

1
2 Forward-Looking Statements The plans, performance forecasts, and strategies appearing in this material are based on the judgment of the management in view of data obtained as of the date this material was released. Please note that these forecasts may differ materially from actual performance due to risks and uncertain factors such as those listed below: Intensification of price competition in the marketplace Change in economic trends surrounding our business Major fluctuations in capital markets Fluctuations in currency exchange rates, particularly with respect to the value of the Japanese yen and the U.S. dollar Increases in prices of raw materials Change in the tax environment CCEJ's ability to realize production efficiencies and to implement capital expenditures at the levels and times planned by management; CCEJ's ability to market and distribute effectively Uncertain factors other than those above The information in this presentation is provided for informational purposes and should not be construed as a solicitation of an investment in our securities. You should rely on your own independent examination of us before investing in any securities issued by our company.

3


4 A World-Class Japanese Bottler Encouraging Results in 2013 Discussion of Full-Year 2013 Normalized Results Positioning for Growth in Full-Year Plan Reasons to Believe Growth, Synergies, Infrastructure, People Our Q&A Roadmap for Sustainable Growth
5 ENCOURAGING RESULTS IN 2013
6 Our Roadmap for Sustainable Growth 2013 Still Early in Our Roadmap Forming OI Margin +1 pt Storming Define & deploy new bus. model OI Margin +1-2 pts Norming Refine & optimize new business model OI Margin +1-2 pts Performing Approaching global bottler performance levels Tokyo Olympic Games & Beyond Accelerating Meet & exceed world-class bottler levels Speed of integration: 250+ projects Identifying synergies & positioning for growth Process reengineering & launch of ERP system while delivering first results Exploiting new architecture as competitive advantage to drive synergies & growth A world-class Japanese bottler on the world stage

7 Strategic Priorities Growth Realign against current strength and future Growth Speed Unprecedented speed and scope of change Synergies Reduce costs and drive efficiency Infrastructure Create optimal operating structure People Build a worldclass, modernized workforce

 +0.6 ppt volume +0.")


8 We are on Track and Delivering Early Results Measure Volume Share* Operating Margin 2013 Results +1.60% (unit case) +0.18% (physical case) +0.6 ppt volume +0.4 ppt value ppt vs. Plan OI grew +2% vs. Plan One+ Roadmap for Sustainable Growth Volume growth ahead of industry performance Improving operating margin Progress Check Capabilities Top 120 Leader Training: Phase 1 done Metrics & Scorecards Strong focus on improving capabilities *Q4 Intage, OTC
 +0.18% +1.53% 425,099 (UC) +1.56% +4.26% Market Share* vs. Prior Year Full Year Q4 Volume -0.3 +0.6 Value -0.3 +0.4 Volume Share vs. Prior Year +0.7 +0.9 +0.")
9 Jan Feb Q4: Initial Signs of Market Share Improvement Mar Apr May Jun Jul Aug Sep Oct Nov Dec Jan Feb Mar Apr May Jun Jul Aug Sep Oct Nov Dec Sales Volume 2013 Actual vs. Prior Year Full Year Q4 284,014 (BAPC) +0.18% +1.53% 425,099 (UC) +1.56% +4.26% Market Share* vs. Prior Year Full Year Q4 Volume Value Volume Share vs. Prior Year Value Share vs. Prior Year (0.9) (0.8) (0.5) CCEJ (0.6) (0.7) (0.5) (0.3) CCEJ Source: Intage, OTC channel


10 Focus on Execution is Starting to Deliver Results Sales Equipment Net Increase Change from 2012 end cumulative Volume & Commercial NSR 32 Top SKU Coverage vs. Plan Market Share


11 Expanding New Route-to-Market Model Reorganized Commercial Structure
12 Rapidly and Actively Integrating As Committed Projects Office relocation complete. 2,000+ people moved. Legacy HQ offices closed. Production company consolidation complete. From 4 companies to 1 CCEJP. Next phase of legal entity consolidation started (26 on Day One to 11 by 2015). Divestment of non-core asset Mikuni Wine approved by BOD. Initial manager-level VSP complete. Additional plan confirmed by BOD.
13 Rapidly and Actively Integrating As Committed Capabilities and Infrastructure Commercial reorganization complete; Model market program expanding New Chief Information Officer appointed CokeOne world-class ERP approved by BOD. Kick-off on February 14, of top 120 leaders are external hires from within Japan Initial employee engagement surveys confirm alignment and understanding of One+ Roadmap plan and targets
14 Delivering Operating Income Above Plan Growing sales volume in a year of transition and integration Delivering supply chain synergies to partially offset pricing environment Accelerating operating expense savings in 2013 to grow OI margin versus plan Sales Volume (BAPC) (,000 cases) 2013 FY Pro-Forma in million yen 2013 FY One-time items 2013 FY Normalized 2012 FY Pro-Forma Estimate Vs. PY Vs. Plan* Diff % % 284, , , % -0.50% Net Revenue 533, , ,146 (9,544) -1.76% -0.61% COGS 287,949 (951) 286, ,475 (8,477) -2.87% NA Gross Profit 245, , ,671 (1,067) -0.43% -0.72% SG&A 236, , ,902 (538) -0.26% NA Operating Income 9, ,240 10,689 (449) -4.20% +2.40% Ordinary Profit 8, ,492 10,089 (597) -5.92% +4.31% Net Income 11,694 (6,001) 5,693 5, % +7.42% *Plan= Nov 14, 2013 analyst presentation
15 Drivers of Operating Income vs. Prior Year Production savings offsetting continued top-line pressure from competitive pricing environment and channel mix trends. We continue to invest in our brands, with DME up +3%. Benefits expense was down as a result of purchase price allocation related to the CCEJ integration and changes in pension actuarial assumptions. In million JPY 10,689-5,813 +5,987-1,057 Elimination of unrealized gain in stock -1,135 Other Subs -1,808 DME +2,004 Benefits Expense +485 Other OPEX +888 Non-Recurring Expense ,240 Price & Mix SCM 2012 Pro-forma Operating Income 2013 Actual Normalized Operating Income 15
16 Drivers of Operating Income Improvement vs. Plan* In million JPY ,000 Production cost reductions partially offset the impact of lower volume and increased pressure from channel mix. Benefit from accelerated OPEX savings more than offset this pressure. Estimate for non-recurring items changed vs. 11/14 plan with better clarity on the nature of one-time vs. recurring expenses. 10, Plan Normalized Operating Income OI margin 1.86% *Plan= Nov 14, 2013 analyst presentation 2013 Actual Normalized Operating Income OI margin 1.92% 16


17 Channel Mix Pressure Accelerated in Q4 FY Volume By Channel (% of total volume) Channel Volume Growth Vending 31% Other 10% Eating & Drinking 14% Supermarket 22% Drug & Discount 10% CVS 13% Total BAPC Volume Growth Full-Year % Q % vs 2012 D&D CVS Local SM Nat l SM Eat & Drink VM FY +5% +1% +3% -1% 0-2% Q4 +14% +7% +4% -2% 0-2%


18 Category Mix Trends in Q4 Also Diverged FY Volume by Category (% of total volume) Sparkling 27% Tea 20% Sports 11% Other 12% Coffee 15% Water 9% Juice 6% Category Volume Growth Total BAPC Volume Growth Full-Year % Q % vs 2012 SSD NST Sports Water Coffee Juice FY +1% +4% +2% -2% -4% +2% Q4 +4% +6% +3% +2% -3% +2%
19 POSITIONING FOR GROWTH IN 2014
20 CCEJ Full-Year 2014 Estimate Highlights OBPPC initiatives driving year-on-year sequential revenue improvement Capturing continued supply chain synergies to benefit gross profit Strong OI growth leads to operating margin growth in line with One+ Roadmap Sales Volume (BAPC) (,000 cases) 2014 FY Pro-Forma Estimate in million yen 2014 FY One-time items 2014 FY Normalized Est 2013 FY Normalized Vs. PY Diff % 287, , ,014 3,742 +1% Net Revenue 535, , ,602 2,198 +0% Gross Profit 253, , ,604 7,296 +3% Operating Income 15,000 15,000 10,240 4, % Ordinary Profit 14,400 14,400 9,492 4, % Net Income 6,400 +4,000 10,400 5,693 4, % OI margin 2.8% OI margin 1.9%
21 Drivers of Operating Income Estimate vs. Prior Year In million JPY +1,122 OPEX -862 DME -1, ,760 Depreciation Non-Core Business ,915 Volume growth forecast of +1% with flat NSR. Continued supply chain synergy capture as part of our commitment to achieve JPY billion in savings by Continued investment in marketing in another transition year. Increase in depreciation as a result of the investments we are making in vending machines and cold drink equipment. 15,000 10,240 Sales Increase SCM 2013 Normalized Operating Income 2014 Plan Normalized Operating Income 21
22 REASONS TO BELIEVE IN 2014
23 Strategic Priorities 23 Growth Realign against current strength and future Growth Speed Unprecedented speed and scope of change Synergies Reduce costs and drive efficiency Infrastructure Create optimal operating structure People Build a worldclass, modernized workforce
24 2014 Growth: Positioning for the Future Growth Realign against current strength and future Growth 2014 Occasion, Brand, Pack, Price, Channel Segmentation Defined Channel Priorities & Roles Recruitment, Incidence & Frequency Over 15 New Packages Volume (BAPC): +1% to 2%, NSR: even, Market share growth

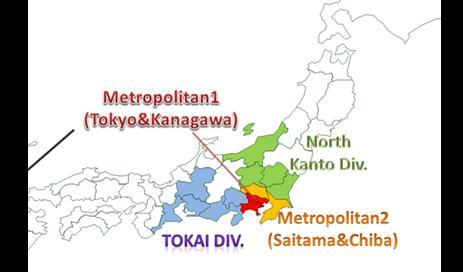
25 2014 Roadmap: Channel Priorities Growth Realign against current strength and future Growth 2014 Channel Focus Vending, Key Accounts, HORECA Vending Focus on High-Potential Locations +5,000 net increase of indoor vending machines Allocate location hunters to Tokyo, Kanagawa & Aichi Leverage energy-saving Peak Shift equipment and cashless function Win in Key Accounts Targeted key account management with cross-functional account teams Drive Availability in Hotel, Restaurant and Café (HORECA) HORECA 15,000 new outlets and 9,000 new coolers Improve in-store execution using new tools and metrics
26 Commercial Roadmap: Solid Growth Pillars Growth Realign Coca-Cola against Japan System current Presentation strength and February future 27 Growth 2014 Category Growth Priorities in Alignment with Coca-Cola Japan Coffee +1%: Coffee Revival New campaign Weekly Georgia launched in January New flavor launches: Georgia Katakuna Win in vending with OBPPC segmentation Sparkling +2%: Recruitment & Retention Led by Coke TM FIFA World Cup, Coke with Meals In-Store & Occasion-Based Merchandising Coca-Cola Zero Limit Campaign #2 Non Sugar Tea +6%: Innovate & Grow to Accelerate Momentum Sokenbicha 20 th Anniversary Innovation to continue to expand the category
27 Strategic Priorities Growth Realign against current strength and future Growth Speed Unprecedented speed and scope of change Synergies Reduce costs and drive efficiency Infrastructure Create optimal operating structure People Build a worldclass, modernized workforce
28 2014 Synergies: Enabling the Business for Growth Synergies Reduce costs and drive efficiency 2014 ~60% 5-6 Billion Supply Chain Savings 2014 vs Strategic Infrastructure & Manufacturing Efficiencies 5 new bottling lines & PET in-line blowing Insourcing of production (from 65% to 90%) Maintenance cost reduction Improved yield management Positive environmental impact (water, energy usage) ~20% Dynamic Logistics Operations Increase in-house warehouse utilization Expand direct delivery Optimized truck-loading ~15% Package Optimization & Procurement Package light-weighting and standardization Procurement optimization
29 Strategic Priorities Growth Realign against current strength and future Growth Speed Unprecedented speed and scope of change Synergies Reduce costs and drive efficiency Infrastructure Create optimal operating structure People Build a worldclass, modernized workforce


30 2014 Infrastructure: Investing for Growth 2014 Infrastructure Create optimal operating structure Incremental CAPEX for synergy capture 8 billion incremental CAPEX in 2014 Currently exploring optimal financing options


31 2014 Infrastructure: Investing for Growth 2014 Infrastructure Create optimal operating structure Consolidation Consolidating Logistics & Equipment companies Transitioning from 6 to 2 call centers Equipment refurbishment facilities Warehouses CokeOne ERP* System for Business Transformation Standardize and integrate business processes across CCEJ based on world-class bottler best practices and SAP-based technology. Currently over 183 loosely integrated systems *ERP= Enterprise Resource Planning
32 Strategic Priorities Growth Realign against current strength and future Growth Speed Unprecedented speed and scope of change Synergies Reduce costs and drive efficiency Infrastructure Create optimal operating structure People Build a worldclass, modernized workforce
33 2014 People: Transforming for Growth 2014 People Build a worldclass, modernized workforce New Company-wide incentive program rollout Pay for Performance: volume, net sales revenue and operating income Greater variable incentive component for more impactful roles Additional capabilities development World-class leadership development for top 120 leaders Frontline leadership training for 500 commercial managers Centers of Excellence Strategic workforce alignment Holistic review of all options for optimizing organization 2013 voluntary separation plan complete: 50 people impacted 2014 voluntary separation plan confirmed by Board of Directors: 600 eligible population
34 A CLEAR PATH FOR GROWTH
35 Our Roadmap for Sustainable Growth 2013 Still Early in Our Roadmap Forming Speed of integration: 250+ projects OI Margin +1 pt Storming Define & deploy new bus. model Identifying synergies & positioning for growth OI Margin +1-2 pts Norming Refine & optimize new business model Process reengineering & launch of ERP system while delivering first results OI Margin +1-2 pts Performing Approaching global bottler performance levels Exploiting new architecture as competitive advantage to drive synergies & growth Tokyo Olympic Games & Beyond Accelerating Meet & exceed world-class bottler levels A world-class Japanese bottler on the world stage

36 Long-Term: By 2017 Performance Operational World-Class Performance Aspirations Market share Volume growth NSR growth #1 NARTD* Market share in our territory Greater than Industry performance Ahead of volume growth mid- to long-term OI margin** +4 pts by 2017 Employee Engagement Customer Satisfaction Capabilities * NARTD= Non-Alcoholic Ready-to-Drink Beverages ** On a comparable basis
37 Q Milestones Commissioning of two new lines and two new in-line blow molds Order placement for next four lines to be commissioned in 2015 Completion of call center consolidation from six to two centers (Nagoya, Okegawa) Introduction of new employee performance management & incentive program Implementation of second Voluntary Separation Plan Kick-off of CokeOne ERP implementation 2/14/2014 Coca-Cola Japan system meeting on 2/27

38 THANK YOU
39 Non-Recurring Items in 2013 Full-Year Results Non-Recurring Items P/L Line Items 2013 FY P/L Line Items 2013 FY COGS Elimination of Unrealized Gain in Stock; Accounting Standardization In million yen 951 OPEX Accounting Standardization 148 OPEX Purchase Accounting -821 Extraordinary Profit Extraordinary Loss Extraordinary Loss One-time gain from negative goodwill In million yen -12,969 Integration cost 1,425 Other 5,037 OPEX Restructuring Charges 610 Below OI -6,001 Total non-recurring items in Operating Income 888