WWH Capital Markets Day 17 September 2015
|
|
|
- Dale Sims
- 5 years ago
- Views:
Transcription

1 WWH Capital Markets Day 17 September 2015 Dag Schjerven, President & CEO WMS portfolio strategy Neal De Roche, Regional VP Asia Pacific WSS Wilhelmsen Ships Service and the Asia Pacific Region
 ~ 25% fleet penetration (equipment)")
2 The world s largest maritime network ~ 400 operational offices ~ 75 countries ~ onshore employees ~ seafarers ~ port calls p.a. ~ ships served annually ~ 50% fleet penetration (services) ~ 25% fleet penetration (equipment)
3 WMS revenue overview 2014 WMS Revenue split (MUSD) WMS 2014 revenue: 1101 MUSD Newbuilding Market Operating fleet 4% 96% 70% 30% % % 0% 100% 56 5% % 75% 3 Note: % represents the relative share of WMS total revenue 3
4 Robust financial performance - Stable activity strong margin Total income MUSD EBIT margin % % 0% 16% 12% 8% 4% 0% * 2015** -4% Revenue EBIT margin 8.1% 7.2% 8.3% 8.9% 9.1% 6.0% 7.2% 7.6% 7.9% 10.7 % 4 Total income EBIT margin % CAGR *) 2014 excluding pension gain, **) 2015 first half results annualized
5 Key driver for future growth (#1) - Emerging markets continue to drive growth Actual and projected GDP growth for selected countries / regions, F 5.4% Prognosis 4.2% 3.9% 3.8% 3.4% 3.8% 3.9% 3.4% 3.4% 3.5% 4.0% Percent of world GDP * CAGR RoW 7.0 % 3.3 % 3.9 % Australasia ** 1.2 % 2.4 % 3.0 % Korea 1.6 % 3.2 % 3.6 % ASEAN 6.0 % 5.0 % 5.4 % Latin America and Caribbean *** 5.5 % 2.9 % 2.8 % Japan 4.3 % 0.3 % 0.8 % Middle East and Africa 9.8 % 4.0 % 4.2 % Brazil 2.9 % 2.7 % 1.6 % China 16.9 % 8.6 % 6.3 % EU 16.9 % 0.1 % 1.9 % USA and Canada 17.6 % 1.4 % 2.5 % India 7.1 % 7.4 % 7.6 % Russia 3.1 % 1.1 % 0.1 % 0.0% *) Based on purchasing power parity (PPP) for **) Australasia is Australia, New Zealand and Papua New Guinea. ***) Latin America and Caribbean excl. Brazil. Source: IMF, WEO April 2015
6 Key driver for volume growth (#2) - Global fleet continue to grow World fleet development # of vessels >1000 GT Prognosis Fleet size (#) 2015F CAGR Tanker % 2,4 % Of which: Crude % 2.6% Chemical / Products % 0.7% LPG & LNG % 4.4% Bulk & general cargo % 1.2% Container & ro-ro % 1.8% Of which: Vehicle % 1.4% Passenger % -0.2% Of which: Cruise % 1.4% Offshore & services % 2.2% Of which: PSV & AHTS % 3.2% Misc % -0.1% Total % 1.4% Tanker Bulker & general cargo Container & ro-ro Passenger Offshore & service Misc. 6 Source: maritime-insight, Shipbuilding outlook club, August 2015
7 Key driver for volume growth (#3) - Still challenging market conditions for many WMS customers Clarksea Index* (YTD Aug) KUSD/d Peak in late KUSD/d 48.5 KUSD/d Peak in late 2007 and start avg. of 16.0 KUSD/d Peak in early KUSD/d 19.7 KUSD/d Rebound in mid 2010 and year end 2013 / start KUSD/d Avg. 12KUSD/d Avg. 22KUSD/d Avg. 12KUSD/d *Clarksea Index is a weighted average of earnings by tankers, bulkers, containerships and gas. Source: Clarkson. 7
8 WMS portfolio strategy ENGINEERED INSULATION SAFETY PRODUCTS SOLUTIONS SHIPS AGENCY SHIP MANAGEMENT Ambition to regain some of the strong growth experienced from 2005 to 2008 Seek growth through acquisitions and partnership in core areas Reduce ownership in non-core areas Continue to develop business areas synergies across current structures 8


9 WMS portfolio strategy ENGINEERED INSULATION SAFETY PRODUCTS SOLUTIONS SHIPS AGENCY SHIP MANAGEMENT Strategic direction Divest or JV Ongoing process 9
10 WMS portfolio strategy ENGINEERED INSULATION SAFETY PRODUCTS SOLUTIONS SHIPS AGENCY SHIP MANAGEMENT Strategic direction Under consideration Regulatory driven Operational strategy Right-size both organisations Bundle the offers and seek more agreement based contracts 10
11 WMS portfolio strategy ENGINEERED INSULATION SAFETY PRODUCTS SOLUTIONS SHIPS AGENCY SHIP MANAGEMENT Strategic direction Growth through acquisitions and solution development Strengthen the position in Asia / emerging markets Operational strategy Leverage existing global network and transform the supply chain Rationalise the product portfolio and develop digital solutions 11
12 WMS portfolio strategy ENGINEERED INSULATION SAFETY PRODUCTS SOLUTIONS SHIPS AGENCY SHIP MANAGEMENT Strategic direction Reinforce fundamental business model Organic growth combined with acquisitions Operational strategy Ensure quality and consistency Improve efficiency through better utilization of global network Develop new customer interfaces on digital platforms 12

13 WMS portfolio strategy ENGINEERED INSULATION SAFETY PRODUCTS SOLUTIONS SHIPS AGENCY SHIP MANAGEMENT Strategic direction Organic growth through sales and customer partnerships Acquisitions of industry related companies Operational strategy Invest in training and competence building of seafarers Develop new services and evaluate new segments 13


14 Wilhelmsen Ships Service - Standardised products and services - Exceptional supply 14

15 Wilhelmsen Ships Service and the Asia Pacific Region Neal De Roche Regional VP Asia Pacific WSS WWH Capital Markets Day 17 September 2015


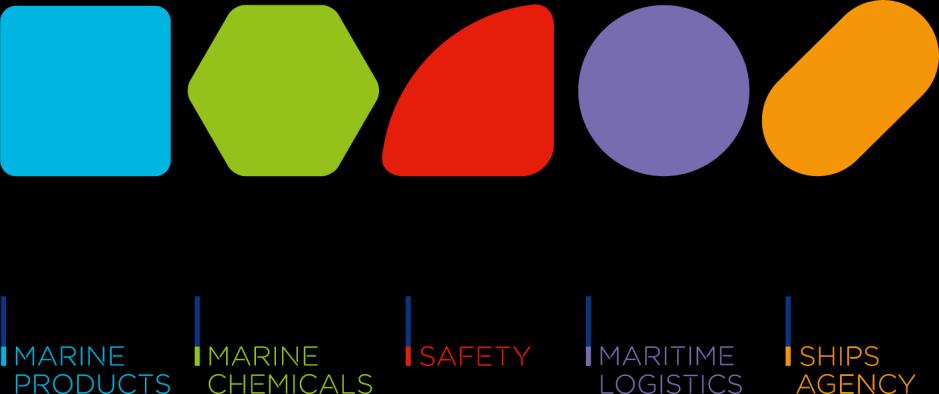
16 Offering you the industry s most comprehensive portfolio

17 Emerging region hosting most of the major ports in the world
 Singapore ~3 700 25 698 China ~4 500 8 090 Oceania ~8 000 3 590 Korea ~2 500 6 764 Japan ~2 900 5 160 Others ~7 400 8 074 Total ~29 000 57 376")
18 WSS Asia Pacific - regional capabilities 68 operational offices ~ 900 major ports covered ~ employees ~ 200 sales professionals ~ port calls p.a. ~ vessels receiving product deliveries Countries PORT CALLS p.a. # PORT DELIVERY (2014) Singapore ~ China ~ Oceania ~ Korea ~ Japan ~ Others ~ Total ~
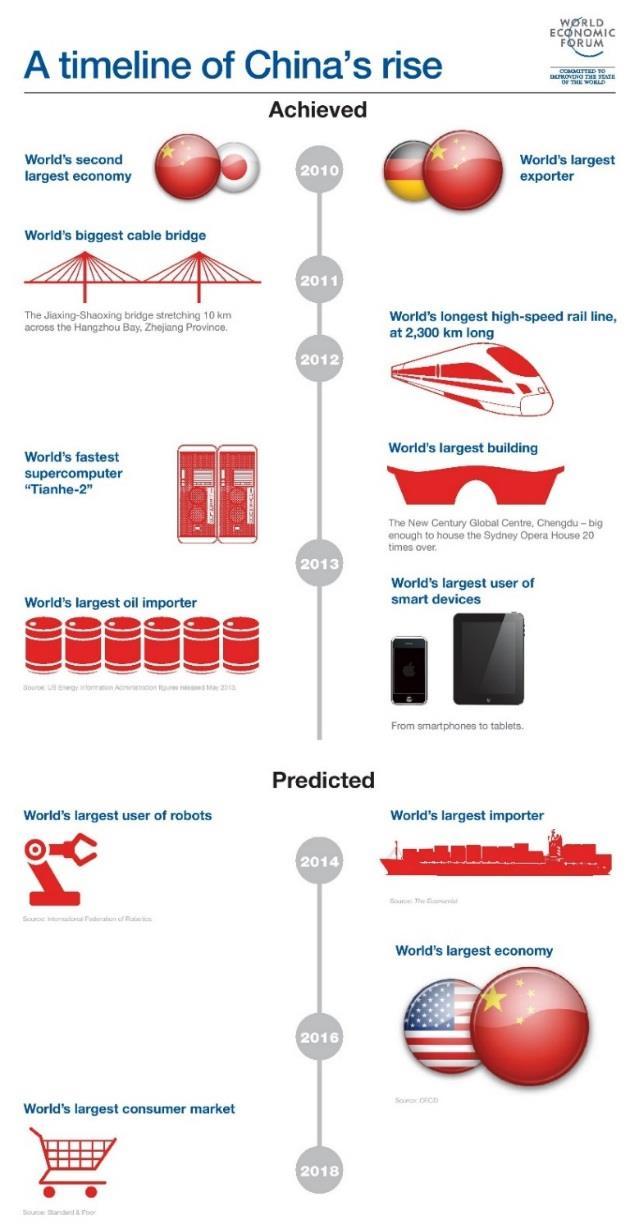
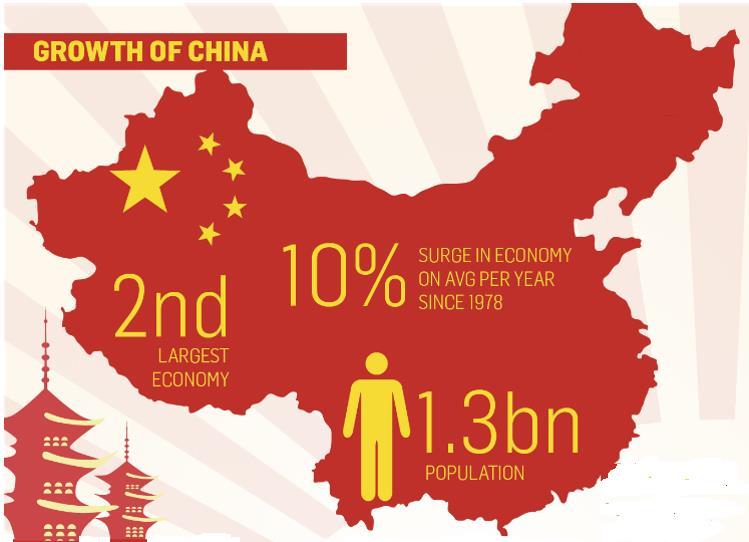
19 The importance of China?

20 Strong presence in China dating back to port offices covering 73 ports 7 bonded operations sites 3 service stations 160 staff Strongest international ships agent Number 6000 Port call development FC Slow steady progress = solid structure

21 Intra-regional dependencies China s need for energy within Asia Australia China commodity trade We are viewed as strategic partners Strong agency competence & network Using export ports as entry to Chinese markets Part of Wilhelmsen Maritime Services a Wilh. Wilhelmsen group company

22 PORT HEDLAND Port Hedland Trader, charter and owners representation Terminal planning & co-ordination Cargo planning & loading Husbandry co-ordination 24 / 7 service

23 CARGO HOLD CLEANING Quicker turnaround Environmentally & crew friendly Significant cost improvements Same products worldwide Game changer for certain commodity trades

24 PORT GLADSTONE Increase in Australian LNG exports to Asia WSS expertise and specialised knowledge Long term contracts Network dependent Future solution sales

25 Governance and transparency The right results the right way!
26 Thank you!