Software Process and Management
|
|
|
- Caren Cole
- 5 years ago
- Views:
Transcription

1 Software Process and Management Gu Qing Nanjing University
2 Chapter 4. Project Scheduling Work Breakdown Structure Considering Dependencies Scheduling the Work Staff Planning Critical Chain Method 2
3 1. Work Breakdown Structure A hierarchical list of the activities required to complete a project, include: Doing the software development Managing the project Providing support for all of the project works Other activities such as the creation of documents, training, tools acquisition 3
4 The Importance of WBS The heart of a project plan, document all the work being done to develop and deliver the software product Consolidate work information from many sources into one place with an organized format for planning, estimating and tracking Move from the top-level activity of the project down through a set of simpler and smaller activities into manageable size Done by one unit of resource (1 person, section, group, or department) in a relatively short period of time (1 day, week, fortnight, or month) Provide a basis for monitoring the project and for historical data collection Allows completed 97 of 232 planned activities instead of got 90% done 4
5 The Position of WBS Why WBS Justification ROI What Charter SOW How SPMP Life Cycle Model Do it Life Cycle Execution PPA Did it 5
6 Description of WBS Tree view Useful for high-level breakdowns of the work Indented list Useful in detailed representation 6
7 WBS as a Tree 7
8 WBS as an Indented List 1.0 Software for C Compiler 1.1 Build a C Compiler Build a User Interface Build a File System Build a Parser Build a Code Generator Build a Run-Time System 1.2 Build the Test Suite for the Compiler Write Documentation 1.4 Write Installation Software 1.5 Manage Software Development 1.1 Build a C Compiler Build a User Interface Analyze Requirements for UI Design the UI Code the UI Test and Integrate the UI Build a File System Analyze Requirements for FS
9 Possible WBS Arrangements System Software Products Components Process Steps System Software Organizations Products Process Steps System Software Process Steps Products Components System Software Products Organizations Process Steps 9
10 Arrange the WBS The C Compiler example The deliverable (product) The major components The life cycle (process) activities 10
11 Use of WBS Cost estimating Make sure all activities get estimated Make sure each element of the estimate corresponds to a necessary activity Roll up costs of individual elements into total costs for subsystems and up to the whole system Cost accounting Assign work and charge it to appropriate cost centers Determine the actual cost of each work element Schedule performance Monitor which activities are complete Measure project progress 11
12 Views of WBS Product view Depict hierarchical relationships among product elements (routines, modules, subsystems) Project view Depict hierarchical relationships among work activities (process elements), divided along organizational lines Both need to be considered in sizing and estimating the software product 12
13 Illustration of WBS Uses Work Breakdown Structure Cost Account Organization Breakdown Structure Schedule 13
14 Build a WBS Top-down approach Similar project has been done before The project team understands the works well Bottom-up approach Fit for a new type of project Brainstorm everything that could be done and group the activities upward 14
15 Illustrate the Building Project Top-Down Stage Stage Stage Milestone Milestone Milestone Milestone Milestone Task Task Task Task Task Task Task Task Task Task Task Task Task Task Task Task Task Task Task Task Task Task Task Task Task Task Task Task Task Task Bottom-Up 15
16 The Process of Building WBS Identify the work concerning the software product Find any higher system WBS Separate the software from other systems and software components Determine the software WBS architecture Populate the software WBS architecture Identify all the parts and activities Determine cost categories for software 16
17 Identify the Work Document Paragraph Description SOW Design Software for Compiler SOW Travel for Design Review Contract a Follow ISO Standard 5432f Requirements 3.4 Use Data Compression Customer 6/5/99 Mtg. Code All Software in C++ 17
18 Higher System WBS 18
19 Software WBS Architecture 19
20 Populate the WBS Doc Para Description WBS Item SOW Develop C Compiler 1.0 Software for C Compiler Spec. 2.0 Develop Compiler 1.1 Build a C Compiler Spec. 2.1 User Interface for PC Build a User Interface Proc Std 3.4 Requirements Analysis RA for User Interface Proc Std 3.5 Design Design for UI Spec 2.2 File System Build a File System Spec 3.0 Test Company Stds 1.2 Build the Test Suite SOW Provide User Guide 1.3 Write Documentation 20
21 Determine Cost Categories Doc Para Description WBS # Category SOW Design Software for Compiler Human Weeks SOW Travel for Design Reviews Actual $ Cost 21
22 Define Work Packages Description of the work product expected software element The staffing requirements who or how many people Names of responsible individuals judge if the work is completed The scheduled start and end dates The budget (dollars, hours, or %) assigned The acceptance criteria for the work defect level etc. 22
23 Useful Approach for Creating WBS Gather project team Provide team members with pad of sticky-notes Team members write down all tasks they can think of Sticky-notes placed & arranged on wall Work package is lowest level (80 hour rule) Cost accounts normally one level above work packages 23
24 WBS Guidelines No more than 100~200 work elements, if more, use subprojects Can be up to 3~4 Levels deep No more than 5~9 jobs at one level Jobs should be of similar size/complexity Manageable chunks, make sense of progress 24
25 2. Considering Dependencies What is a dependency Any relationship connection between project activities that may affect their scheduling Dependency is not all-or-nothing Many scheduling tools assume either no dependency or completely linear dependency The reality is usually somewhere in between Activity A Activity B Activity B depends on A 25
26 Assumptions for Project Activity Project consists of a collection of welldefined activities (tasks or jobs) Project ends when all activities completed Activities are started and stopped independently of each other Activities are ordered, i.e. technological or managerial sequence by dependencies 26
27 Type of Development Dependency External vs. Internal dependency Resource vs. Activity dependency 27
28 External vs. Internal Dependency (1) External dependencies Other or higher-level projects, e.g. a software activity depends on its hardware project counterpart Stakeholders (customer), e.g. a kind of working version (of parts) must be ready at some date Supplier (subcontractor), e.g. an interface to a thirdparty system that the software must communicate May be represented as milestones 28
29 External vs. Internal Dependency (2) Internal dependencies Relationships between components in the productoriented WBS Integral process dependencies Project plan sign-offs and approvals Requirements sign-offs and approvals Internal or external management review cycles Configuration item identification Software quality audits The integral process dependencies may be represented as milestones 29
30 Resource vs. Activity dependency Activity dependencies Activity-driven schedules derived using critical path method Resource dependencies Map the availability of resources into the schedule Apply resource-leveling to stretch out project dates to accommodate resources Possible resources include: engineers, facilities, equipments, favorable time frame for access 30
31 Possible Dependency Relationships Start-finish relationships Finish-to-Start (FS) Start-to-Start (SS) Finish-to-Finish (FF) Start-to-Finish (SF) Special type relationships Lag and Lead Hard vs. Soft 31
32 Finish-to-Start (FS) One activity starts only when the preceding activity finishes For example Find cause FS Fix problem Build tests FS Execute tests Install software FS execute software Activity A FS Activity B B cannot start until A is finished 32
33 Start-to-Start (SS) One activity can start only if another activity starts For example Start project SS {Perform project planning, Perform risk assessment, Perform CM} SS Activity A Activity B B starts when A starts 33
34 Finish-to-Finish (FF) One activity cannot end until another activity ends For example Obtain project completion approval FF Manage the project Activity A FF Activity B B cannot be finished until A is finished 34
35 Start-to-Finish (SF) One activity cannot finish until the next activity (usually milestone) starts For example Contract ends SF Support customer SF Activity A Activity B B cannot be finished until A is started 35
36 Lag and Lead Add time constraint upon basic dependency types Lag add a positive number to the start or finish times of the connected activity Lead add a negative number to the start or finish times For example Apply first coat of paint FS (+2) Apply second coat of paint Activity A FS Activity B SS +8 Activity C 36
37 Hard vs. Soft Relate to the strength of the dependency connection Hard logic or Mandatory dependencies Write code FSH Code compiled Draft design specification FSH review design specification Soft logic or discretionary dependencies Complete requirements document FSS draft design specification Can use lag & lead to describe it 37
38 Brainstorming Activities and Dependencies Brainstorming with the project team to invent activities and find dependencies Normal process Brainstorm an activity list, use the nominal group technique Find affinity collections, logically group activities that will be performed together Find higher WBS levels for the logical collections Complete WBS representation Find dependencies, work from the end (final product) to the beginning, use markers to help 38
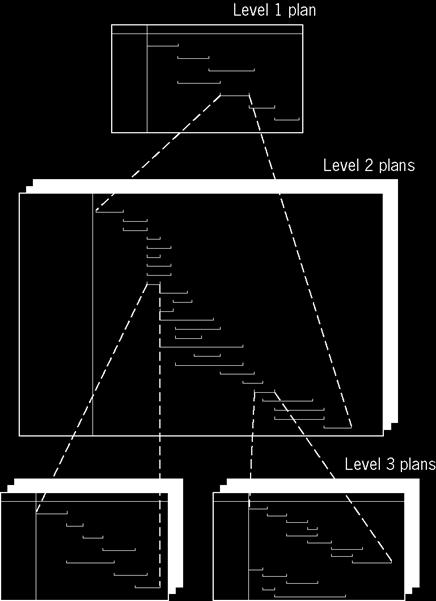
39 The Nominal Group Technique Appeared in 1968, allow for every team member to rank items without being pressured by others The Process Each participant privately generates a list of inputs (project activities) Round robin, each participant provides one new item for the common list in each turn After the list is complete, the group discusses the items as needed to eliminate duplicates Each participant privately ranks the n most important items Using anonymous votes, the leader (coordinator) calculates a team ranking for each item The group discusses the resulted ranking, determining anomalies Repeat the ranking steps to reach a consensus top set, normally take 2~3 rounds 39
40 An Example Activity FS Activity SS FF Start FS Activity FS Activity FS Activity FS End SS Activity FS Activity FS Activity? Dangling 40
41 3. Scheduling the Work Common forms of a project schedule Table Gantt Chart Network Diagram Scheduling methods CPM (Critical path method) PERT DSM (Design Structure Matrix) Apply contingency to handle uncertainties 41
42 Table Form Non-graphical form suitable for long list of project activities Activity Name WBS Duration Start Finish Requirements days Activity Activity Design days Activity Activity Coding and Unit Test days Activity Activity Activity Integration and Test days Activity Activity
43 Gantt Chart A bar chart invented by Henry L. Gantt during World War I Plan big shipbuilding projects (cargo ships) Graphical way of showing task durations, project schedule With activities listed down the left side, and time bars shown to the right The activity list can be sorted by start date, finish date, or WBS code level Does not explicitly show relationships between tasks Extended Gantt chart also has milestones, dependencies between activity bars, etc. Easy to understand, but limited use for project tracking 43

44 An Example Gantt Chart 44

45 A Tracking Gantt Chart 45

46 Hierarchy of Gantt Charts 46
47 Network Diagram A graphical representation showing an ordered list of symbols that indicate activities The symbols may include Activity name or ID (WBS code) Estimated duration Earliest start and finish time Latest start and finish time Responsibility 47
48 AON and AOA AON Activity on Node Earliest start Duration Earliest finish Activity ID Latest start Latest finish AOA Activity on Arrow Seldom used now Activity ID (Earliest start, finish) Duration (Latest start, finish) 48
49 An AON Network A C D Start F End B E
50 An AOA Network 50
51 Different Network Diagrams By duration estimates and precedence logic CPM Critical path method Both duration estimates and precedence logic are fixed PERT Program Evaluation and Review Technique Allow probabilistic treatment of duration estimates GERT Graphical Evaluation and Review Technique Allow conditional & probabilistic treatment of both precedence and duration estimates, too complex to use 51
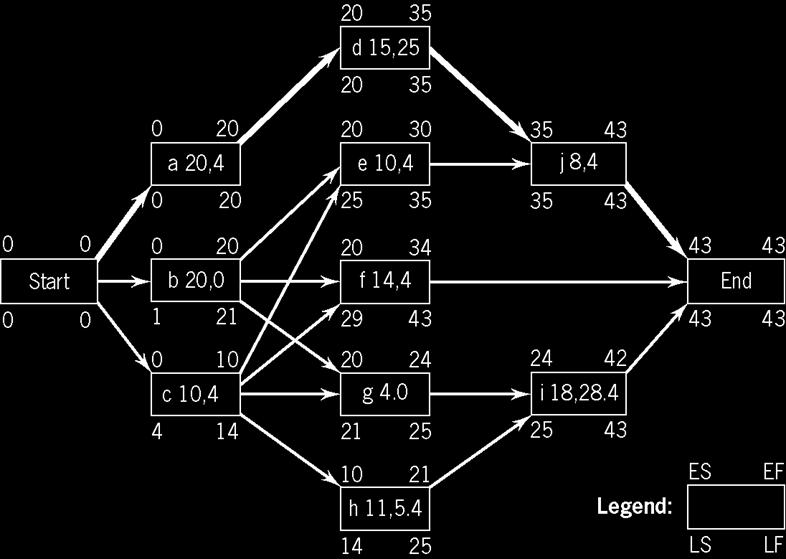
52 CPM A 2-pass analysis to compute critical path Forward pass Begin at the start node, compute the earliest start and finish time of each node (use add) For the end node, the finish time is the total length of the longest path through the network Backward pass Begin at the end node, compute the latest finish and start time of each node (use subtract) For the end node, the earliest and latest finish time is the same Critical path Float (slack) the difference between the earliest and latest start/finish time The path indicated by nodes with 0 float 52
53 Example St. Adolf s Hospital Activity Description Immediate Predecessor A Select administrative and medical staff B Select site and do site survey C Select equipment A D Prepare final construction plans and layout B E Bring utilities to the site B F Interview applicants and fill positions in nursing, support staff, maintenance, and security A G Purchase and take delivery of equipment C H Construct the hospital D I Develop an information system A J Install the equipment E, G, H K Train nurses and support staff F, I, J 53
54 Example Network Diagrams I 15 A 12 F 10 K 6 Start C 10 G 35 Finish B 9 D 10 H 40 J 4 E 24 54
55 Example Apply CPM I 15 A 12 F 10 K 6 Start C 10 G 35 Finish B D H J E 24 55
56 Example Critical Path Earliest start time Latest start time I Earliest finish time Latest finish time A 12 F K 6 Start Critical path C 10 G Finish B 9 D H 40 J E
57 Task Time Detail Activity i Free Slack (FS) Amount an activity can be delayed without delaying the Early Start (ES) of any others 57
58 PERT Developed for US Navy project for missile submarine in 1958 by Booz, Allen and Hamilton Use 3-points estimates based on β-probability distribution 58


59 Activity Duration Estimates 59
60 Expected Time and Variance Mean expected Time (TE) Time Variance (TV) TE = TV A + 4M + B B A = σ = 6 Early Finish (EF) and Late Finish (LF) computed as CPM with TE Assume project (path) times are Gaussian (Normal) distributed Probability that activity finished at (before) TE is 50% 60
: Last Finish LF(i): Variance of Slack i: i 1 2 2 ES i = σt j = 0 i")
![2 2 2 2 EF i = ES i + t = t n j = 0 2 2 [ LF ( i )] = σtj j=+ i 1 σ [ ( )] j σ](/docs-images/87/96378347/images/61-3.jpg "[ ( )] σ [ ( )] σ σ i j σ 2 2 2 σ [ SL( i )] = σ [ EF ( i )] + σ [ LF ( i )] 61")
61 Probabilistic Slack Variance of times for activity i: Early Start ES(i): Early Finish EF(i): Last Finish LF(i): Variance of Slack i: i ES i = σt j = 0 i EF i = ES i + t = t n j = [ LF ( i )] = σtj j=+ i 1 σ [ ( )] j σ [ ( )] σ [ ( )] σ σ i j σ σ [ SL( i )] = σ [ EF ( i )] + σ [ LF ( i )] 61
62 Probability of Meeting Target Negative slack (SL(i)<0) means target date is not met Convert slack to a normalized random variable z: EF LF SL T E ( F ) z = = = 2 2 σ ( EF ) + σ ( LF ) σ ( SL) σ ( F ) For task n: An example: [ ( )] = ( ), σ ( ) = σ ( ) = σ ( ) E EF n E F SL EF F A project needs be finished at May 2 nd, expected early finish is May 12 th with standard deviation σ=20 Then z = (5/2 5/12)/20 = 8/20 = 0.4 Means 35% to meet the target 62


63 Example Network Diagrams 63
64 Example Duration Estimates Activity Duration Optimistic Most Likely Pessimistic Immediate Predecessors a b c d a e b,c f b,c g b,c h c i g,h j d,e 64
65 Example Apply PERT Activity Expected Time, M Standard Deviation, σ Variance, σ 2 a b c d e f g h i j

66 Example AON with Durations & Variances 66

67 Example Apply CPM 67
68 Example Key Information Critical path is a d j Length of the critical path: 43 Variances of the critical path: =33 Probability of completing the project in 43 days: 50% Now we planned 50 days for the project z = =

69 Example Probability Distribution 69
70 Example Adjust the Timeline 89% is not enough, 95% is preferred ( D 43) z = = 33 D = = The project needs 52.5 days for 95% confidence 70
71 Assign the Resources 4 major components of a scheduled activity Work effort Design the GUI: 48 person-days Units required Mike, Tom, Charlie will do it Duration 48/3 = 16 Workdays Calendar dates 3 weeks and 1 day to do the work Will the resource units be always available? CPM handles the duration and dates, but neglects the units constraints 71


72 Problems with CPM / PERT CPM prohibits iterations, but iterations are essential features of software projects 72
73 2 Types of Iteration Planned Iteration Caused by needs to get it right the first time Know where the iterations occur, but not necessarily how much Should be facilitated by good design methods, tools, and coordination Unplanned Iteration Caused by input changes, update of assumptions, and discovery of errors Generally cannot predict which unplanned iterations will occur Should be minimized using risk management methods 73
74 Activity Sequencing in Projects For 2 activities, 3 possible sequences 74


75 DSM Design Structure Matrix A 2-dimensional matrix representing structural or functional interrelationships of objects, tasks or teams Task D requires info from tasks E, F, and L Task B transfers info to tasks C, F, G, J, and K 75

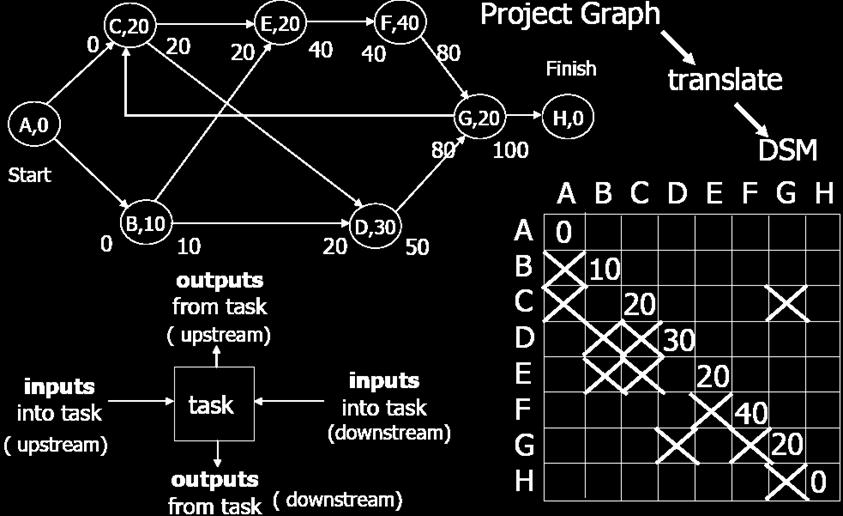
76 DSM for a Project 76
77 Analyze DSM Note: Coupled tasks can be identified as a whole 77
78 Tearing Marks in the DSM 78


79 Linking DSM to Schedule 79

80 Semiconductor Development Example 80

81 A GERT Example 81
82 4. Staff Planning Part of SPMP Include 3 functions Identify the project roles and skills needed Assign responsibilities to individuals Establish reporting relationships 82
83 Identify the Project Roles and Skills Types of roles Database designers CM experts Human interface designers Webmasters QA specialists Network specialists System architects Language experts Build masters Test engineers Gopher or catalysts (promote team harmony) Characteristics of Roles Responsibility the obligation to perform Authority the right to perform Accountability performed value for measurement 83
84 Typical Problems for Role Assignment Assign responsibility to people who have no authority to get the work done The accomplishments of the work are hard to measure Do not neglect reliability refer to moral qualities, judgment, and habit 84
85 The Test Engineer An Example Responsibility Collaborate with architects and designers Design the test case, generate test data Run build and regression test suites, report results Authority Participate in design and inspection meetings Exercise final authority for all test-related activities Authorize component builds and quality metrics Accountability Number of design and inspection meetings attended Quantity & quality of tests prepared and executed Percentage of successful component builds Accuracy and timeliness of reported test results 85
86 Assign Responsibilities to Individuals Comprehend roll-on and roll-off Roll-on time required to be ready for the work Roll-off time required to hand over the work and artifacts Make staff assignment strategy The allocation of people is beyond a single project, but for increasing the skills and experiences of the team Fit a person to a role It is better to hire people based on their traits than on their skills, since skill training is much easier than personality change Develop the project staffing management plan Use a staffing plan histogram 86
87 Responsibility Assignment Matrix (1) Responsibility Assignment Matrix Who What Responsibility 87
88 Responsibility Assignment Matrix (2) Also called staffing matrix or responsibility chart Typical role assignment (LSCAR) Lead total responsibility for producing the item Secondary backup for the Lead Contributor materially contribute to the item Approval approve the item as complete Reviewer review the item A RAM example fig
89 Staffing Plan Histogram Staff-Hours 89
90 Resource Leveling 90
91 Leveling Resource Assignments Reschedule the activities to achieve a more balanced distribution of resources Activity shifting Slide the start / end dates (of an uncritical activity) forward or backward Activity splitting Break an activity into 2 or more pieces Activity stretching Make the activity duration longer for less resources Resource substitution Get a more efficient and higher performance resource Allocating overtime Accept and pay for the overload, suffer lower efficiency Resource depletion Add more resources, suffer more communication expense 91


92 Resource Leveling Example 1 resource AOA network 92
93 An Example Resources Group A Group B The AOA Network EOT=20 2 d,15 [0,2] EOT=35 6 a,20 [4,0] EOT=20 1 b,20 [2,1] 3 e,10 [2,1] f,14 [1,1] j,8 [0,6] 7 EOT=43 EOT=0 c,10 [3,1] g,4 [1,0] i,18 [6,3] 4 EOT=10 h,11 [0,2] 5 EOT=24 a,20 [4,0] Duration of a is 20 days, Need effort of Group A 20 4=80 PD, Group B 0 PD 93
94 Pre-Gantt Chart 94
")
95 Load Diagrams (Histogram) 95

96 Shift Activity With 1 day delay in e & f 96
97 5. Critical Chain Method Developed by Eliyahu Goldratt, 1997 Focus on the scarce resources e.g. Key technical individuals or sub-groups, called Herbies Critical chain Chain of activities where herbies are involved Usually the longest chain of dependent tasks or resources Optimize the usage of herbies, wrap the other activities and buffers around their availability Aggregate safety time into project and feeder buffers Monitor the buffers to know when to control 97
98 An Illustration 1A 1B 1C Buffer 1 1D 1E Project Buffer 2A Buffer 2 2B Critical Chain Early Finish Date 3A Buffer 2 3B Project Due Date Time Line Use 50/50 (median) task duration estimates Insert feeder and project buffers as safety Ideal buffers are 50% of path duration 98
99 Uncertainties Scheduling the future will suffer a lot of uncertainties A scheduling related statement The project can be completed as described (scope) with 19,500 hours of effort by 15 full-timeequivalents (cost) by Nov. 15th (schedule) with an 85% probability We should apply the contingency buffer to the schedule 99

100 Paper Airplane Folding Times 100
101 Apply Contingency (Safety) Buffer 2 possible ways Apply the buffer to each activity Apply the buffer to the project (major phases) as a whole 50%+ 90%+ 99%+ 3 weeks Estimate of the focused work in the activity 6 weeks Allow for uncertainties 2 weeks 2 weeks 2 weeks 2 weeks Allow for multitasking interruptions 10 weeks Apply contingency buffer to the activity 101
102 The Problem Student syndrome Start the bulk of the activity work at about the 2/3 point in the available time Since they have nearer-term deadlines to worry about, and leave more nearer-term deadlines Possible way to handle it Schedule the work based on aggressive estimates, aggregate the contingency buffers into a whole to the project (or major phases) 102
103 The Project-level Contingency Buffer Requirements Jan Apr Jul Oct Jan Apr Jul Oct Jan Apr Jul Oct Activity 1 Activity 2 Design Activity 3 Activity 4 Coding and Unit test Activity 5 Activity 6 Activity 7 Earliest possible finish date Project due date for customer Integration and Test Activity 8 Activity 9 Aggressive Schedule Contingency Buffer 103

104 The Stage-level Contingency 104
105 Critical Chain Scheduling (1) Create a sequential/parallel project network Remove safety time to shorten task durations 105
106 Critical Chain Scheduling (2) De-conflict resources Identify the critical chain The set of activities for which there is no slack after resource de-confliction A9 B5 C6 E10 De-conflict B D8 B8 30 days schedule A9 B5 C6 32 days schedule E10 Critical Chain D8 B8 106
107 Critical Chain Scheduling (3) Create 50% project buffer and feeder buffers 107
108 Summary of Schedule Building Develop the WBS What activities done by who, what materials required, how much the cost Identify activity dependencies Serial or parallel Develop a network diagram from the WBS and dependency Do the CPM analysis computation Find and analyze critical path activities Perform resource allocation and leveling Convert the network to Gantt chart Develop the cost baseline and spending curves 108
109 Summary Work Breakdown Structure Importance of WBS, WBS Description Application of WBS, Building WBS Considering Dependencies External vs. Internal, Resource vs. Activity dependencies FS, SS, FF, SF, Lag and lead, Hard and soft relationships Scheduling the Work Forms of a project schedule: Table, Gantt chart, Network diagram Scheduling methods: CPM, PERT, DSM 109
110 Summary Staff Planning Identify Project Roles, Responsibility Assignment Matrix Staffing Plan Histogram, Resource Leveling Critical Chain Method Contingency (Safety) Buffer, Student syndrome Critical Chain Scheduling 110