Administrative Review
|
|
|
- Leon Norris
- 5 years ago
- Views:
Transcription
1 UNIVERSITY OF AINE SYSTE Administrative Review : Findings and Recommendations Report to Chancellor Page and the Board of Trustees, arch, 2013

2 The goal of this Administrative Review for Strategic Procurement is to improve procurement efficiency and services and to identify procurement-related cost savings so they may be invested in teaching, research and public service. Page 2
3 Table of Contents I. Executive Summary II. Summary of Recommendations III. Findings and Recommendations 1. Procurement of Specific Goods and Services A. Travel and Expense anagement B. Strategic Sourcing of Other Commodities and Services 2. Procurement Card (Pcard) Administration 3. Structural Resources and Efficiencies (Procurement Organizational Structure) IV. Financial Impact V. Implementation Plan VI. Appendices 1. Administrative Review Team and Working Groups 2. Resource aterial 3. Emerging Recommendation Survey Results Page 3
4 I. Executive Summary Background and Charter This report represents the culmination of approximately eight months of research, review, brainstorming, consideration and outreach by the Administrative Review Team for Strategic Procurement (appendix 1). The team was and is comprised of individuals from large and small universities within the system, from the system office and from the Board of Trustees. The team was charged with reviewing pursuant to a formal January 2012 directive of the Board of Trustees. That directive challenged the System to examine administrative costs and structures at all levels and to bring forward recommendations to improve administrative efficiencies and services so that savings might be reallocated from administration and infrastructure to be invested in the mission of the University System. Outreach Activity This work included outreach and communication across the University of aine System. Throughout the process, the team has provided updates and received guidance from the Presidents Council, the Shared Services Advisory Council, the Administrative Review Steering Committee and the Finance and Facilities Committee of the Board of Trustees. The team offered presentations and on-site feedback sessions at all campuses, conducted an online feedback survey, provided a mechanism for general feedback opportunities, and adopted other mechanisms to share ideas and solicit input. Hundreds of people were engaged in the dialogue. The team extends its thanks to everyone who participated. While uniformity of opinion would not be expected in such a broad and vibrant community, all participation was very much appreciated and valued by the team. Feedback from beyond the immediate team resulted in substantive changes in the project and in the content of this report. Recommendations Procurement today is a generally fragmented activity under a uniform set of laws and policies but with varying interpretations, practices and specific procurements across the University System. Approximately 45 positions (nearly 35 FTEs) have been identified as working in this functional area across the system which has an estimated addressable spend on goods and services of approximately $100 million. The current status, while rife with dedicated, diligent individuals, presents substantial challenges to leveraging the University s buying power, developing expertise within the existing structure and providing timely, consistent support to those trying to navigate the process to procure the goods and services needed to carry out the University s mission. This report advances 20 specific recommendations to streamline, better coordinate and improve service while reducing costs in three major initiative areas: 1. The Procurement of Specific Goods and Services; 2. Procurement Card Administration; and, 3. Structural Resources and Efficiencies. Ultimately these recommendations are intended to translate into savings pursuant the original directive of the Board of Trustees. As illustrated in Chart 1, the total savings across all funds and all years through Page 4
5 FY16 is estimated to be generated primarily from the category of recommendations focused on the procurement of specific goods and services, including travel and the management of travel-related expenses. This category is about trying to spend less to obtain the goods and services needed by those carrying out the mission of the University System, while maintaining or improving quality and service levels. Source of Estimated Accumulative Savings through FY 2016 (E&G only) 41% Procurement of Specific Good and Services including Trave & Expense Pcard Administation Changes 57% Structural Changes 2% Chart 1 Though they represent a relatively smaller portion of the direct savings, the structural changes identified in this report are critical to carrying out the broader array of recommendations. They represent unification of critical procurement functions, but with personnel located in key strategic locations throughout the enterprise. The recommendations do contemplate an overall reduction of about 10 percent in cost of the structure and positions dedicated to procurement activities compared with current levels. The particulars of those structural changes are a sensitive and serious matter that will need to be a top priority during any implementation phase. Three new functional areas will comprise the new procurement structure: 1. Procurement Operations (including Accounts Payable); 2. Procurement Services (including training and support); and 3. Strategic Sourcing. While the positions within those centers of excellence will be aligned in their functional purposes and will have a clear, streamlined reporting and accountability structure, the team expects geographical location will be determined by function and other factors. In no case is it expected that a single physical location would best serve all the functions of this new structure or its customers. Some functions may require a critical mass of positions to be co-located at one or more sites yet to be determined. The existing AP shared services physically located at the University of aine forms a strong nucleus for one of the proposed centers of excellence, for example. Other functions will be best located as close as possible to the customers being served. Page 5
6 The team recognizes and suggests these structural recommendations and all the recommendations in this report will need to proceed with abundant communication, as transparently as is practicable and in close collaboration with the Chancellor, Presidents and many additional stakeholders and constituencies impacted by, involved with or interested in these recommendations. Defining and easuring Success Success will lead to a single, system-wide procurement function that acts strategically to support and not hinder the mission of the University System which: - operates more efficiently and with less paper than is required today; - reduces redundancy and inconsistency in procedures and practices; - improves training, communication and user support; - costs less to operate; and, - obtains the goods and services needed by the University for less total cost than they are today. The project follows the four phase management approach of: I. Analyze and Evaluate; II. Design & Develop; III. Implement; and IV. easure & Audit, and repeat. As part of phase four easure & Audit activities, the team is recommending metrics be developed in three areas: 1. cost savings; 2. non-fiscal performance; and, 3. customer service. onitoring such metrics, communicating about them and adjusting implementation necessary are key factors for the success of these recommendations. Savings If implemented, this report estimates all of these recommendations would achieve a total accumulative savings and avoided costs of more than $5.3 million through Fiscal Year 16 across all funds when compared with continuing with current practices and structures. The portion of that amount estimated to occur in Education and General (E&G) funds accumulates to $2.9 million. On a budgeted basis, after estimated necessary investments, the net savings for E&G is estimated to be more than $1.6 million through FY16, including approximately $160,000 in FY14, $832,000 in FY15 and $661,000 in FY16 as shown in the preceding graph and its accompanying table (Chart 2). Page 6
7 $3,500,000 FY 2013-FY2016 Estimated Net Savings (after Investment) Unrestricted Funds (E&G Only) $3,000,000 Net Savings - New Net Savings- Cumulative $2,500,000 $2,000,000 $1,500,000 $1,000,000 $500,000 $- FY2013 FY2014 FY2015 FY2016 Total FY 2013-FY2016 Estimated Net E&G Savings (after investment) FY2013 FY2014 FY2015 FY2016 Total Net Savings - New $ 26,086 $ 160,660 $ 832,421 $ 661,010 $ 1,680,176 Net Savings- Cumulative $ 26,086 $ 186,746 $ 1,019,167 $ 1,680,176 $ 2,912,174 Chart 2 Result of University System-Wide Survey During February 1-13, 2013, the University community was invited to participate in an on-line survey to review the 20 emerging recommendations, indicate their level of support, and offer comments, concerns and suggestions. In all, 243 individuals responded to the survey with strong participation from U and US. As detailed in appendix 3, a majority of the respondents either support or strongly support all of the recommendations put forward. Concerns and suggestions focused on the need for flexibility, on-going communication, ease of use, and adequate training and support; concepts which are guiding principles for this initiative. Page 7
8 II. Summary of Recommendations 1. Procurement of Specific Goods and Services a. Travel and Expense anagement A. CONDUCT A COPREHENSIVE ASSESSENT to document the travel service requirements for all traveler groups and locations. B. SECURE TRAVEL ANAGEENT COPANY(S) and ELECTRONIC TRAVEL REIBURSEENT SYSTE through a competitive public process to provide unified on-line and agent assisted travel services that are integrated with a paperless travel reimbursement system. C. CONTRACT WITH PREFERRED PROVIDERS for favorable pricing and service guarantees for transportation, airfare, and lodging to the extent practicable in the context of the specific needs of University travelers. D. UPDATE TRAVEL AND EXPENSE ADINISTRATIVE PRACTICE LETTER (APL) with clear guidelines for areas such as tipping, per diem rates in high cost destinations, and exceptions for unique travel needs. E. ESTABLISH UNIFIED TRAVEL ADINISTRATION as part of a comprehensive University systemwide procurement strategy to provide consistent policies and services for all locations with a dedicated support structure. Staff would be located at both campus and system offices with emphasis on ensuring effective campus-based presence. 1. Procurement of Specific Goods and Services b. Other Commodities and Services (Strategic Sourcing) A. ESTABLISH ULTI-CAPUS ADVISORY GROUPS with expertise in products and services being considered for competitive public bid. B. DEVELOP SPEND ANALYTICS ETHODOLOGY/TOOLS to better identify products and services where the University system would save money and add value from a competitive public bid process. C. IPLEENT CONTRACT ANAGEENT PROCESS to better manage suppliers, ensure consistent contract terms across the University system, eliminate redundant agreements, and identify opportunities for competitive public bids / re-bids. D. CONDUCT COPETITIVE PUBLIC BIDS for key products and services such as electricity, IT hardware (in coordination with IT administrative review), promotional materials, custodial paper goods, scientific equipment, commercial print, temporary employment, books/periodicals, vehicle services and parts, and prospect lists. E. EXPAND THE BREADTH OF PRODUCTS AVAILABLE WITH FAVORABLE PRICING AND CONTRACT TERS by increasing ainestreet arketplace (S) catalog suppliers and migrating procurement activity from procurement card (Pcard) to S as appropriate. Page 8
9 2. Procurement Card (Pcard) Administration A. DELIVER SYSTE-WIDE PCARD SERVICE, SUPPORT AND TRAINING for all locations as part a comprehensive support strategy for all procurement platforms (i.e., Pcard, ainestreet arketplace (S), Travel & Expense). B. ESTABLISH BENCHARKS AND STANDARDS for Pcard issuance and approvals to be administered consistently across the University system. C. RE-BID PCARD SERVICES following a competitive public process to better meet Pcard user requirements and administration and include travel expense management. D. ESTABLISH UNIFIED PCARD ADINISTRATION as part of a comprehensive University systemwide procurement strategy to provide consistent policies and services for all locations with a dedicated support structure. Staff would be located at both campus and system offices with emphasis on ensuring effective campus-based presence. 3. Structural Resources and Efficiencies (Procurement Organization Structure) Page 9 A. TRANSITION TO A UNIFIED STRATEGIC PROCUREENT ORGANIZATION operating as a shared system-wide service reporting to the Chancellor or the Chancellor s designee and advised by the Shared Services Advisory Council and the President s Council. The organization would consist of three functional units: Procurement Operations, Procurement Services, and Strategic Sourcing with staff located at both campus and system offices with emphasis on ensuring effective campus-based presence. B. CREATE A PROCUREENT OPERATIONS UNIT within the unified strategic procurement organization responsible for accounts payable, travel and Pcard administration, procurement systems administration, and management of procurement related data. C. CREATE A PROCUREENT SERVICES UNIT within the unified strategic procurement organization to provide consistent, system-wide training and support, coordinate procurement activity for individual campuses, oversee quality assurance and compliance, and conduct special projects as required by legislative and regulatory mandates. D. CREATE A STRATEGIC SOURCING UNIT within the unified strategic procurement organization to facilitate public competitive bids, analyze spend data, develop research and reporting methodologies, establish campus-based advisory groups, monitor supplier performance, and manage contract activity. E. ESTABLISH ASSESSENT PROCESS for each unit defining evaluation criteria and review process for achieving service, efficiency, and expense reduction goals. F. IPROVE ECHANISS FOR EXCEPTION PROCESS AND FEEDBACK that provide flexibility for unique requirements and create a better process for incorporating suggestions from shoppers about goods or services where they believe additional savings could be obtained.
10 III. Findings and Recommendations: 1. Procurement of Specific Goods and Services A. Travel and Expense anagement From the perspective of an individual traveler, the University of aine System operates a paper-based travel reimbursement system. Campuses and the System Office have attempted, through training and on-going process improvements, such as direct electronic direct deposit of traveler reimbursements, to provide a user-friendly process. Financial controls are, necessarily, provided by after-the-fact paper reviews, prior to administrative offices keying the data into the financial system. In August, 2012, the Administrative Review Team formed the Travel and Expense (T&E) Working Group (appendix 1) to conduct an in-depth review of travel policies and practices as part of the overall administrative review process. The working group was formed from participants in a webinar offered by a aine-based travel management company that illustrated how other organizations are supporting and managing travel. Since its inception the group has held 9 (as of 1/30/13) teleconference meetings in addition to the dozens of meetings held by the Review Team itself. During these meetings the Working Group has: - Discussed the current travel-related policies, procedures, and practices across the University of aine System. - Considered what was learned from teleconferences with staff from Temple University and the University of Colorado, that had been identified as having reengineered travel management practices and procedures to improve services to travelers, gain behind-the-scenes efficiencies, and achieve financial savings. - Reviewed information from team members who participated in webinars offered by two different electronic travel management tool vendors. - Identified and reviewed reports describing current travel management practices, with emphasis on those in higher education. - Acquired and read travel management requests for proposals (RFPs) issued by five different institutions of higher education. All reviewed materials are listed in appendix 2 and available for review. 1. Current State a. Spend Analysis There is no consistent method or standard for booking or paying for travel across the University system. Payment data resides on several systems. uch of the spend detail is on paper and not captured electronically on any system. As a result, only a rudimentary spend profile could be developed by analyzing spend data from travel reimbursements. Data captured included the total travel cost, the travelers name and the campus being charged. Detail about specific expenses (i.e., airline tickets, vehicle rentals, lodging costs, or mileage reimbursements) is not easily accessed. While University policy requires that all trip costs be reported, it is likely that some reports only include the amount of reimbursement being requested. For example, if airline tickets were charged directly to a University Page 10


, - travelers spending between $1,000 and $10,000 a year")


11 account or paid with a purchase card (Pcard), there is no way of assuring that the amount of the ticket is in the total reported. Despite these limitations, the data is able to show that at least $9.3 million was spent on travel during FY There were 3,632 occurrences of individual or group travel. Group travel, especially for athletics, means the actual number of travelers is much higher. Further analysis of this data set shows that: - almost half of all travelers spend less than $1,000 a year, accounting for about 7% of the total spend (Chart 3), - travelers spending between $1,000 and $10,000 a year make up over 46% of all travelers and accounts for over 50% of the total spend (Chart 4), - Over 25% of travel spending is charged to 2% of the University community. This includes travel by athletic teams, classes, and other groups (Charts 3 and Chart 4) and - University of aine and University of Southern aine combined account for almost 75% of all travelers and almost 85% of total spend (Chart 5). University of aine Systems: Annual Travel Spend Analysis All Travelers by Spend Category Total # of Travelers = 3,632 43, 1% 20, 1% 65, 2% All Travelers by Spend Category Total Spend = $9,276,488 $602,559, 7% 264, 7% Travelers $20k+ Travelers $20k+ 1815, 50% 1425, 39% Travelers $15-$20k Travelers $10-$15k Travelers $5-$10k Travelers $1-$5k Travelers $0-$1k $3,290,147, 35% $2,471,485, 27% $770,685, 8% $341,923, 4% Travelers $15-$20k Travelers $10-$15k Travelers $5-$10k Travelers $1-$5k Travelers $0-$1k $1,799,689, 19% Chart 3 Chart 4 Annual Expense by Campus Total T&E Reimbursements = $9,276,488 $178,230, 2% $129,855, 1% $258,334, 3% $408,773, 4% $425,725, 5% $2,141,548, 23% $5,677,305, 61% $56,718, 1% U US UF UA US UPI UFK U Chart 5 Page 11
12 b. Traveler Profiles Based on spend analytics and feedback sessions conducted at all seven campuses and University of aine System offices, there appear to be distinct traveler groups. These groups have both shared and particular needs and requirements. - In-State Travel These travelers are primarily driving within aine. The primary cost is mileage. Rental cars, tolls, food and lodging are lesser costs. The current manual, paper-based reimbursement process can be very efficient. However, it sometimes takes weeks as paper moves through the approval process with delays created by incomplete forms, insufficient documentation and/or lacking appropriate approvals. - Infrequent Out-of-state Travel These travelers attend out-of-state events such as professional development or association conferences, accreditation training, and/or academic meetings once or twice a year. Event organizers often obtain group rates for lodging and food. Discounts for early registration may be provided. This group has concerns about travel policies relating to per diem meal allowances, tipping policies, and reimbursement/cash advance timing for early bookings, and procurement card approval requirements and limits. This may involve foreign travel. - Frequent Out-of-state Travel These travelers take multiple trips throughout the year for activity such as consulting engagements, academic presentations, and research. Travel is often supported by external grants or other restricted funds and may have specific requirements. This may also involve foreign travel to challenging locations with unique requirements. Travelers in this category include, but are not limited to, faculty and staff from US s uskie School of Public Service and University of aine researchers. This group has concerns about travel policies, for per diem meal allowances, tipping policies as well as procurement card approval requirements and limits. - Group Travel: Students Student groups travel as part of courses, volunteer activity, and/or University-sponsored athletic events. A single staff member typically books group travel. Trip arrangements may involve travel agents and/or companies who specialize in student or group travel. Group travel may have specific requirements for items such as insurance, complying with athletic tournament regulations, and special ground transportation (vans, buses). - Other Travel Non-University travelers may have their travel expenses covered if related to University business. Examples include candidate interviews for faculty positions, as well as guest lecturers, researchers, and some students. Guest travel is generally reimbursed using the same process as university employees. This necessitates the creation of a vendor account. This process is seen as cumbersome, particularly by students traveling to volunteer in court as part of their legal studies. Page 12
13 c. Process Analysis Page 13 i. Travel Approval The travel approval process is separate from the actual travel booking process. Travelers are currently supposed to have a completed and signed Request for Travel before making travel arrangements. Reportedly, some travelers book their travel while gathering the request form trip details. Because there is no standard booking process or electronic workflow linking approvals to bookings, systematic support is weak for helping travelers ensure travel approval occurs in the intended workflow and not after travel already is booked. ii. Bookings There is no standard process or preferred contracted travel management company used to book travel. Campuses and individual travelers use a variety of booking methods including on-line consumer sites, local and national travel agencies, and booking directly with providers. All campuses except U allow travelers to utilize the University procurement card (Pcard) when booking travel. Travel booking fees are not captured separately in the travel reimbursement system. Therefore it s not possible to systematically discern how much is spent annually on travel booking fees. By reviewing a sample of approximately 250 travel related Pcard transactions in FY2012 the following was documented: - fees for travel bookings ranged from $0-$120 per booking, - on-line consumer sites charged $7 per transaction, - the most common agent-assisted booking fee was $42, and - the approximately 250 transaction sample reviewed contained 19 different fee rates The University of aine at Orono (U) generally does not allow the use of Pcard for booking travel. Travel at U is booked with one of eight approved aine based travel agencies and the travel vendor then submits an invoice to U for payment. An analysis of accounts payable (AP) data for U found annual spend for agency-based travel bookings at approximately $1.1 million with fees ranging from $20-$43 and about half the travel spend with one local agency. AP data does not capture spend detail so it s not possible to determine how much was spent for agency services versus pass-thru payments for travel providers such as airlines. In summary, there is a significant range of services and fees being charged by multiple vendors with no mechanism for tracking, standardizing or negotiating favorable fee structures. There are some concerns about the economic impact of a managed travel solution on local / aine based businesses as well as on the need to ensure substantial expenditures by the University are being competitively bid and awarded. Similar feedback was given during campus visits about other items. Consequently a detailed discussion of local preference including statutory public procurement requirements is included in the Procurement Process section of the report iii. Reimbursement Process As shown in the travel process mapping example from UF (Chart 6), the travel and reimbursement process is a paper-based system requiring at least nine steps. Duplicative travel information is filled out or entered at least four times: travel request form, travel booking, travel reimbursement request,
14 PeopleSoft Finance system plus additional forms as needed for cash advances and/or exception requests. Reimbursement forms and receipts are manually collected and prepared for submission, approval and payment or to document the use of approved cash advances for travel expenses. There is no electronic tracking of travel requests or reimbursements. Submission of incomplete forms, insufficient documentation and/or missing approvals creates delays in payment and difficulties tracking the status of a request. At US, a departments with frequent travelers reported needing to dedicate administrative staff to walk reimbursement paperwork through the system to insure prompt processing. Individual reimbursement items may be captured on paper forms, but are not consistently entered into the reimbursement system making it difficult to break down the nearly $9.3 million in annual travel expense into individual cost components (i.e., agency fees, air fares, car rentals, mileage). There is no automated mechanism for encumbering travel expenses or tracking outstanding travel reimbursements for approved travel. Some travelers wait to submit reimbursement requests until the end of a semester or the fiscal year. One of the reasons cited for this is the cumbersome, paperintensive process for submitting reimbursements. End of fiscal year delayed reimbursement requests can create budget management challenges if a department expects these funds to be available for other purposes. Page 14
15 Travel Booking and Payment Process Example: University of aine at Farmington (UF)* Steps Required User / Approver Steps: 6 Back-office Steps: 3 Automated Steps: 0 Total Steps: 9 Administrative Review: Traveler Completes Exception Request (i.e., Internet access, Higher Per Diem Rate) CFO Travel Request Exceptions Approved Traveler / Admin Approver Traveler / Admin Traveler Book Travel Completes Travel Request Form (including researching costs) Travel Request Approved Books Travel (i.e., various agencies, on-line sites, direct) Takes Trip: Collects Original Paper Receipts Traveler Cash Advance Request Completed CFO Cash Advance Approved Systems Office Cash Advance Check Created System Office System Office Systems Office CFO / Designee Traveler Reconcile Payments Reimbursement Issued (if due) as Check or Direct Deposit Travel Info Entered into PeopleSoft Expense System Travel Expense Voucher reviewed and Audited Travel Expense Voucher Approved Completes Travel Expense Voucher w/ original reciepts System Office Issue Vendor Payment(s)** Traveler Reimburses University (if Cash Advance not completely used) * Travel process may vary by individual campus. Process shown is for UF. ** Vendor payments may require additional steps (i.e., invoice processing, procurement card reconciliation, wire transfer for international travel). Legend User/Approver Back-office / Admin Automated E anual, Paper-based Process Electronic, Paper-less Process Optional Process Chart 6 Page 15
16 iv. Vendor Payment Process (Pcard, Personal Credit Card, Invoice, PO, Wire) Travel service providers receive payment through multiple methods. These include the University procurement card, payment through Accounts Payable from a vendor invoice, wire payments for international travel, and/or direct payment from the traveler by personal credit card or cash with the traveler subsequent reimbursement by the University. Payment mechanisms vary by campus. In the absence of a standardized payment mechanism, travel spend details are not consistently captured or entered into University finance systems limiting the ability to analyze spend data. v. Travel Policies Travel and Expense procedures are outlined in an administrative practice letter (APL) published November 04, The T&E APL establishes broad guidelines for travels and provides broad discretion for implementation to CFOs or designees for individual campuses. This has created some differences between campuses for items such as tipping, per diem allowances for high cost localities and appropriate use of pcard for travel expenses. Travel policies are not integrated into travel booking methods or travel reimbursement forms. Individual travelers and their supervisors may not uniformly interpret travel policies when making travel arrangements and requesting reimbursement. ost campuses require a second-level review of expenditures at the point when data is keyed into a payment process. vi. Training Keeping travelers well informed and trained is very challenging. ost University employees do not travel frequently enough to develop expertise in travel policies, procedures, and practices. In addition, training is typically provided by the employee s supervisor who may not be well versed in travel policies themselves. Training also is complicated by the variations in policy interpretation and practice across the University. This results in errors and delays. vii. Travel Category anagement Category management refers to the ability to analyze and manage various spend categories within an expense area. For travel, the major expense categories include agency fees, transportation (air fare, charters, and car rentals), lodging, and food. The current ability to manage travel category expenses on an enterprise level is extremely limited. The University does not have an automated mechanism for tracking and/or analyzing travel spend by category. The University does not have negotiated enterprise contracts for pricing or services levels with preferred suppliers for any of the major spend categories, with the exception of rental cars. viii. Oversight / Adherence / Reporting The need for University system-wide travel reporting is reinforced by the recent enactment of a aine State law governing travel policy requirements for quasi-independent state entities (an act to implement the recommendations of the Office of Program Evaluation and Government Accountability and the Government Oversight Committee Regarding Quasi-independent State Entities). The new law defines the required process for budgeting and reporting for travel, meals and entertainment expenses including: Page 16
17 - establish the requirements for supporting documentation and approval of travel, meal and entertainment costs paid directly or through reimbursement; - require for identification and reporting purposes that travel, meal and entertainment costs are budgeted and accounted for separately from other expenditures in the entity's records; and - require that the governing body must approve the annual budget for travel, meal and entertainment costs and be provided periodic reports on actual costs paid directly or reimbursed. The University is preparing to meet these new requirements. Capturing travel spend on an enterprise basis and consistently applying and communicating policy and procedure will enhance the University s ability to do so. 2. Review of Higher Education Best Practices a. Contracted Travel anagement Company The best practice for higher education travel is to engage a preferred Travel anagement Company as the primary contact for booking travel, managing policy adherence and negotiating supplier contracts. This is consistent with what is found in other sectors. Reported benefits include customized on-line booking with agent support when needed or desired, integration with University travel policies, improved automated travel authorization functionality, and direct data export from booking to electronic reimbursement forms. Institutions report significant savings as a result of transitioning to a travel management company with an on-line booking tool. The University of Colorado reduced booking fees to $6 on-line and $20 agent assisted saving $90,000 a year in agency fees. The Education Advisory Board observed that institutions which utilize a preferred agency improve adherence to travel policies and better facilitate data gathering which can be leveraged during supplier negotiations. b. Unified Booking Tool with multiple access channels (on-line, mobile, agent-assisted) A key feature of many travel management company offerings is a unified booking tool with multiple methods for travelers to book travel including on-line, agent assisted and mobile. Similarly, important traveler notifications such as flight cancellations can be communicated through multiple methods such as eail, text, and automated calls. Travelers are not limited to any single communication method throughout the travel process. For example, a traveler might book on-line, get notified via eail, make a status inquiry from their smart phone, and then speak directly with an agent to make a change. While there may be multiple communication and booking methods, data collection is unified in a single system and integrated with electronic reimbursement forms. Page 17
18 c. Electronic Travel Expense anagement system (Reimbursement and Approval) Administrative Review: Along with engaging a travel management company, best practice institutions have implemented electronic travel expense management systems to provide a paper-less method for collecting travel information, managing approval workflow, and integrating with payment systems. An integrated unified booking tool and electronic travel expenses management system means that travel information is input once, at the time of the trip request and booking. Travel booking information is used to pre-fill electronic reimbursement forms regardless if the booking was made through an agent, on-line, or combination of both. If allowed by travel policy requirements, receipts can be submitted as scanned PDF documents or in other electronic formats and electronically attached to the electronic reimbursement form. According to the Education Advisory Board (EAB), institutions that have transitioned to electronic systems have found numerous benefits including: - faster and simpler reimbursements for travelers, - elimination of paper, - processing reimbursement requests with fewer overall administrative staff, and - integration with other finance systems. EAB cited an example of an institution that reduced T&E reimbursement from days to 2-4 days. The Aberdeen Group found that automation of T&E expense management reduced processing costs by 50-60% and improved policy adherence by 35-40%. d. Savings through Strategic Sourcing of Travel Categories A 2010 benchmarking study from RPG research found that while some organization try to save money by reducing or eliminating travel, best practice organizations manage costs by reducing prices paid for travel services such as auto rentals, hotel stays, and consolidated air travel. Leading institutions document the total travel spend by category and use that knowledge to secure contracts with volume pricing, favorable terms and service levels. Travel management companies can leverage the aggregate spend of their customer base to get preferred pricing from key travel suppliers such as hotel chains and car rental agencies. The University of Colorado reported a $130,000 a year savings in airline fares and a 50% discount off published rates for airport parking through contracting with airlines and parking providers. e. Flexibility for Unique Travel Requirements (International, Guest Travel, Athletics) While creating a unified travel management process can have significant benefits, it is critical that universities fully understand and appreciate the unique requirements of certain travel groups and travelers when making supplier selections. For instance, some universities have a dedicated travel management company with experience with NCAA athletic travel regulations. The Education Advisory Board (EAB) highlighted the need for flexibility noting that most Universities avoid out-right travel mandates and also provide faculty with options for booking independently for exceptional circumstances. Page 18
19 Page 19 Administrative Review:
 and ELECTRONIC TRAVEL REIBURSEENT SYSTE through a competitive public process to provide unified on-line and agent assisted travel services that are integrated with a")
20 3. Recommendations F. CONDUCT A COPREHENSIVE ASSESSENT to document the travel service requirements for all traveler groups and locations. G. SECURE TRAVEL ANAGEENT COPANY(S) and ELECTRONIC TRAVEL REIBURSEENT SYSTE through a competitive public process to provide unified on-line and agent assisted travel services that are integrated with a paperless travel reimbursement system. H. CONTRACT WITH PREFERRED PROVIDERS for favorable pricing and service guarantees for transportation, airfare, and lodging to the extent practicable in the context of the specific needs of University travelers. I. UPDATE TRAVEL AND EXPENSE ADINISTRATIVE PRACTICE LETTER (APL) with clear guidelines for areas such as tipping, per diem rates in high cost destinations, and exceptions for unique travel needs. J. ESTABLISH UNIFIED TRAVEL ADINISTRATION as part of a comprehensive University systemwide procurement strategy to provide consistent policies and services for all locations with a dedicated support structure. Staff would be located at both campus and system offices with emphasis on ensuring effective campus-based presence. Page 20
21 III. Findings and Recommendations: 1. Procurement of Specific Goods and Services B. Strategic Sourcing of Other Commodities and Services 1. Current State a. Spend Analysis As previously described, producing a detailed system-wide spend analysis by product or service is a considerable challenge due to multiple procurement processes and systems, differing procurement policy interpretations by campus, and data entry and general ledger coding inconsistencies. Further, not all spend for products and services is addressable ; that is, available for public competitive bid. Some campuses may already have contracts in place for specific products and services preventing the shortterm ability to combine that spend with other campuses to create a system-wide bid opportunity. In addition, as much as half of University system-wide spend is for products and services paid with restricted funds such as grants and generally will have specific procurement requirements and/or limitations for how any savings is used. In 2009, the Huron consulting group conducted an independent assessment of the University s procurement process including a comprehensive review of procurement card (Pcard) and accounts payable (AP) spend data from By creating a custom database to consolidate and normalize spend data, the Huron group identified several product/service categories where a public competitive bid process might provide increased efficiencies and cost savings. Since the 2009 Huron report, the University s ability to analyze spend has somewhat improved through several initiatives including: - centralizing AP functions as a system-wide shared services unit located at U in Orono, - implementing an eprocurement system, ainestreet arketplace (S), for many common goods and services, and - executing system-wide contracts for many of the Huron identified goods and services through the competitive public bid process, or by leveraging contracts available through higher education group purchasing organizations (GPO). Even with these improvements, analyzing university spend on an enterprise basis continues to be a challenge. However, the procurement office has made progress toward developing an enterprise sourcing strategy. Since 2009, the procurement office has implemented Strategic Sourcing initiatives resulting in savings of $463,000 before investment, according to an updated February 2013 report by Huron regarding eprocurement progress at the University. By further leveraging Huron s 2009 analysis, supplemented by review of S, Pcard and AP data, plus suggestions provided during recent procurement feedback sessions at each of the seven campuses, the procurement office has developed a category listing of additional potential sourcing opportunities (Table 1). These spend categories represent an estimated $10+ million University system-wide addressable spend, with over $5 million coming from non-restricted, E&G funds. Page 21
22 Potential Spend Categories for Strategic Sourcing Spend Categories Electricity Description Competitively bid electricity for locations where this is not already occurring. ethodology for Estimating Baseline Addressable Spend - 55 KH of use at 20% smaller campuses (Addressable as 80% already managed) = 11 KH est. savings $0.002 per KH - Avg 4 year Cost annual $8.5mm with 1/2 of $1.7 addressable = $850k with 2-3% est. save. Assumed Estimated Annual Estimated Annual Funding Addressable Spend: Addressable Spend: Break-down by Fund Source Total E&G Non E&G E&G Non E&G $ 850,000 55% 45% $ 467,500 $ 382,500 IT Hardware Custodial Paper Goods Scientific Equipment Commercial Print Temporary Employment Services Books / Periodicals Vehicle Services and Parts Prospect Lists Desktops, laptops, etc.; has been Estimated based on historic spend with current bid previously but may have more primary suppliers. opportunities with standardization. Not including Apple Currently multiple suppliers, spend hasn't been aggregated Previously bid, additional opportunities outside of primary suppliers Estimated based on historic AP spend with current three top suppliers: ~$460,00 plus spend identified with S suppliers ~ $60k, does not include Pcard spend which is assumed to be minimal for this category. Estimated based on opportunities identified and spend analysis from the 2009 Huron Consulting report. Better pricing with fewer suppliers Conservative estimated based on opportunities identified and spend analysis from the 2009 Huron Consulting report. Set contract and rate sheet for common positions. Enterprise contract for all campus library books and periodicals Vehicle services where there isn't sufficient in-house capacity to meet the need. ~500 registered vehicles.= Reduce per head charge for prospect lists Estimated based on historic AP spend with known Temp agencies. Conservative estimate based on opportunities identified and spend analysis from the 2009 Huron Consulting report. Opportunity identified during campus feedback sessions. Estimate based on historic AP and Pcard spend with known vehicle parts suppliers. Opportunity identified during campus feedback sessions. Estimate based on historic AP and Pcard spend with known mailing list provider. $ 3,000,000 55% 45% $ 1,650,000 $ 1,350,000 $ 500,000 55% 45% $ 275,000 $ 225,000 $ 500,000 55% 45% $ 275,000 $ 225,000 $ 1,000,000 55% 45% $ 550,000 $ 450,000 $ 100,000 55% 45% $ 55,000 $ 45,000 $ 3,000,000 55% 45% $ 1,650,000 $ 1,350,000 $ 100,000 55% 45% $ 55,000 $ 45,000 $ 100,000 55% 45% $ 55,000 $ 45,000 Vehicles Enterprise contract(s) for standard on-road vehicles used by the University system. Opportunity identified during campus feedback sessions and procurement survey. Estimate based on current vehicle data of approximately 500 on-road registered vehicles with estimated turnover 10% per year at $18k avg cost per vehicle. $ 900,000 55% 45% $ 495,000 $ 405,000 Shipping Courier Services: opportunity to Estimated based on historic spend with bring additional shipping locations incumbent supplier. under more favorable contract terms. Note: savings begins 8 months into 2013 $ 120,000 55% 45% $ 66,000 $ 54,000 Total $ 10,170,000 $ 5,527,500 $ 4,522,500 Table 1 Page 22
23 b. Process Analysis From a process perspective, the 2009 Huron report found that the University s spend was not being managed on a system-wide basis due to low awareness of System contracts, lack of procurement involvement in many spend areas, and multiple purchasing tools facilitating spend outside of established contracts and outlets. In 2010, Scottadden management consultants conducted a detailed analysis of the AP function. The resulting report noted that having AP functions distributed across multiple locations of different sizes created numerous issues including: process inconsistencies and lack of standards, wide-ranging performance metrics, high degree of resource allocation variability by location, and data collection inconsistencies. Since the Huron and Scottadden reports were issued, the University has taken significant steps towards addressing process issues to standardize procurement activity, normalize spend data and create a more proactive spend management environment. In addition to centralizing AP functions and implementing ainestreet arketplace, the University has issued updated procurement administration practice letters (APLs) for purchasing procedures, procurement standards of conduct, purchasing card (Pcard) guidelines, and travel and expense procedures. The September 2012 APL for Purchasing outlines procurement procedures and establishes process standards including: - requirements for segregation of duties and key internal controls, - guidelines for use of purchase orders to maintain adequate financial controls such as budget encumbrances and liquidations, - competitive procurement process requirements and thresholds: o Less the $10,000: purchases may occur based on verbal quotes o $10,000-$50,000: require solicitation of at least three (3) written quotes o $50,000+: require a formal sealed competitive process with detailed specifications for how the bid process is conducted - approved language for service contracts. The updated procurement APL provides a significant step forward for creating a standard, auditable procurement process. However, opportunities remain to continue improvement. Spend with some local travel agencies, for example, far exceeds the $50,000 annual threshold but have not been subject to competitive bid. Further, a recent informal review of non-po purchases found an estimated $6-$8 million in annual spend outside routine PO procedures. This represents as many as 10-12,000 invoices that require extra manual work when submitted to AP which in turn creates administrative bottlenecks and delays when invoices are received. In addition, this kind of activity does not encumber funds at the time of purchase and complicates the budget reconciliation process increasing the potential risk of a department having fewer resources than it believes. Campus feedback sessions and a recent procurement survey provided a strong message that while detailed standards and process guidelines are important, there should also be an easy and flexible process for legitimate exceptions and/or opportunities for out-of-process savings. For example, a research group taking ice core samples in Antarctica can t reasonably be expected to get pre-approval to Page 23
24 procure replacement parts for failing equipment. Activities financed with restricted funds may have external limitations on how funds are spent and/or how savings is distributed. Group athletic travel may have travel requirements based on NCAA or other tournament rules which differ from the prescribed process. The clear message from campus feedback was for on-going communications and campus involvement to develop a flexible process that takes into account the varied and unique procurement requirements, while staying within the bounds of statutory and policy limits and requirements for competitive procurement and transparency. c. Contract anagement The University contract process utilizes templates with pre-approved terms and conditions. This increasingly results in enterprise-wide agreements which can be used by all campuses, especially for catalog S suppliers. However, many contracts are still campus specific with no consolidated vendor management or formalized contract compliance function. As a result, it is not unusual for contracts to exist at several campuses for the same product or service or even the same supplier. For example, during recent campus feedback sessions, campus personnel reported purchasing student recruitment mailing lists only to discover that the same lists were purchased from the same vendor by other campuses. Contract management and tracking is fragmented with no consolidated storage or document control. This decentralized approach makes it difficult to review contracts by product, service or by termination date. As a result, contracts sometimes expire, or auto-renew without review. In some cases, original contracts aren t available and a copy must be requested from the vendor. In other cases, contracts exist that contain terms and conditions that are disadvantageous and may introduce unnecessary risk to the University. Further, the ability to analyze actual product/service pricing and performance against contracted service level agreements (SLAs) and key performance indicators (KPIs) is exceedingly difficult. d. Strategic Sourcing The Huron consulting group describes Sourcing as the analysis of internal and external data and supplier negotiations required to identify best value vendors and develop contracts to ensure the optimal spend alignment and utilizations of vendor agreements. In short, Strategic Sourcing is a process for leveraging the University system s combined purchasing power to ensure the best price and value for goods and services purchased. As described earlier, that University s ability to effectively conduct sourcing initiatives is hindered by incomplete data analysis, decentralized contract management, and as will be discussed in the structure section below, lack of dedicated sourcing resources. e. aine-based Business Several campus feedback sessions highlighted the importance of University procurement activity to the local economy. Some participants expressed concern that as procurement activity moves to enterprisewide contracts, local businesses might be negatively impacted. It was suggested that the procurement process include language for giving preference for local business during bid evaluations. The current process does enable some local business support. As defined in the purchasing APL, competitive bidding is not required for purchases under $10,000 where there isn t an existing Page 24
25 contractual supplier and often the most expedient choice is a local business. For procurement over $50,000, preference for in-state bidders is allowed when equal or tie bids are received. In fact, an analysis of all FY2012 AP payments found that 47% of dollars spent went to aine addresses (this data does not include aine businesses that use out of state lock box payment processing centers). The current process does not however provide provisions for in-state preference for high value purchases. While the pivotal role of the University within its local community and economy cannot be overstated, there are serious legal and process implications when considering in-state preference components for high dollar purchases. First, providing preference for items other than overall value (price + quality + meeting requirements) means, by definition, that the buyer is making a sub-optimal purchasing decision. That is, the buyer is potentially agreeing voluntarily to pay more for a good or service than is needed or otherwise to accept a good service which represents something other than the best value. As a publically financed entity, the University has a responsibility to both its students and the state s taxpayers for best value driven procurement. Second, there may be unintended consequences to an in-state preference. States in certain circumstances have retaliatory legal obligations that can actually hurt aine based businesses if they bid for state business in neighboring states. The University seeks to be aware of and sensitive to this issue even if not directly impacted by such statutes. aine s economic well being relies heavily on out-ofstate business. Four of the top 10 aine private employers are based out-of- state but have significant local facilities with thousands of aine-based employees and investment in local communities. Advancing aine s economic development certainly includes allowing the companies with the greatest commitment to aine s economy, regardless of whether the company is based in aine or elsewhere, a fair opportunity to compete for the University s business. The State of aine recently enacted legislation requiring that all quasi-independent State entities establish a competitive procurement methodology (aine Public Law, Chapter 616). Further, the University Board of Trustees recently established competitive procurement as the standard procurement method of the University (Policy anual Section 701: Operating & Capital Budgets). Recognizing the challenges of so-called in-state preferences, the State of aine has established criteria for purchases over $100,000 that takes into account the bidder s expected impact to aine s economy, regardless of where the business is located. As stated in Executive Order , certain competitive bids shall include scoring criteria evaluating the responding Bidder s economic impact on the aine economy and State revenues. The State of aine approach may provide guidance for establishing local economic impact criteria for University procurement. Page 25

26 4. Review of Higher Education Best Practices a. Strategic Sourcing ethodology Higher Education procurement best practice increasingly focuses on developing a Strategic Sourcing methodology executed by a dedicated team of Sourcing professionals. One common sourcing methodology involves consecutive steps of analyze, design, source, use, and manage (Chart 7). Strategic Sourcing ethodology Analyze Plan Design Strategy Source contract Use Vendor anage Analysis framework will help identify, size and prioritize spend categories for Sourcing Understand supply chain dynamics, total cost of ownership factors and begin developing a sourcing strategy Select vendor(s), RFx process, establish SLA, KPI, governance and execute contract Implement contract, utilize products and services, and measure results anage vendor(s) holistically for continuous improvement and mutual benefit Chart 7 During the ANALYZE step, spend history, campus budget forecasts and existing contracts are reviewed to identify potential public competitive bid opportunities. During DESIGN, potential opportunities are fully examined to determine total cost of ownership, potential suppliers and industry dynamics to develop a sourcing strategy for bid timing and negotiation criteria. While analyze and design activity is ongoing throughout the year, a concentrated effort is often part of the budget planning process and conducted in close partnership with key stakeholders and department managers. The SOURCE step focuses on the actual public competitive bid process including requirements development, evaluation activity, and negotiations to establish service level agreements (SLAs), Key Performance Indicators (KPIs) and pricing. The USE step involves implementing the contract and ensuring proper vendor management responsibility is assigned and understood. The goal is that contracts executed with advantageous terms are fully recognized and to ensure users of the goods and services are aware of contract terms. This step may involve development of a RACI matrix (Responsible, Accountable, Consulted, Informed) to clearly defines roles and responsibilities for vendor management. Finally, key suppliers are fully engaged in the ANAGE step which may include periodic meetings to review actual performance against contracted SLAs and KPIs and identify opportunities for improvement. Page 26
27 b. Strategic Sourcing Process In its 2009 University of aine System procurement assessment, the Huron consulting group identified key characteristics / benchmarks from leading Higher Education procurement practices which included: - multi-year strategic plan to guide progress - strategic organization approach - focus on customer relationships - involvement in broad areas of spend across the institution - continuous data analysis to support strategic sourcing and compliance efforts - high utilization of advanced technologies - formalized strategic sourcing approach as part of ongoing operations The administrative review team found numerous examples where leading universities are putting these practices into action. In its 2010 operational excellence strategy, the University of California at Berkeley highlighted the need to restructure procurement organization to increase focus on strategic sourcing (vs. Transactional) activities in order to: - Negotiate University-wide, best-priced, strategic vendor contracts and aggressively drive spending through them - Increase categories covered by contracts - Drive contract utilization through policies and incentives, as well as through marketing and customer service strategies - Standardize and manage demand for commonly purchased goods - Complete on-time implementation and drive usage of e-procurement to make purchasing easier and more efficient The State of North Carolina has developed a procurement transformation model being adopted by state agencies and colleges which features centrally-led sourcing and management groups focused by category/industry and ongoing procurement analysis. The University of NC at Chapel Hill is supporting strategic sourcing by investing in tools for: - Electronic Analytics for identifying Strategic Sourcing Opportunities - Electronic Contract management support systems - Electronic RFx support system / evaluation work flow / vendor notification The University of Colorado created a dedicated Strategic Sourcing Group focused primarily on improving contracts for the university system. Cornell University is adopting a more standardized method of procurement which includes a focus on strategic sourcing and utilizing eprocurement tools. The University of aine System has an opportunity to leverage the experience and success of these and other peer universities, as well as its own expertise, for designing and implementing a Strategic Sourcing practice. Page 27

28 5. Recommendations A. ESTABLISH ULTI-CAPUS ADVISORY GROUPS with expertise in products and services being considered for competitive public bid. B. DEVELOP SPEND ANALYTICS ETHODOLOGY/TOOLS to better identify products and services where the University system would save money and add value from a competitive public bid process. C. IPLEENT CONTRACT ANAGEENT PROCESS to better manage suppliers, ensure consistent contract terms across the University system, eliminate redundant agreements, and identify opportunities for competitive public bids / re-bids. D. CONDUCT COPETITIVE PUBLIC BIDS for key products and services such as electricity, IT hardware (in coordination with IT administrative review), promotional materials, custodial paper goods, scientific equipment, commercial print, temporary employment, books/periodicals, vehicle services and parts, and prospect lists. E. EXPAND THE BREADTH OF PRODUCTS AVAILABLE WITH FAVORABLE PRICING AND CONTRACT TERS by increasing ainestreet arketplace (S) catalog suppliers and migrating procurement activity from procurement card (Pcard) to S as appropriate. Page 28
29 III. Findings and Recommendations: 2. Procurement Card (Pcard) Administration 1. Current State a. Spend Analysis The Purchasing card (Pcard) program is currently designed to facilitate small dollar purchases, emergency purchases, and travel related expenditures. The use of Pcards has proliferated throughout the University system to the point where as of December 2012 almost 30% of University employees had a Pcard (Chart 8). This outpaced the 17.40% Pcard and 8.6% travel card average for large universities as reported in RPG Research s 2010/2011 survey of Pcard and travel card use (Table 2) card for every # employees as of December 2012 US U SWS UF UA UPI U UFK Avg > EE data from US data book. Assumes 4,992 employees and 1,425 purchasing cards. Campus Purchasing Card Distribution as of December 2012 # of Cards # of Employees 1 card per # of Employees % of Employees who have a Pcard US 412 1, % U 686 2, % SWS % UF % UA % UPI % U % UFK % Avg 1,425 4, % Large University Average % of Employees with Travel or Pcard (RPB Research Corp Survey 2010/2011) Pcard Travel Card Chart 8 Table % 8.60% As the RPG survey noted, the greater the distribution of cards, the higher the expected spend. So it s not surprising that annual expenditures from Pcard purchases, for the 12 months ending December 2012, totaled close to $11.7 million making Pcard use a significant contributor to the University system s expense base (Table 3). aine s two largest campuses accounted for almost 80% of Pcard transactions and over $9.2 million in expenditures. Page 29
30 Purchasing Card Spend over 12 months ending December 2012 Campus Total # Total # of Avg Transaction Avg Transactions Cards Purchases Transactions Value per Card U 686 $ 6,689,573 35,032 $ US 412 $ 2,558,817 18,280 $ UA 103 $ 771,261 4,268 $ UF 87 $ 469,445 2,375 $ SWS 43 $ 250, $ UPI 46 $ 466,908 2,370 $ UFK 27 $ 263,602 1,174 $ U 21 $ 180,935 1,415 $ Total 1,425 $ 11,651,108 65,911 $ Table 3 b. Process Analysis i. Fragmented Administration Under current guidelines, individual campuses have significant flexibility. The campus CFO or CFO designees have ultimate responsibility for monitoring and controlling Pcard use. This includes making decisions as to which persons will be provided with a Pcard. As a result of this decentralized model, Pcard usage is inconsistently administered across campuses with high levels of program variability and duplication of effort. Rules pertaining to card issuance, usage criteria and exception review vary significantly between campuses, and in some case between departments on the same campus. At recent campus feedback sessions, concern was expressed that the employees were not being treated equitably as a result of different pcard policies at different campuses. As of December 2012, 22 positions across the enterprise were identified as having some form of responsibility for Pcard administration. Pcard administrators at individual campus work hard to provide a high level of customer service and responsiveness. However, in most cases, Pcard administration is small fraction of their overall job responsibilities accounting for only 3.41 FTE s for those 22 positions. With this limited focus, providing consistent Pcard administrative support and flexibility is a challenge. ii. Resource Intensive Administration While Pcards provide convenience for immediate purchase from on-line vendors and retail establishments, they also create significant administrative overhead with manual, paper-based processing requirements. As shown in the Pcard work flow mapping below (Chart 9), the typical full procurement-to-payment process takes 14 steps. The manual hand-off between tasks is paper-based and requires storage of paper records and receipts on each campus. Page 30
31 Procurement to Payment Process Procurement Card (Pcard) Steps Required User / Approver Steps: 6 Back-office Steps: 7 Supplier / 3rd Party Steps 1 Automated Steps: 0 Total Steps: 14 User Place Order and Receive Product User Shop Supplier Approver(s) User Transaction Approved ake Purchase User User Receives Goods from Supplier Expedite Undelivered Goods (If Needed) Pcard Admin Record Keeper Record Keeper Record Keeper User ake Payment and Post Expense Transactions Verified and Final Approval Pcard Admin Receipt Verified and Approved in Pcard Software Approver Assign Accounting Codes Pcard Admin Store Paper Receipts Fund anager Receipt Signed Sent to Record Keeper Pcard Company Charges apped to General Ledger Payment Wired to onthly Statement onthly charges Pcard Company & E Reviewed and Reconciled to PeopleSoft Approved Pcard Statement Reconciled Pcard Company Pays Supplier (minus Fee) Expense Posted Additional Processes Pcard Admin(s) Informal Audits* Controller/ Auditor Formal Audits* (*) Due to the level of risk in Pcard transactions, regular formal and informal audits are conducted. User/Approver Back-office / Admin Supplier Automated Legend Chart 9 E E Expense anual, Paper-based Process Electronic, Paper-less Process Optional Process Finance Process Page 31
32 In addition, the University s financial system does not reflect Pcard purchases until the end of the processing cycle; well after the purchase has been made and the financial obligation incurred. As a result, department funds may appear to be unencumbered and available when in reality purchases have been made for which the University is responsible. oreover, because of the paper intensive process, the ability to support adherence to University policies and statutory obligations requires periodic paper intensive formal and informal audits necessitating additional administration and staff resources. In contrast, the University s eprocurement system (ainestreet arketplace (S)) utilizes an electronic catalog system with streamlined, paper-free administration. As shown in the S process flow below (Chart 10), a transaction is completed in 10 steps, including several steps which are automated and require minimal administration. In addition, the entire process is electronic with eail based work-flow for approvals and transaction notifications. Department funds are encumbered at the time of final approval giving full visibility to pending financial obligations. And because the entire process is electronic, much of the required program management and oversight activity can be accomplished through data analysis. Page 32
33 Procurement to Payment Process ainestreet arketplace (S) Steps Required User / Approver Steps: 3 Back-office Steps: 3 Supplier / 3rd Party Steps 1 Automated Steps: 2 Total Steps: 10 E User Add New Supplier to S (one time) E E Procurement and/or User Expedite Undelivered Goods E Place Order and Receive Product User Shop Supplier (enter acct codes if authorized) E Admin Input Accounting Codes Approver(s)/ Auto E Order Approved E E (Some approvals automated) Automated Order Transmits to Supplier User User Receives Goods from Supplier Funds Encumbered E ake Payment and Post Expense Procurement Payment to Supplier (Electronic or Check depending on supplier capibility) E or Procurement S Authorizes Payment E Automated Charges Sent to General Ledger E Procurement Invoice approved E Supplier Supplier Sends Invoice for Order Expense Posted Encumbrance Liquidated Additional Optional Processes Procurement / Auditor Formal and Informal Audits User/Approver Back-office / Admin Supplier Automated Legend Chart 10 iii. Higher Product Costs E E Expense anual, Paper-based Process Electronic, Paper-less Process Optional Process Finance Process The Pcard is primarily used for one-off procurement of products and services outside of Universitycontracted suppliers. Typically, there is no ability to obtain volume discounts or usage terms based on the aggregate spend for similar purchases across the enterprise. As a result, the total cost of products purchased with a Pcard are generally more expensive than the same or comparable products purchased through ainestreet arketplace (S) suppliers with negotiated pricing for volume purchasing. Page 33
34 While lower pricing may be available for spot items via on-line vendors or a retail store, when purchases for products across the entire commodity category are analyzed, S catalog vendors are generally more competitive. When a Pcard is used to purchase a single, spot item, and individual department may achieve a minor savings. However, the decrease in S spend can, over time lead to higher costs for US as a whole. An illustrative example, based on actual purchase data, is the purchase of computer products as shown below. The University has secured a contract and pricing with a computer product supplier whose product catalog is available via S. Alternatively, an on-line computer component vendor aggressively markets their competitive pricing and ease of purchasing via credit card. Some University employees began buying products from the on-line vendor using a Pcard. Wanting to test the competitiveness of the S supplier offerings versus the on-line vender, the University procurement team did a price comparison of the most popular 50 computer products purchased by University employees during the previous 12 month period. The results of the computer product pricing study validated the value of negotiated pricing for a catalog of product offerings (Table 4). While the on-line vendor was less expensive for 3 items (average savings 6.67%), the S vendor was far more competitive offering 36 items with lower pricing (average savings of 22.5%). oreover, the on-line vendor didn t offer 9 of the items that had been purchased via S. Additionally, the on-line vendor offerings do not include free shipping except for certain seasonal promotions and/or specific product specials. The S negotiated contract specifies free shipping for most purchases providing further savings. Computer Product Purchases Comparison: On-Line Vendor versus S Supplier Top 50 Computer Products Purchased within the Past Year * Product Availability and Pricing On-Line Vendor S Vendor Items available (out of 50) Same Price (out of 41) 2 2 Lowest Price Items (out of 39) 3 36 Avg % Savings for Lower Priced Items 6.7% 22.5% Terms and Conditions On-Line Vendor S Vendor University Contract No Yes Free Shipping Varies Yes** Payment from AP No Yes Ability to Negotiate Pricing No Yes * Does not include US which does not utilize S for computer products. ** Items requiring special handling may incur shipping charge. Table 4 Page 34
35 S contracted suppliers have other pricing advantages. Because the University pays directly, the supplier avoids the interchange fee (typically 2-4%) charged by Pcard processing companies, providing the University with additional negotiating leverage. Additionally, for large dollar purchases, the University may have options for early payment and realize prompt-payment discounts. In the case where it is discovered that an alternate non-s vendors has consistently more competitive pricing, the University can use that information to manage the contracted supplier towards improved pricing benefiting the entire enterprise. iv. Lack of University Terms and Conditions Purchase price is but one of the components that impact expense. True expense management involves understanding the total cost of ownership (TCO) which may include shipping, installation, training, maintenance, repair, returns, additional consumables (e.g. print cartridges, replacement bulbs), energy use, product upgrades, and/or end-of-life disposal (Chart 10). For contracted suppliers, Total Cost of Ownership (TCO) Purchase Price The Tip of the Iceberg + Shipping Storage Installation Training / Support Administration Resources Supplies / Consumables aintenance / Repair Licensing Upgrades Energy Use Chart 10 favorable terms for TCO drivers can be specified and managed through service level agreements (SLAs) and key performance indicators (KPIs). For most Pcard purchases, none of this is included. For example, the used video projector purchased on ebay at a 50% discount may not be as advantageous to the University as expected if the true TCO adds expense for shipping, installation, replacement parts, repair, and an early end- of-life. Additionally, University contracts have standard terms and conditions covering areas like product liability, indemnification, privacy, intellectual property, warranty, liability related to transfer of legal title, and/or insurance. These protections are generally not provided for Pcard on-line purchases which may obligate the University to the vendor s terms and conditions at the time the buy button is clicked. v. Recent Policy Changes and Results On December 6, 2010, US launched ainestreet arketplace (S), the University eprocurement site featuring catalogs for commonly purchased products from contracted strategic suppliers. Since the launch, additional suppliers have been added and support materials introduced to increase adoption. Page 35
36 In support of S, and to clarify the role of Pcard as key procurement tool, an updated purchasing card Administrative Practice Letter (APL) was issued on September 1, The revised APL clearly supports the Pcard as an important and effective tool for small dollar, emergency, and/or travel related purchases. In addition, and in keeping with the Administrative Review goal for efficient and costeffective delivery of services, the APL establishes S as the primary procurement method for commonly purchased products and services. The Pcard will continue to be a key procurement tool and especially important for travel, low value and emergency purchases. However, as S has evolved and expanded, University spend for common products has appropriately, organically and intentionally been migrating away from Pcard. Prior to S, Pcard spend had reached $18 million per year. With S s launch and enhancements, Pcard spend has been reduced by 36% from peak levels to $11.5 million and is on track to level out at an estimated $10 million per annum. The chart, with trend line, below illustrates Pcard spending post- S-launch (Chart 11a). Similarly, the number of Pcards issued has dropped (Chart 11b) although this trend could change if Pcard is standardized for travel and expense management as not all campuses currently allow Pcard for travel. $2,000,000 Pcard Spend: July January 2013 FY10 FY11 FY12 FY13 $1,800,000 $1,600,000 $1,400,000 $1,200,000 $1,000,000 $800,000 Pcard Spend Linear (Pcard Spend) $600,000 $400,000 $200,000 $- Chart 11a Page 36
37 2000 Open Cards: July January Open Cards Linear (Open Cards) 1000 FY10 FY11 FY12 FY13 Chart 11b As expected, as the purchase of commonly used products has migrated from Pcard to S, the overall expense associated with those purchases has been reduced. When implemented, S related savings was estimated at $718,000 based projections for improved contract pricing (Strategic Sourcing), migration of Pcard and maverick spend toward preferred agreements, improved vendor compliance with contract terms, and prompt pay discounts. In an independent Return on Investment (ROI) analysis, Huron Consulting found that during the past two calendar years, documented savings has been $1,077,000, or 150% of estimated savings. Page 37
38 2. Review of Higher Education Best Practices a. Comprehensive Procurement Strategy with Integrated eprocurement With the availability of eprocurement systems specializing in higher education purchasing requirements, leading university procurement leaders are re-evaluating the role of Pcard in the context of an overall procurement strategy. The Education Advisory Board (EAB) reports that leading procurement departments are prioritizing eprocurement use over Pcard and finding stakeholder benefits at each stage in the purchasing process. These benefits include convenient shopping, rapid turnaround on orders, department-wide cost savings, increased executive visibility into spend, system-wide cost savings, increased contract compliance, and improved communication with suppliers. In a productivity study at the University of issouri, Pcard transactions were found to require 66% more administrative overhead and cost when compared to their on-line catalog system: Show e Shop (similar to ainestreet arketplace). Specific Show e Shop system benefits cited include: Convenient one-stop shopping and ability to order from multiple vendors in one forum All vendors on contract and all prices pre-negotiated and discounted Rapid turnaround for orders and notifications of order status Elimination of monthly reconciliation of receipts or paper invoices Easy e-approval process with links to approval page sent by System-wide cost savings and added efficiency At Cornell University, comprehensive administrative review efforts are expecting major savings from changes to the Cornell s procurement process. Of the almost $85 million in potential savings identified, about $30 million is slated to come from procurement. To accomplish this, administrators are managing purchasing orders through an online procurement system. They are working to broaden preferred supplier agreements to include more of the campus and then obtain contracts with certain suppliers for lower costs. For example, Cornell has already secured favorable agreements on bulk paper, toner, and copy paper. In most cases, Pcard and Travel card use isn t going away and still has a key role in an overall holistic procurement strategy. However, the purchase of commonly used products is being shifted to eprocurement systems with card use focused on low dollar purchases, emergency procurement and travel. b. Unified Pcard Service and Administration Pcard best practices begin with consistent administration across the enterprise. In a white paper on best practices, leading Pcard processor JP organ Chase emphasizes the need for consistent policies across the organization including establishing card issuance guidelines, transaction controls, and rules for card usage, documentation and record retention. JP organ Chase strongly recommends that the same policies and processes should apply to all cardholders. As discussed below, a key component of unified administration is consistent training. Page 38
39 c. Consistent Enterprise-wide training, policies and support Comprehensive training and support is cited as a critical component for a successful card program. In its 2012 Pcard benchmark survey, RPG research reported that best practice organizations make training a priority organized around the components below (Table 5). Training Best Practices RPG Research 2012 Purchase Card Survey Training Component % of Respondents US Require initial Pcard cardholder training 81% Yes Provide web-based Pcard training 45% Varies by Campus Provide in-person Pcard training 71% Yes Track completion of training and training updates by employees 48% Varies by Campus Establish on-going communication methods for Pcard information 61% Varies by Campus aintain a Web site that answers Pcard questions 44% Varies by Campus Table 5 Card processor JP organ Chase recommends that training by required for cardholders and card managers before a card is issued. For JP organ Chase, education and a clear understanding of cardholder roles and responsibilities is vital to any program. In addition to available monthly training, JP organ Chase suggests establishing a brief online course or quiz and tracking participation. In addition, establishing regularly published newsletters, announcements and continually updated Intranet sites to announce policy changes or bring greater clarity. d. Integrated with Travel and Expense Process A comprehensive procurement strategy would not be complete without inclusion of the Travel and Expense process. Whether using a dedicated Travel card or a multi-use Pcard, best practice trends include the use of an institutional card service as a key tool for travel expense management. Leading procurement programs are developing procurement management strategies which integrate eprocurement, Accounts Payable and card services. Page 39

40 3. Recommendations E. DELIVER SYSTE-WIDE PCARD SERVICE, SUPPORT AND TRAINING for all locations as part a comprehensive support strategy for all procurement platforms (i.e., Pcard, ainestreet arketplace (S), and Travel & Expense). F. ESTABLISH BENCHARKS AND STANDARDS for Pcard issuance and approvals to be administered consistently across the University system. G. RE-BID PCARD SERVICES following a competitive public process to better meet Pcard user requirements and administration and include travel expense management. H. ESTABLISH UNIFIED PCARD ADINISTRATION as part of a comprehensive University systemwide procurement strategy to provide consistent policies and services for all locations with a dedicated support structure. Staff would be located at both campus and system offices with emphasis on ensuring effective campus-based presence. Page 40
41 III. Findings and Recommendations: 3. Structural Resources and Efficiencies (Procurement Organizational Structure) 1. Current State Administrative Review: a. ethodology The administrative review team worked closely with the CFO s of the seven university campuses to determine the positions and FTEs currently involved in procurement activity. First, key procurement activity was divided into four functional areas: procurement card (Pcard), travel and expense, accounts payable and other (includes bid activity for large purchases). Second, each campus CFO was asked to provide a listing of all procurement related positions including the percent of time spent on each of the four functional areas. Third, the results were summarized and plotted on the functional structural chart described below. Finally, during December 2012, the summary information and draft functional chart was verified with each CFO and updates made as needed. The result is the current state functional analysis below (Chart 12). Procurement Current Functional Structure University Personnel Involved in Procurement Activity as of December 2012* FTEs: FY2014 Estimated Cost ~$2.2mm Key Procurement Activity Total University Resources Positions FTE Procurement Card Travel & Expense Accounts Payable Other Total University Resources Total University Resources Total University Resources Total University Resources Positions FTE Positions FTE Positions FTE Positions FTE U Pcard T&E AP Other Total Positions FTE SWS Pcard T&E AP Other Total Positions FTE US Pcard T&E AP Other Total Positions FTE UF Pcard T&E AP Other Total Positions FTE UA Pcard T&E AP Other Total Positions FTE UFK Pcard T&E AP Other Total Positions FTE UPI Pcard T&E AP Other Total Positions FTE U Pcard T&E AP Other Total Positions FTE * Positionl and FTE data provided directly from the campuses in December Does not include procurement related activities for facilities capital construction, book stores, or computer stores Chart 12 Page 41

42 b. Functional Analysis: Positions and FTEs An analysis of current procurement resources reveals a highly decentralized organization with positions and job functions distributed across the enterprise. Currently 45 positions are involved in procurement activity representing FTE allocations with an estimated annual cost of $2.2mm (not including procurement activity for capital construction, campus computer stores and book stores) (Chart 13). Individual procurement functions are often fragmented among many positions with a small percentage of each position s job focused solely on procurement functions. For example, 22 positions have some involvement in Procurement Card administration, but with only 3.96 total FTEs allocated (Table 6). FTE Annual Expense by Function Total: $2.2mm $247,315 $794,530 $852,575 $271,651 Procurement Card Travel & Expense Accounts Payable Other Procurement Chart 13 Table 6 Resources are distributed throughout the seven campuses and the system office with the largest concentration at U in Orono (17 Positions) (Table 7). U also provides Accounts Payable services for the entire enterprise through a shared services model allocating 8.15 FTEs (Accounts Payable process is described below). Campus FTE Allocation for Specific Procurement Activities * Total Total Procurement Travel & Accounts Other Positions FTEs Card Administration Payable Procurement U UF UFK UPI US UA U SWS Totals * Does not include procurement activity for capital construction, campus book or computer stores Table 7 Page 42
43 c. Accounts Payable (AP) The Accounts Payable activity accounts for the largest percentage of resources totaling almost half of all personnel time spent on procurement activities. Accounts Payable is the one procurement area that has successfully been reorganized as a shared services structure providing AP functions for the entire University system. The AP shared services function is physically located at U with 8.15 FTE. In addition to the functions consolidated at U, there are 5.51 FTEs allocated to AP functions outside of U, according to CFOs. d. Data Analysis Data analysis tends to focus on transactional, tactical operational activities such as time for processing an invoice or purchase order. In its 2009 assessment of University procurement practices, the Huron Consulting group found minimal activity around analysis and strategic sourcing efforts and a high reliance on cooperative contracts that may not present the best savings opportunities. With the introduction of the ainestreet arketplace (S) eprocurement system, data analysis is starting to be possible on a product, service or vendor basis. However, because procurement of common products and services is still also occurring via Pcard or on a non-po basis, detailed spend analysis to identify strategic sourcing opportunities continues to be a challenge. Further, because many staff resources are fragmented across the University system, each with a single campus focus, there is limited incentive to understand and analyze data on a University system-wide basis. e. Strategic Sourcing and Analysis Strategic Sourcing refers to a proactive approach to expense management by: - analyzing enterprise spend patterns and the total cost of ownership (TCO) for key products and services, - documenting and prioritizing user requirements for key products and services, - understanding industry and market dynamics for suppliers of key services, and - developing and implementing a strategic approach for competitive bidding and contract negotiations which leverages enterprise spend, TCO components, user requirements and industry dynamics. There is no formal structure in organizational terms and very limited capacity in practical terms to support strategic sourcing at the University. Generally, procurement activity is reactionary and focused on requests from individual campuses. In the existing system procurement office, one position is responsible for competitive procurement activity working on approximately 50 initiatives per year, most campus initiated. With the introduction of the eprocurement system, ainestreet arketplace, the procurement office has been able to proactively secure enterprise pricing and contracts with catalog-based vendors to the benefit of the entire University system. In addition, for some identified key commodities, the University has taken advantage of contracts available through higher education group purchasing organizations (GPOs). However, as reported by Huron Consulting, University procurement operates, and is viewed, as a transactional organization, not a strategic one. Page 43
44 2. Review of Higher Education Best Practices a. Unified Procurement The Education Advisory Board (EAB) research office has profiled two leading higher education procurement programs: the Universities of Colorado and issouri. Both systems successfully transitioned from redundant and inefficient fragmented systems to streamlined and cost-effective unified systems. Reported outcomes include: increased efficiency, improved customer service, and enhanced bargaining power with vendors. Program administrators describe this change as a continuous process, and advise that administrators must constantly strive to improve workflow, contracts, and develop a cohesive system-wide culture. Case Study: University of issouri - 73,000 Students on Four Campus with annual expenses of $2,500mm. In 2000, the University of issouri implemented a major initiative creating a streamlined procurement organization to manage the estimated $205 million in annual spend. At the time of the initiative, issouri had 93 FTEs (110 positions) involved in procurement primarily in transactional roles. Organization goals for the procurement initiative included: - consolidate all procurement activities under the leadership of a Chief Procurement Officer, - establish contract specialists for University-wide contracts, - maintain campus purchasing offices, - transfer certain functions to finance including petty cash and accounts payable, - eliminate central stores and central receiving at all campuses, and - focus organization on improved standardization, policies, and procedures EAB reports that the resulting streamlined organization has enabled significantly improved efficiencies and cost reductions including almost $1 million in operating savings and over $15 million in savings for the cost of goods and services (Table 8). University of issouri Procurement Organization Consolidation Initiative Results: FY2000 to FY 2006 Source: Educational Advisory Board Operating Savings - Positions reduced from 93FTE in FY2000 to 46 in FY Salary and benefit cost savings: Original Estimate: $600,000 -$700,000 Actual Savings: $998,064 Goods and Services Savings Original Estimate: $ million Actual Savings through FY 2006: $15.5 illion Table 8 Page 44
45 b. Focus on Strategy As reported by EAB, a major goal for both the Universities of issouri and Colorado was a cultural shift to make procurement strategy a priority. Prior to streamlining efforts, the focus was primarily on tactical and administrative tasks. This left little time or resources to develop and implement holistic procurement strategies. At the University of issouri, accounts payable and petty cash responsibilities were transferred to the finance office allowing procurement staff to dedicate more time to improving contracts and efficiency, At the University of Colorado, procurement administration and accounts payable were organized as the Procurement Service Center (PSC). A separate Strategic Sourcing Group was created whose four fulltime staff members focus primarily on improving contacts for the university system. Page 45
46 3. Recommendations A. TRANSITION TO A UNIFIED STRATEGIC PROCUREENT ORGANIZATION operating as a shared system-wide service reporting to the Chancellor or the Chancellor s designee and advised by the Shared Services Advisory Council and the President s Council. The organization would consist of three functional units: Procurement Operations, Procurement Services, and Strategic Sourcing with staff located at both campus and system offices with emphasis on ensuring effective campus-based presence (Charts 14 and 15). B. CREATE A PROCUREENT OPERATIONS UNIT within the unified strategic procurement organization responsible for accounts payable, travel and Pcard administration, procurement systems administration, and management of procurement related data. C. CREATE A PROCUREENT SERVICES UNIT within the unified strategic procurement organization to provide consistent, system-wide training and support, coordinate procurement activity for individual campuses, oversee quality assurance and compliance, and conduct special projects as required by legislative and regulatory mandates. D. CREATE A STRATEGIC SOURCING UNIT within the unified strategic procurement organization to facilitate public competitive bids, analyze spend data, develop research and reporting methodologies, establish campus-based advisory groups, monitor supplier performance, and manage contract activity. E. ESTABLISH ASSESSENT PROCESS for each unit defining evaluation criteria and review process for achieving service, efficiency, and expense reduction goals. F. IPROVE ECHANISS FOR EXCEPTION PROCESS AND FEEDBACK that provide flexibility for unique requirements and create a better process for incorporating suggestions from shoppers about goods or services where they believe additional savings could be obtained. Page 46

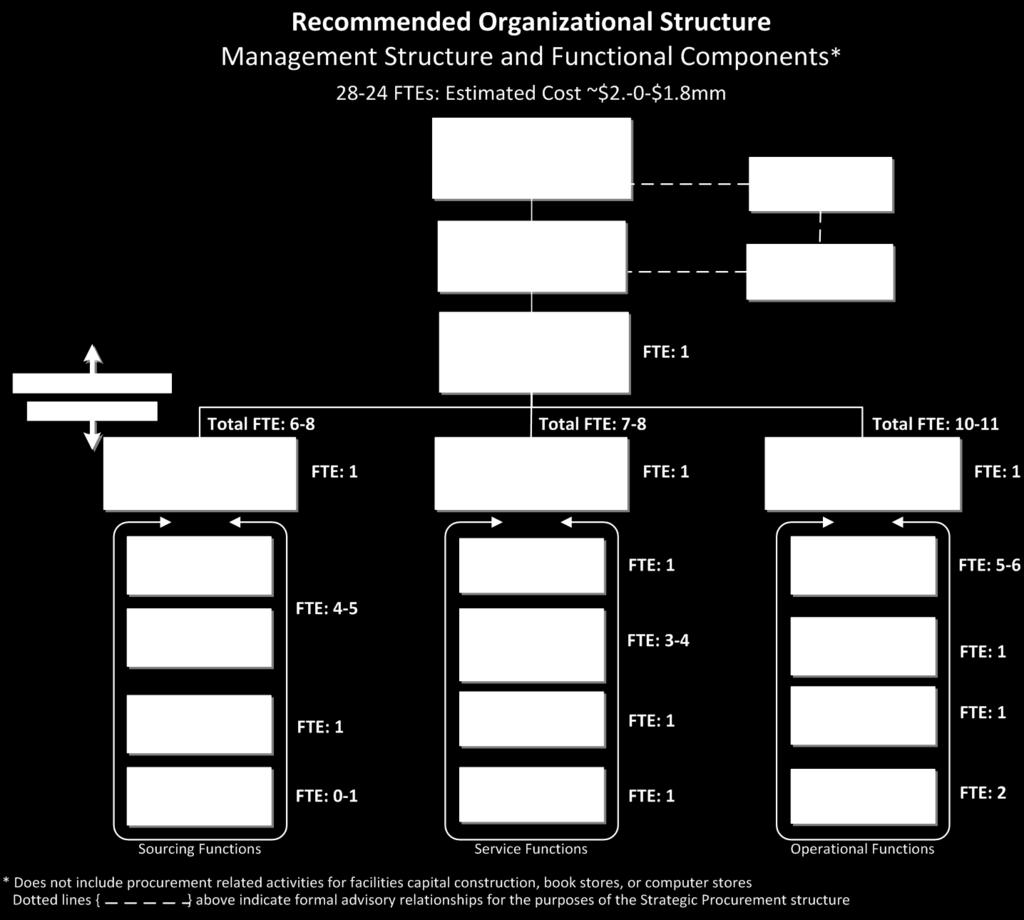


47 Chart 14 Chart 15 Page 47
48 IV. Financial Impact 1. ethodology The financial impact as summarized in the Table 9 was derived by estimating three components for each focus area section: 1. Current costs or baseline 2. Future costs 3. Investment: both one time and ongoing. Net savings was then calculated by comparing future to baseline costs and subtracting investment for fiscal years Calculations were done in constant dollars with no adjustments for inflation. Whenever possible, historic spend data was utilized to inform estimates. In some cases, experience from other universities was used as a guideline. The team understands that a significant percentage of University funding comes from restricted funds such as grants. While process improvements and cost saving will benefit these programs, they are often closed loops so those benefits remain with the grant-funded program. In order to account for this and in an effort to avoid overestimating savings, three years of spend data was reviewed to estimate the historic breakdown of restricted versus unrestricted funding. This breakdown was then applied when calculating savings so that savings from programs with restricted funds are shown separately. 2. Focus Areas 1. Procurement of goods and services a. Travel and Expense Historical spend from accounts payable was used for estimating the baseline for travel. This was then adjusted to remove any spend that was not considered addressable or likely to be impacted by procurement initiative. For example, an estimate for annual millage reimbursement was removed from the baseline as the reimbursement rate is not something procurement can impact. Investment costs include estimates for engaging a travel management company, implementing a travel and expense reimbursement system, and the cost of running a public competitive bid process which includes active involvement from an advisory team representing various campus travel groups. The travel and expense reimbursement system cost estimates are made up of one-time costs for implementing the system and on-going operational costs. These estimates came from peer universities who have implemented similar systems and validated with an independent consulting group with experience implementing travel systems. In summary, travel and expense baseline costs for addressable non-restricted funds for FY are estimated at $16 million. The investment required is estimated at $380,000 resulting in gross savings (before investment subtracted) for non-restricted funds of $780,000. Page 48
49 1. Procurement of goods and services b. Commodities and Services / Strategic Sourcing As discussed earlier, specific products and services were identified for strategic procurement and estimates made for baseline spend as described in section III of this report. Savings estimates were based on a very conservative estimate of savings expected for a public competitive bid process. Additional savings were calculated by estimating the total annual addressable spend for the University system at $100 million, which is a conservative percentage of the $180 million being spent currently through ainestreet arketplace. An analysis of restricted versus unrestricted funds was done for FY providing an estimation that 55% of the spend is unrestricted, E&G funds. By creating a dedicated Strategic Sourcing team and utilizing spend analytics; an estimated $13 million of the $100 million baseline is expected to be sourced between FY with a conservative estimated average savings of 6%. This is in addition to projects already identified. Additional savings is estimated for expanding catalog vendors for ainestreet arket place based on internal experience, and peer university experience with similar eprocurement systems. Investment for Strategic Sourcing included an ongoing allocation to support the formation and involvement of multi-campus advisory groups, as well as spend analytic support. In summary, Strategic Sourcing baseline costs for addressable non-restricted funds for FY are estimated at $28 million. The investment required is estimated at $105,000 (not including personnel costs) resulting in gross savings (before investment subtracted) for non-restricted funds of $1.4 million. 2. Procurement Card (Pcard) Administration Pcard baseline spend was estimated by looking at spend history and estimating a continued reduction as Pcard spend migrates to ainestreet arket place. This reduction is expected to begin leveling off by 2016 so the model reflects smaller reductions for each fiscal year. At the same time, Pcard use for travel is expected to increase as the new travel and expense system is implemented, so this increase was factored into the baseline calculation. As Pcard use is standardized, the team s research indicates that there is an opportunity for operation savings by re-bidding the current Pcard contract. Investment costs include system-wide training and support, as well as the cost associated with rebidding the Pcard provider contract. In summary, Pcard baseline costs for addressable non-restricted funds for FY are estimated at $22 million. The investment required is estimated at $32,000 resulting in gross savings (before investment subtracted) for non-restricted funds of $93,000. Page 49
50 3. Structural Resources and Efficiencies (Organizational Structure) Baseline and future costs were calculated using FY2014 fully burdened salary costs. For current costs, expected FY2014 fully burdened salaries were used for current positions as identified by the campus CFO s and validated in December For future costs, a staffing model was developed based on experience of peer universities and FY2014 fully burdened salary rates applied. A transition period during FY was assumed with overlap of the current and future organization models to estimate personnel costs during the transition period. Investment costs include funding for recruitment activity. Human Resource related transition costs were not included in the estimate. In summary, structural baseline costs for addressable non-restricted funds for FY are estimated at $8 million. The investment required is estimated at $372,000 including investment in accounts payable tools for dynamic discounting and resulting in gross savings (before investment subtracted) for non-restricted funds of $1.5 million. TOTAL FY2013-FY2016 Recommendation Focus Areas Spend Investment Gross Savings Total Net Savings E&G Non-E&G One-Time On-Going Total E&G Non-E&G Total (less Investment) 1 Procurement of Specific Goods and Services A Travel and Expense a Comprehensive Assessment $ - $ - $ 10,000 $ - $ 10,000 $ - $ - $ - $ (10,000) b1 Travel anagement Company $ 16,351,120 $ 15,472,880 $ 50,000 $ - $ 50,000 $ 618,277 $ 585,068 $ 1,203,345 $ 1,153,345 b2 Travel & Expense Reimbursement System $ - $ - $ 60,000 $ 262,553 $ 322,553 $ - $ - $ - $ (322,553) c Contracts with Preferred Providers $ - $ - $ - $ - $ - $ 161,876 $ 153,182 $ 315,058 $ 315,058 d Update T&E APL Practice Letter $ - $ - $ - $ - $ - $ - $ - $ - $ - e Unified Travel Administration $ - $ - $ - $ - $ - $ - $ - $ - $ - $ 16,351,120 $ 15,472,880 $ 120,000 $ 262,553 $ 382,553 $ 780,153 $ 738,250 $ 1,518,403 $ 1,135,850 B Other Commodities and Services / Strategic Sourcing a ulti-campus Advisory Groups $ - $ - $ 30,000 $ - $ 30,000 $ - $ - $ - $ (30,000) b Spend Analytics ethodology/tools $ - $ - $ 75,000 $ - $ 75,000 $ - $ - $ - $ (75,000) c Contract anagement System / Process $ - $ - $ - $ - $ - $ - $ - $ - $ - d Competitive Public Bids: $ - $ - $ - $ - $ - $ - $ - $ - $ - d1 Electricity $ 1,402,500 $ 1,147,500 $ - $ - $ - $ 41,250 $ 33,750 $ 75,000 $ 75,000 d2 IT Hardware $ 4,950,000 $ 4,050,000 $ - $ - $ - $ 165,000 $ 135,000 $ 300,000 $ 300,000 d3 Custodial Paper Good $ 825,000 $ 675,000 $ - $ - $ - $ 38,500 $ 31,500 $ 70,000 $ 70,000 d4 Scientific Equipment $ 825,000 $ 675,000 $ - $ - $ - $ 11,000 $ 9,000 $ 20,000 $ 20,000 d5 Commercial Print $ 1,650,000 $ 1,350,000 $ - $ - $ - $ 66,000 $ 54,000 $ 120,000 $ 120,000 d6 Temporary Employment $ 165,000 $ 135,000 $ - $ - $ - $ 4,400 $ 3,600 $ 8,000 $ 8,000 d7 Books / Periodicals $ 4,950,000 $ 4,050,000 $ - $ - $ - $ 16,500 $ 13,500 $ 30,000 $ 30,000 d8 Vehicle Services and Parts $ 165,000 $ 135,000 $ - $ - $ - $ 2,750 $ 2,250 $ 5,000 $ 5,000 d9 Prospect Lists $ 165,000 $ 135,000 $ - $ - $ - $ 2,750 $ 2,250 $ 5,000 $ 5,000 d10 Vehicles $ 1,485,000 $ 1,215,000 $ - $ - $ - $ 34,650 $ 28,350 $ 63,000 $ 63,000 d11 Shipping $ 220,000 $ 180,000 $ - $ - $ - $ 37,400 $ 30,600 $ 68,000 $ 68,000 d12 Sourcing Other Opportunities $ 7,150,000 $ 5,850,000 $ - $ - $ - $ 610,500 $ 499,500 $ 1,110,000 $ 1,110,000 e Expand ainestreet arket Place $ 4,209,005 $ 3,443,731 $ - $ - $ - $ 357,765 $ 292,717 $ 650,483 $ 650,483 $ 28,161,505 $ 23,041,231 $ 105,000 $ - $ 105,000 $ 1,388,465 $ 1,136,017 $ 2,524,483 $ 2,419,483 2 Procurement Card (Pcard) Administration a System-Wide Pcard Service, Support, Training $ - $ - $ 30,000 $ - $ 30,000 $ - $ - $ - $ (30,000) b Pcard Benchmarks and Standards $ 22,386,119 $ 19,428,447 $ - $ - $ - $ 70,649 $ 57,803 $ 128,452 $ 128,452 c Re-bid Pcard Services $ - $ - $ 2,000 $ - $ 2,000 $ 22,236 $ 19,404 $ 41,640 $ 39,640 d Unified Pcard Administration $ - $ - $ - $ - $ - $ - $ - $ - $ - $ 22,386,119 $ 19,428,447 $ 32,000 $ - $ 32,000 $ 92,885 $ 77,207 $ 170,092 $ 138,092 3 Structural Resources and Efficiences (Org Structure) * a Unified Org $ 7,995,687 $ - $ 61,290 $ - $ 61,290 $ 894,643 $ - $ 894,643 $ 833,353 b Procurement Operations Unit $ - $ - $ 46,000 $ 264,480 $ 310,480 $ 647,351 $ 529,650 $ 1,177,001 $ 866,521 c Procurement Service Unit $ - $ - $ - $ - $ - $ - $ - $ - $ - d Strategic Sourcing Unit $ - $ - $ - $ - $ - $ - $ - $ - $ - e Assessment Process $ - $ - $ - $ - $ - $ - $ - $ - $ - f Exception and Feedback Process $ - $ - $ - $ - $ - $ - $ - $ - $ $ 7,995,687 $ - $ 107,290 $ 264,480 $ 371,770 $ 1,541,994 $ 529,650 $ 2,071,644 $ 1,699,874 GRAND TOTALS $ 74,894,431 $ 57,942,558 $ 364,290 $ 527,033 $ 891,323 $ 3,803,497 $ 2,481,124 $ 6,284,621 $ 5,393,298 * Does not reflect HR related transition costs Table 9 Page 50
51 V. Implementation Planning 1. ethodology and Guiding Principles In general, development of a detailed implementation plan is the next step in this process following approval to proceed. The foundation of the draft implementation plan (table 10) is built on the following key guiding principles. A. The project will continue to follow the four phase project methodology: I. Analyze and Evaluate; II. Design & Develop; III. Implement; and IV. easure & Audit, and repeat. B. Implementation planning and execution will require and actively recruit participation and involvement from stakeholders including campus presidents and their designees. C. Implementation roll-out strategies will utilize pilot groups and a phased approach whenever possible and practical. D. Extensive training and support will be offered throughout the implementation process and beyond. E. easurement and audit criteria and methods will be developed as part of the implementation process and with a focus on three key metrics: 1. cost savings; 2. non-fiscal performance; and, 3. customer service. 2. Focus Areas 1. Procurement of goods and services a. Travel and Expense The team recognizes the wide range of travel requirements across the enterprise including travel groups with restricted funding sources. Therefore, the implementation strategy begins with a comprehensive assessment to identify and document requirements for all travel groups and locations. This assessment will serve as the basis for any competitive public bid and evaluation of proposed travel and expense products and services. The assessment will also inform the creation of exception policies to ensure flexibility for any identified requirements that are not easily accommodated with the new travel systems. The implementation phase anticipates starting with an initial pilot group and then rolling-out the new system on a campus by campus basis in consultation with the campus Presidents and their designees. Page 51
52 Robust training and support is integral to implementation activity and will be a key evaluation criterion for selecting travel related vendors. This was reinforced by feedback from travelers. As highlighted in the implementation time line, the comprehensive assessment and competitive bid process will occur throughout the remainder of FY 2013 and into Q1 of FY Travel and exception polices will be developed in parallel leveraging the knowledge gained from the assessment and bid process. The phased roll-out of new systems is expected to occur throughout the reminder of FY2014 and all of FY 2015 with full enterprise transition completed by FY Procurement of goods and services b. Commodities and Services / Strategic Sourcing The team recognizes that significant subject matter expertise already exists throughout the University System for many of the identified strategic sourcing opportunities. Therefore, the team proposes creating multi-campus based advisory groups for key spend categories to assist in developing requirements, evaluating competitive bid proposals, selecting vendors and suppliers, and advising the Strategic Sourcing team on industry developments and opportunities. The goal of the Strategic Sourcing group is to develop core competencies for the sourcing process (spend analytics, competitive bidding strategies, contract negotiation and vendor management) in partnership with existing campus and system based content expertise. The implementation time line lays out a strategy for sourcing the portfolio of identified sourcing opportunities and takes into account numerous factors including resource availability, existing contract time frames, initiative complexity, and savings opportunities. 2. Procurement Card (Pcard) Administration Implementation activity will initially be focused on fully documenting the user requirements for Pcard across the enterprise in collaboration with the campus Presidents and their designees. The goal is to clearly define the role of Pcard in context with a holistic procurement strategy that includes travel and expense payments and ainestreet arketplace, and balances the need for flexibility with the objectives for cost savings and operational efficiency. This comprehensive assessment then becomes the basis for establishing Pcard enterprise benchmarks and standards, developing system-wide training and support, and for conducting a competitive bid process for Pcard services. As outlined in the time line, the team anticipates that assessment, benchmarking and competitive bidding activity will take most of FY 2014 with a comprehensive enterprise Pcard policy in place by FY Structural Resources and Efficiencies (Organizational Structure) The transition to a unified strategic procurement organization is key for achieving operational excellence, cost savings and customer satisfaction. The success of the organization requires that it engage users, provide high-quality service, and seek campus participation and ongoing involvement. The goal is to leverage the exceptional people and work that already exists throughout the enterprise Page 52
53 under a unified structure that delivers a better product at a lower cost. To accomplish this, the new organizational structure creates three units with focused competencies for procurement operations, procurement support and training, and strategic sourcing. The specific transition strategy and details will be developed by a transition team which will include the new position of Chief Procurement Officer, the campus Presidents and their designees, the Chancellor and his designees, and HR as required to ensure a smooth transition that provides opportunities and fairness for all participants. The transition plan will also strive to identify existing non-procurement functions and job responsibilities that need to be covered so that resources are not inadvertently removed without an agreed transition plan and adequate coverage. In addition to developing a collaborative transition strategy, the management team will be tasked with developing measurement and audit criteria for each new unit focused on the three key metrics: 1. cost savings; 2. non-fiscal performance; and, 3. customer service. Developed in consultation with the Presidents Council and the Shared Services Advisory Council, these metrics will provide the basis for tracking and reporting on progress as the new organization matures. To facilitate a smooth, collaborative transition, the timeline calls for first filling the new CPO position and a few key leadership roles to assist in developing the transition plan with the campus Presidents and their designees. Transition activity is anticipated to take all of FY2014 with some overlap in positions with funds allocated to cover the overlap. The new structure is expected to be fully in place by FY2015. Page 53
54 Recommendations Implementation Time Line Recommendation Focus Areas 1 Procurement of Specific Goods & Services A Travel and Expense a Comprehensive Assessment b1 Travel anagement Company b2 Travel & Expense Reimbursement System c Contracts with Preferred Providers d Update T&E APL Practice Letter e Unified Travel Administration B Other Commodities and Services / Strategic Sourcing a ulti-campus Advisory Groups b Spend Analytics ethodology/tools c Contract anagement System / Process d Competitive Public Bids: d1 Electricity d2 IT Hardware d3 Custodial Paper Good d4 Scientific Equipment d5 Commercial Print d6 Temporary Employment d7 Books / Periodicals d8 Vehicle Services and Parts d9 Prospect Lists d10 Vehicles d11 Shipping d12 Sourcing Other Opportunities e Expand ainestreet arket Place 2 Procurement Card (Pcard) Administration a System-Wide Pcard Service, Support, Training b Pcard Benchmarks and Standards c Re-bid Pcard Services d Unified Pcard Administration 3 Structural Resouces and Efficiences (Org Structure) a Unified Org b Procurement Operations Unit c Procurement Service Unit d Strategic Sourcing Unit e Assessment Process f Exception and Feedback Process FY2013 Q1 Q2 Q3 Q4 Q1 Q2 Q3 Q4 Q1 Q2 Q3 Q4 Q1 Q2 Q3 Q4 Public Competitive Bid Process Implementation Activity Transition Activity New System / Process in Place FY2014 Legend FY2015 Bid / Contract process ongoing Continuous Improvement FY2016 Table 10 Page 54
55 VII. Appendices 1. Administrative Review Team and Working Groups Administrative Review Team Sponsor: Trustee Karl Turner Chip Gavin US Richard Campbell US Kevin Carr US ichael Noblet - U John urphy UFK Project Support: Dave Stevens - Organizational Effectiveness Rudy Gabrielson - Project Coordination Kevin Carr, US Chip Gavin, US Stephanie LeBlanc, UF Travel and Expense Working Group Group Lead: Dick Campbell, US Paulette Newcomb, UA Claire Strickland, U Procurement Card (Pcard) Working Group Group Lead: Kevin Carr, US Nina Adams, US Leota Arsenault, U Susan Cota, US Sharon Nadeau, UF Kim oody, UA Page 55
56 VII. Appendices 2. Resource aterial 1. Internal University of aine System (US) Documents a. Board of Trustees Goals and Actions; 01/23/2012 b. Across US; 07/02/2012 c. Administrative Review Team for August 2012 Update; 09/03/2012 d. Administrative Review Team for September 2012 Update; 10/05/2012 e. US Administrative Practice Letter: Travel and Expense Procedures IV-B; 11/04/09 f. US Administrative Practice Letter: Purchasing Procedures VII-A.2; 09/07/2012 g. US Administrative Practice Letter: Procurement Standards of Conduct VII-B; 10/09/2012 h. US Administrative Practice Letter: Purchasing Cards VII-C; 09/01/2012 i. AP Shared Services Successes and Lessons; 08/07/ Source aterial from Other Universities a. University Reports and Presentations i. University of California Berkeley: Achieving Operational Excellence Final Diagnostic Report; April 2010 ii. State University of NY: Campus Alliance Networks; 10/04/2011 iii. University of NC at Chapel Hill: Cost Diagnostic: Final Report Summary; July 2009 iv. University of issouri System: Building a Function; 2007 v. University of Colorado: anaged Travel Program; 2012 vi. Harvard University: Procure-to-Pay Guide b. Procurement Organization Charts i. University of issouri Systems ii. University of Colorado iii. University of North Dakota iv. University System of New Hampshire v. Indiana University c. Travel and Expense RFP Documents i. Indiana University: Online Booking ii. Salem State (assachusetts): Travel Provider Services iii. University of emphis (Tennessee): Travel Agency Services iv. Embry-Riddle Aeronautical University: Travel Services v. University of Connecticut: Travel anagement Agreement 3. Consulting Reports for University aine System (US) a. Huron Consulting Group: US ROI Analysis 02/08/2013 b. Huron Consulting Group: US ROI Analysis; 01/25/2012 c. Scott adden anagement Consultants: US Accounts Payable Function; 02/2010 d. Huron Consulting Group: US Procurement Assessment and Spend Analysis; 03/18/2009 Page 56
57 e. Oracle Insight: Leveraging Foundational Components to Establish a Lean Operating odel at the University of aine System; 02/25/ Analyst Reports, White Papers and Presentations a. Education Advisory Board: Sourcing University Travel: Strategies for Reducing Costs; 06/22/2010 b. Education Advisory Board: Transitioning to an Electronic Travel and Expense anagement System; 2011 c. Education Advisory Board: Disciplining University Spend; 2009 d. Education Advisory Board: Benchmarking University Procurement and Travel Card Programs; 2012 e. Education Advisory Board: within a University System; December 2012 f. Education Advisory Board: Procurement Practices: Organizational Structure, E-Procurement and P-Card management at Canadian Universities: 05/13/2010 g. Travel and Expense Systems Higher-Ed User Group: FY2012 Survey; 2012 h. Aberdeen Group: T&E Expense anagement A Solution Selection Guide; 09/2012 i. Aberdeen Group: B2B Collaboration No Longer Optional; 05/2012 j. Aberdeen Group: AP Invoice management in Networked Economy; 05/2012 k. Aberdeen Group: E-Procurement: Trails and Triumphs; 10/2007 l. Aberdeen Group: The E-Payables Benchmark Series Electronic Payments and Fraud Prevention; 06/2008 m. Aberdeen Group: The E-Payables Benchmark Series Driving Year-over-Year Superior Performance; 08/2008 n. Aberdeen Group: The E-Payables Benchmark Report Advancing Accounts Payable Automation; 03/2007 o. Aberdeen Group: The Purchasing Card Benchmark Paper or Plastic?; 08/2007 p. Association of Public and Land-grant Universities: Results of a Survey on the Impact of the Financial crisis on University Campuses; 11/2009 q. Delta Cost Project: Trends in College Spending ; 2011 r. Booz & Company: Procurement s New Operating odel; 2009 s. Accenture: State of North Carolina Procurement Transformation Organizational odel; 03/11/2011 t. Efficio: Structures for Success Organizing Procurement to Deliver Results; 2007 u. HC Works: 2011 Survey Results Indirect Services Procurement; 05/2012 v. Corporate Partner Advisory Group: The State Purchase Card: Uses, Policies and Best Practices; 02/2007 w. RPG Research Corporation: 2011 Corporate Travel Card Benchmark Survey Results; 2011 x. RPG Research Corporation: 2012 Purchasing Card Benchmark Survey Results; News Articles a. Inside Higher Ed: Leaner eaner State U; 10/01/2012 b. Inside Higher Ed: State Budgets in Context: 03/09/2011 c. Inside Higher Ed: Where Universities Can Be Cut: 09/11/2011 Page 57
58 d. Boulder Colorado DailyCamera.com: University of Colorado Changes Travel Policy to Save oney; 03/22/ Vendor White Papers and Presentations a. Concur: Temple University Case Study for Travel and Expense anagement; 2011 b. Enporion and Sourcing Innovation: Integrated End-to-end E-Procurement; 05/2008 c. JPorgan: Auditing and Compliance Strategies for a Solid Purchasing Card Program; 2008 d. Xerox: Organizing for Sourcing Excellence Insights for Impact on Savings and Performance; 2012 e. Hackett Group and SciQuest: Supplier Relationship anagement and Contract Compliance; 2012 f. PhoCus Wright and Concur: The Next Generation of Business Travel; 2011 g. BCD Travel: Changing the DNA of anaged Travel; 2010 h. Tobaz International and Hurley Travel: The Truth about Finding the Lowest Airfare i. BCD Travel: One Size Fits All? Consolidating Your Travel Program; 2009 j. Hurley Travel Experts: Benefits of a anaged Travel Program; 08/14/2012 Page 58

59 VII. Appendices 3. Emerging Recommendation Survey Results Survey Background - The survey on emerging recommendations was posted from February 1 until February 13, A total of 243 individuals responded to the survey. - Details from the survey in the following analysis include charts and open ended responses. Page 59


60 Page 60 Administrative Review:


61 Page 61 Administrative Review:


62 Page 62 Administrative Review: