ERP in Manufacturing in Cindy Jutras Vice President and Group Director Aberbeen Group
|
|
|
- Ada Cannon
- 5 years ago
- Views:
Transcription

1 ERP in Manufacturing in 2008 Cindy Jutras Vice President and Group Director Aberbeen Group AberdeenGroup 2008

2 Aberdeen Benchmark Survey Structure o o o o Aberdeen PACE Model o o o o Pressures Actions Capabilities Enablers Strategies and Tactics KPIs Usage and Specifics Follow-up Surveys interviews 2 AberdeenGroup 2008
3 2008 ERP in Manufacturing Respondent Demographics (1436 respondents) Revenue Geographies Large (Over $1 billion), 17% Midsize ($50 million to $1 billion), 41% Small (Under $50 million), 42% Asia/Pacific, 14% South/ Central America, 3% Europe, 13% Middle East & Africa, 2% North America, 68% 3 AberdeenGroup 2008
4 2008 ERP in Manufacturing Maturity of ERP Implementations 2007 Planning to implement 8% No ERP, 13% >15 years, 13% < 2 years, 11% 2-5 years, 13% 5-7 years, 10% >15 years, 6% years, 12% No ERP, 14% 2008 < 2 years, 16% 2-5 years, 18% years, 16% 7-10 years, 15% 8-10 years, 18% 5-8 years, 17% Average Age: 9 years Average Age: 7 years 4 AberdeenGroup 2008
5 2008 ERP in Manufacturing ERP Across the Distributed Enterprise 5 AberdeenGroup 2008


6 2008 ERP in Manufacturing Business Drivers Impacting ERP 6 AberdeenGroup 2008
7 2008 ERP in Manufacturing Strategic Actions of Best-in-Class Standardize & accelerate manufacturing processes Standardize & accelerate non-manufacturing processes 50% 53% 46% 50% 52% 61% Provide visibility to business processes across functions & departments 48% 56% 66% Optimize use of current capacity Rationalize/consolidate disparate enterprise applications Link global operations to improve interoperability and collaboration Centralize selected functions using shared services 30% 26% 24% 30% 21% 15% 24% 25% 23% 41% 43% 49% Best-in-Class Industry Average Laggard 0% 10% 20% 30% 40% 50% 60% 70% 7 AberdeenGroup 2008
8 2008 ERP in Manufacturing Best-in-Class Criteria Definition of Maturity Class Best-in-Class: Top 20% of aggregate performance scorers Industry Average: Middle 50% of aggregate performance scorers Laggard: Bottom 30% of aggregate performance scorers Mean Class Performance 21% reduction in inventory levels 97% inventory accuracy 3.3 days to close a month 96% manufacturing schedule compliance 97% complete and on-time shipments 12% reduction in inventory levels 91% inventory accuracy 5.5 days to close a month 89% manufacturing schedule compliance 91% complete and on-time shipments 5% reduction in inventory levels 83% inventory accuracy 7.2 days to close a month 76% manufacturing schedule compliance 82% complete and on-time shipments 8 AberdeenGroup 2008
9 Characteristics of Best-in-Class ERP Use more modules and functionality Manufacturing operations are integrated and coordinated with service, logistics and delivery organizations Line of Business owns the success of ERP 70% have standardized enterprise-wide implementation Measure KPIs and improvement More likely to stay current 9 AberdeenGroup 2008
10 Three Year Trends in ERP installations ERP Usage: Technology Average of 10.5 modules implemented 1 63% of available functionality deployed 27.6% weighted average usage of ERP Average of 10.5 modules implemented 1 71% of available functionality deployed 31.2% weighted average usage of ERP Average of 10.7 modules implemented 1 73% of available functionality deployed 32.5% weighted average usage of ERP 10 AberdeenGroup 2008
11 The Competitive 2008 ERP installation Best-in-Class Average Laggards ERP Usage: Technology Average of 12.1 modules implemented 1 81% of available functionality deployed 40.8% weighted average usage of ERP Average of 10.9 modules implemented 1 72% of available functionality deployed 32.6% weighted average usage of ERP Average of 10.3 modules implemented 1 71% of available functionality deployed 30.6% weighted average usage of ERP 11 AberdeenGroup 2008
12 2008 ERP in Manufacturing Release Status Best-in-Class Industry Average Laggard 40% 36% 37% 30% 31% 28% 28% 28% 25% 20% 17% 19% 19% 17% 15% 10% 0% Implemented on latest release One release behind Two releases behind Three or more releases behind 12 AberdeenGroup 2008
13 2008 ERP in Manufacturing Reasons for Delaying Upgrades Current release satisfies our needs Customizations make upgrading cost prohibitive 35% 46% 45% 50% 51% 50% Not enough new features to build a solid business case 36% 46% 47% Uncertainty over quality of new release 25% 35% 51% Upgrade process is too long & hard- we skip one or more but eventually catch up Budget / cash flow issues 33% 37% 32% 33% 32% 52% Large Midsize Small 0% 30% 60% 13 AberdeenGroup 2008
14 2008 ERP in Manufacturing Business Value Gained from Upgrades Supported business needs or eliminated workarounds Automated previously manual processes Streamlined processes 34% 33% 37% We have not upgraded in the last 3 years Eliminated the need for a separate business application Eliminated customizations Facilitated integration to a separate business application 15% 18% 22% 31% None 11% 0% 20% 40% 14 AberdeenGroup 2008
15 2008 ERP in Manufacturing Best-in-Class Criteria Definition of Maturity Class Best-in-Class: Top 20% of aggregate performance scorers Industry Average: Middle 50% of aggregate performance scorers Laggard: Bottom 30% of aggregate performance scorers Mean Class Performance 21% reduction in inventory levels 97% inventory accuracy 3.3 days to close a month 96% manufacturing schedule compliance 97% complete and on-time shipments 12% reduction in inventory levels 91% inventory accuracy 5.5 days to close a month 89% manufacturing schedule compliance 91% complete and on-time shipments 5% reduction in inventory levels 83% inventory accuracy 7.2 days to close a month 76% manufacturing schedule compliance 82% complete and on-time shipments 15 AberdeenGroup 2008


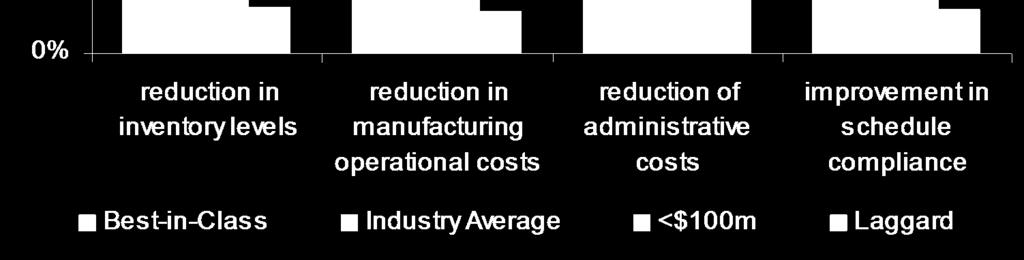
16 2008 ERP in Manufacturing Results 16 AberdeenGroup 2008
17 Shifting Sands of Globalization Strategies: Building a Firm Foundation with Enterprise Applications Given the current economic climate.. AberdeenGroup 2008
18 Globalization Strategies Business Drivers Impacting Globalization Strategies Introduction of low cost competition Opportunity to exploit new markets Rising energy costs Weakening U.S. dollar Customers demand for improved customer service Need to reduce time from order to fulfillment 22% 21% 20% 17% 14% 41% 36% 39% 33% 31% 31% Best-in-Class All Others 30% 0% 10% 20% 30% 40% 50% 18 AberdeenGroup 2008
19 Globalization Strategies How Global are You? We procure raw material or components from international sources We sell internationally We have operating locations in foreign countries 65% 73% 71% We currently operate entirely domestically today and have no plans to globalize 13% We currently operate entirely domestically Today but are planning global expansion 5% 0% 20% 40% 60% 80% % All respondents 19 AberdeenGroup 2008


20 Globalization Strategies Planned versus Actual Globalization 20 AberdeenGroup 2008
21 Globalization Strategies Best-in-Class Criteria Definition of Maturity Class Best-in-Class: Top 20% of aggregate performance scorers Industry Average: Middle 50% of aggregate performance scorers Laggard: Bottom 30% of aggregate performance scorers Mean Class Performance 18% increase in Revenue year over year 27% of growth is from new international markets Achieved 75% of plan for growth from new international markets Achieved 85% of planned cost reduction 96% Complete and On-time shipments 10% increase in Revenue year over year 20% of growth is from new international markets Achieved 46% of plan for growth from new international markets Achieved 39% of planned cost reduction 91% Complete and On-time shipments 4% increase in Revenue year over year 9% of growth is from new international markets Achieved 22% of plan for growth from new international markets Achieved 16% of planned cost reduction 79% Complete and On-time shipments 21 AberdeenGroup 2008
22 Globalization Strategies Significance of Challenges rated on a scale of 1 to Increased supply chain complexity 3.7 Assuring quality from suppliers/partners 3.7 Increased business risk 3.7 Cost savings eroded by transportation costs 3.6 Lead times inhibit ability to meet demand 3.5 Difficulty in protecting IP 3.4 Lack of Visibility into supply chain 3.3 Preservation of Brand Equity 3.2 Trade-offs velocity and landed cost 22 AberdeenGroup 2008
23 Globalization Strategies Strategic Actions of Best-in-Class Identify and secure low cost labor or material sources Localize/regionalize operations (closer to the customer) Centrally manage operations to provide flexibility to balance speed of delivery and cost effectiveness Strengthen controls across global operations Establish deeper understanding of selected emerging markets 27% 24% 32% 31% 36% 31% 33% 43% 43% Best-in- Class 49% All Others 0% 25% 50% 23 AberdeenGroup 2008
24 Globalization Strategies Strategic Actions of Best-in-Class Identify and secure low cost labor or material sources Localize/regionalize operations (closer to the customer) Centrally manage operations to provide flexibility to balance speed of delivery and cost effectiveness Strengthen controls across global operations Establish deeper understanding of selected emerging markets 27% 24% 32% 31% 36% 31% 33% 43% 43% Best-in- Class 49% All Others 0% 25% 50% 24 AberdeenGroup 2008
25 Strategic Actions by Business Drivers Identify and secure low cost labor or material sources Centrally manage operations to provide flexibility to balance speed of delivery and cost effectiveness Localize/regionalize operations (closer to the customer) Strengthen controls across global operations 43% 39% 33% 29% 42% 28% 25% 58% Cost Growth Establish deeper understanding of selected emerging markets 21% 44% 0% 30% 60% 25 AberdeenGroup 2008


26 Globalization Strategies Standardization of ERP 26 AberdeenGroup 2008


27 Globalization Strategies Plans for Standardization 27 AberdeenGroup 2008
28 Globalization Strategies Prioritization of ERP Global Features rated on a scale of 1 to Global consolidation across a multi-site/multi-database implementation 3.8 Multi-site planning 3.7 Multi-site production capabilities 3.7 Multi-site support from a single instance 3.5 Multi-national Inter-plant transfers 3.5 Multi-national outside processing 3.4 Local language end-user support 3.4 Localized version in all locations 3.3 Local language user interface 28 AberdeenGroup 2008
29 2008 ERP in Manufacturing Recommended Actions - Laggards Assign ERP ownership to the line of business executive who stands to gain the most benefit from the implementation Formalize and document current processes Keep current on ERP solution providers' latest releases Don't let divisions go off on their own to choose their own ERP 29 AberdeenGroup 2008
30 2008 ERP in Manufacturing Recommended Actions - Average Evaluate current documented processes, comparing them against functionality and best practices published by the current or proposed ERP solution provider Broaden and deepen use of ERP Take advantage of tools that provide the ability to review summary data and optionally drill down to successive levels of detail Evaluate trade-offs between centrally managed and regional operations 30 AberdeenGroup 2008
31 2008 ERP in Manufacturing Recommended Actions Best-in-Class Centralize selected functions using shared services. This is an important option provided by standardizing common business processes across the enterprise Improve real-time visibility to the entire quote to cash process Align ERP strategy with your globalization strategy 31 AberdeenGroup 2008


32