Dashboard in a Day. Presented by Jacques Goupil
|
|
|
- Muriel White
- 5 years ago
- Views:
Transcription


1 1 October 24 th, 2017 This session is being recorded. For a copy of the slides or today s reporting samples please contact: reporting@ppmworks.com Dashboard in a Day Presented by Jacques Goupil


2 Jacques Goupil, PMP, MCTS, MCP Managing Partner (617) Microsoft Community Leader Award PDD Instructor and Speaker at PMI MN Conference, Project Summit , and Microsoft Project Conference Board Member of the Boston YMCA, and Boston & South Florida MPUG Chapters Lead SME and writer for the MCTS Exam , Managing Projects MPUG Project Online/2010/2013/2016 Certification Instructor Life-long trainer and consultant with strong background in project management, specializing in developing and improving PM processes for clients and training Volunteer with the YMCA, enjoy traveling with family, and training for races PMI member since PPM Works, Inc. All rights reserved. No part of this material may be reproduced, in any form or by any means, without express written permission from PPM Works, Inc.

3 Introduction and Overview of Power BI 5 min Downloading Power BI 10 min Connecting Your Data 10 min Creating Reports & Dashboards 25 min Agenda Question and Answer 10 min 5

4 What do you see? Provided by The Independent What do you see? A duck or a rabbit?

5 Report and Dashboards should be clear and easy to understand We want our Reports to be clear, direct, and to the point and Now -- Easy to Create This test was used to determine how quick your cognitive skills are. The quicker you can see both and switch between then the more creative you tend to be and the easier you can find unique uses for common items. Quick Understanding = Better Decisions + Informed Thinking

6 Why Clients Choose PPM Works Our Philosophy: We believe in honesty, integrity, and dedication our passion for success drives our team. PPM Works core values start with family and health first to provide the most for our clients. Quality of Services are unmatched Trusted Experience Listening comes 1 st Proven Methodology and Templates Competitive Pricing
7 Goals of Today s Session 1. Set up a free Power BI trial 2. Easily attach and connect directly to your data 3. Visualize your project data and analyze it quickly 4. Walk away with your action plan to start creating your dashboards today After today s session - what types of reports will you be able to create? Power BI (new or leverage the Content Pack) Out of the Box Dashboard

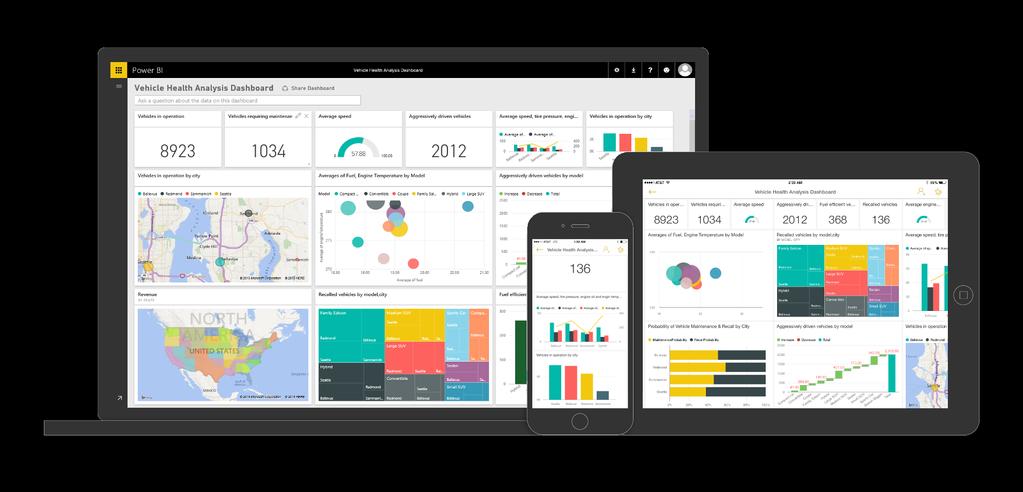
8 Power BI Overview
9 Power BI Desktop Power BI Desktop lets you create a collection of queries, data connections, and reports that can easily be shared with others With Power BI Desktop you can 1. Connect to Data (typically multiple data sources) 2. Shape and Combine Data (queries and data models) 3. Build Report(s) 4. Share Your Work 12


10 Building Blocks of Power BI There are 5 basic building blocks of Power BI: Visualizations visual representation of data such as a chart or graph Datasets - a collection of data that you import or connect to Dashboards combination of reports on a single page that can be shared Reports are one or more pages of visualizations that come from a single dataset Tiles a single visualization found in a report or on a dashboard 13

11 Download Power BI

12 15 Download Power BI Desktop


13 16 Download Power BI Desktop Select Run download the 64 bit version Click Next Accept the License Agreement Continue clicking through the install wizard

14 Connecting to Project Online Data

15 18 Connecting to Project Online Data Power BI Desktop will launch after installing Log in to Office 365 Select Project to navigate to Project Online by clicking on Project Copy the URL

16 Get Data Select Get Data Scroll down to OData Feed Click Connect 19
17 Get Data You will need to enter in the URL or harvest it from Project Online 1. Paste the URL you copied from Project Online 2. Remove everything after PWA and add _api/projectdata 3. Click OK 20
18 Select the Tables Click on each Table Click load to pull in each available field from the selected tables or Click Edit to select only those fields you want to upload 21

19 Editing the Tables Right click on a Column heading and select Remove other columns Select Choose Columns from the ribbon Select the columns you wish to include 22


20 Apply Query Changes Once all the columns have been selected from the tables Click Close & Apply. 23
21 Table Relationship No need to create relationships between tables, Power BI does that for you. 24


22 Power BI Custom Visuals Download custom visuals for Power BI at 25

23 Download Custom Visuals Select the visual and download 26

24 Import Custom Visuals To import custom visuals: Click on the ellipse Select Import a custom visual 27


25 Building Power BI Reports You are ready to begin building! Select a visualization Select the data for the visualization Change the background color Change the data color Click Image to upload your logo 28


26 Save and Publish To Publish your report: Click Save Click File Publish Select My Workspace Sign in 29
27 Publishing the Report Once published a link to the report will be visible in Reports under the My Workspace section in Power BI 30

28 Create a New Dashboard Pin Tiles to an existing or new dashboard Click on the Pin icon Select New dashboard Give your dashboard a name Click Pin 31

29 Power BI Dashboard Demo

30 Power BI Content Pack
31 Power BI Service The Power BI service is an online Software as a Service (SaaS) offering from Microsoft Power BI displays dashboards that are interactive - created and updated from many different data sources Connects to content packs Enables you to publish reports from Power BI 34

32 Power BI Service and Power BI Desktop Power BI Desktop = Analysts create data connections, models, and reports Power BI Service = Users interact and view Power BI Desktop Reports

33 Power BI Content Pack A content pack is a set of preconfigured visuals and reports on specific sources Enables you to get started quickly Available from SaaS providers Provides Dashboards, Reports, and data models Click on 36

34 Power BI Content Pack Select Services to view all the SaaS providers Select Project Online to view all your project data in pre-configured dashboards and reports 37

35 Power BI Content Pack 38

36 146.03K K K K 39.99K 40.08K 38.84K 40.33K
37


38


39


40


41 Did you know you can add SSRS to a Power BI Dashboard? SQL Server 2016 Reporting Services after Admin integrates Report Server with Azure AD and Power BI
42 PPM Works Power BI Dashboard in a Day : Current Microsoft Project Online/Server 2013 users or plan to migrate to Project Online/Project Server 2013 PPM Works will work with your organization to drive your business intelligence knowledge and understanding with the PPM Works Dashboard in a Day offering. You will learn how to connect Project Online with Power BI and Office 365, through a mentoring and hands on training with your business analysts focuses on how to get started with Power BI. Together we will create a for your organization. Power BI Datasets, Reports, and a Dashboard template Microsoft Power BI and Project Online/Server Upfront Power BI Setup Mentoring Dashboard Session Support Deliverables: ½ day hands on session with 5-10 attendees for hands on lab, demo s and Power BI overview ½ day session prep with you and PPM Works ½ day Power BI Training (optional) Target audience: Business Analyst, Project Online/Server Admins, and BI Professionals interested in using Data Visualizations to improve upon existing business intelligence and broaden access and consumption of actionable insights

43 Report Pack Offering Need Reports? Try our Report Pack. Contact us at for more information. Reporting Tools: SSRS Power BI Custom Development Excel Services

44 49 Question and Answer