Advanced Analytics with Seeq and PI System
|
|
|
- Hope Evans
- 5 years ago
- Views:
Transcription
1 Advanced Analytics with Seeq and PI System From the Seeq Team: Jon Peterson, VP Customers
2 Agenda Seeq Intro Working with the PI System Use Case 1: Heat Exchanger Fouling Demo 1 Use Case 2: Water Hammer Demo 2


3 Seeq Founded May 2013 Funding: Altira Group Second Avenue Partners next47 And various angels About 40 employees 100+ companies


4 OSIsoft and Seeq PI Data Archive PI AF PI Event Frames PI Notifications PI Vision


5 Seeq Architecture Seeq Workbench Seeq Organizer Seeq Server Server Cluster Cloud 1 or Many 10M+ tags Data Stays in PI

6 Asset Framework Yes Seeq supports Asset Framework in analytics and UI Asset Framework Data Reference allows access Seeq from PI
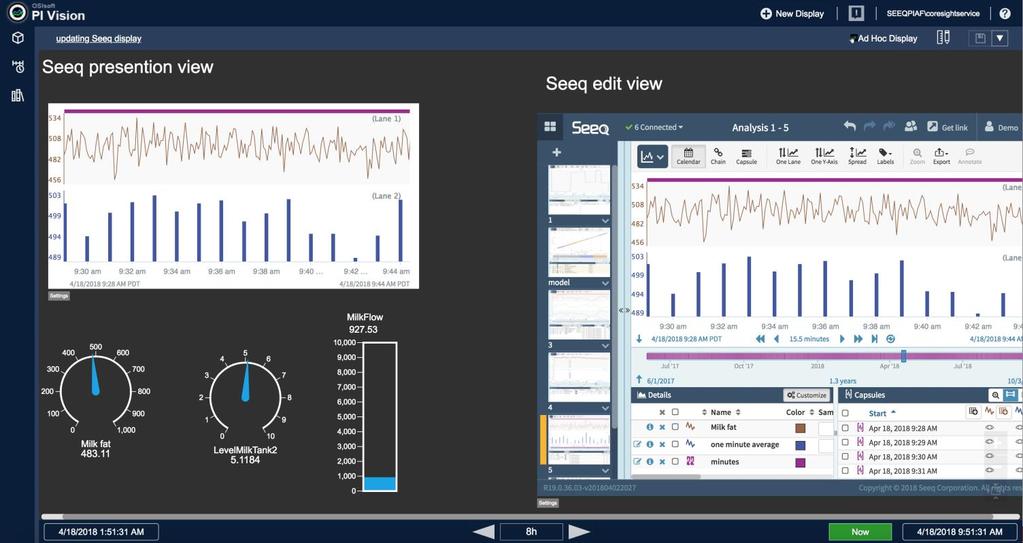
7 PI Vision
8 Event Frames Define by Time Conditions define when a state exists, and each instance of the condition is called an Event Frame, in Seeq a Capsule Define by Limit Define by Pattern


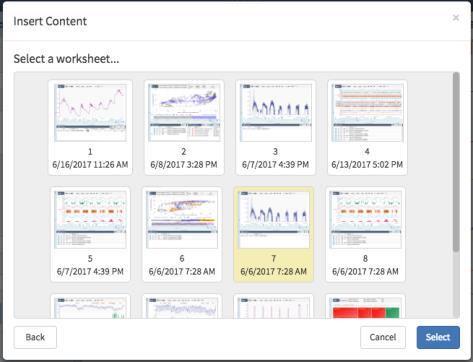


9 Analytics aren t Enough: Publish and Collaborate Insert new content PI Vision

10 Heat Exchanger Fouling
11 Demonstration
12 O&G Asset Reliability Increase COMPANY productivity and GOALof upstream assets and exceed environment and safety requirements. CHALLENGE Oil collection ESD causes pipe hammer which leads to more reliability issues SOLUTION Leverage value search to identify events. Use capsules and event frames to identify RESULTS Focusing on engineering solution results in long term improvements Trip results in rapid valve closure and water hammer Improve system design to avoid water hammer Quantify water hammer duration, amplitude, and decay. Correlate with ESD events Replicate across assets defined in AF Monitor improvements over time & document Reduced production loss, savings of ~$2M/year Less engineering time per event ESD detection is important and will be used to address other issues 12

13 ESD/Water Hammer Want to find turquoise Varying flow ESD Event Pres. Drop after ESD valve closes Want to find this obvious constant frequency, but decaying Not caused by ESD Derivative Positiv slope, and get the max. Amplitude
14 Demonstration
15 Questions Please wait for the microphone before asking your questions Please remember to Complete the Online Survey for this session State your name & company
16 Merci Thank You Grazie Optional: Click to add a takeaway you wish the audience to leave with.
17 Presentation Template Brief A Style Tips and Best Practices document accompanies this template. This template was developed for presenters to insert their company template between the introduction slide and summary slide. One of the slides suggests topics to consider including in your presentation. Feel free to adapt it for your work. Please delete these instruction slides once you build your presentation.
18 Slides and videos must be in 16:9 aspect ratio

19 Conference Theme & Keywords Speaker s Name @company.com Speaker s Title Company Name Speaker s Name @company.com Speaker s Title Company Name
20 Framing slides for you to insert into your deck 20
21 Recommended Flow of Topics in Agenda About Your Company Business Challenge Applications and Use Case / How the PI System was Applied Implementation Details How Individual Product Capabilities Solved Your Business Challenge Results Obtained and Business Impact Other suggested talks/labs/booths/events at the UC Conclusion


22 Example Summary Slide Summary Slide Template is located on the next slide or by creating a new slide and selecting the Summary Slide layout (See end of slide deck for examples)
23 COMPANY and GOAL CHALLENGE SOLUTION RESULTS 23
24 Speaker s Name @company.com Speaker s Title Company Name Speaker s Name @company.com Speaker s Title Company Name
25 Questions Please wait for the microphone before asking your questions Please remember to Complete the Online Survey for this session State your name & company

26 Merci Thank You Grazie Optional: Click to add a takeaway you wish the audience to leave with.

27 Leveraging the PI System in Water Loss Control Operators and planners often relied on estimates rather than real data to do their job COMPANY COMPANY and GOAL AND GOAL Halifax manages water and wastewater for 325,000 people, and wanted to find and reduce leaks in real-time and to reduce main breaks CHALLENGE Non-interoperable systems and fractured information sharing prevented running analytics SOLUTION District Metered Areas and water distribution system data connected to a PI System in real-time, notifying operations of potential leaks and breaks We can see the turbidities and chlorine levels at the plant and also out in the distribution system. That is a beautiful thing RESULTS Save $600,000 / year reducing leaks and reducing average main breaks by 50% in certain areas Able to detect & address big leak of 700 gallons per minute running for 9 hours. Change the company s Infrastructure Leakage Index (ILI) from 9 to


28 Typical Presentation Order of slides