Merrill Lynch U.S. Media Conference
|
|
|
- Theodore Quinn
- 5 years ago
- Views:
Transcription
1 Merrill Lynch U.S. Media Conference John R. Alchin, EVP and Co-CFO 1
2 Safe Harbor Caution Concerning Forward-Looking Statements This presentation contains forward-looking statements within the meaning of the Private Securities Litigation Reform Act of In some cases, you can identify those so-called forward-looking statements by words such as may, will, should, expects, plans, anticipates, believes, estimates, predicts, potential, or continue, or the negative of those words and other comparable words. We wish to take advantage of the safe harbor provided for by the Private Securities Litigation Reform Act of 1995 and we caution you that actual events or results may differ materially from the expectations we express in our forward-looking statements as a result of various risks and uncertainties, many of which are beyond our control. Factors that could cause our actual results to differ materially from these forward-looking statements include: (1) changes in the competitive environment, (2) changes in our programming costs, (3) changes in laws and regulations, (4) changes in technology, (5) adverse decisions in litigation matters, (6) risks associated with acquisitions and other strategic transactions, (7) changes in assumptions underlying our critical accounting policies, and (8) other risks described from time to time in reports and other documents we file with the Securities and Exchange Commission. Non-GAAP Financial Measures Our presentation may also contain non-gaap financial measures, as defined in Regulation G, adopted by the SEC. We provide a reconciliation of these non-gaap financial measures to the most directly comparable GAAP financial measure in our quarterly earnings releases, which can be found on the Financial Information page of our web site at or 2
3 Comcast = Sustainable Growth Delivering Growth with Superior Products and Triple Play Operating a Powerful and Flexible Network -Fiber-rich infrastructure in place today -Capacity to deliver products today and into the future -Multiple tools to optimize network capacity New Product Success Driving Capital Investment Strong Foundation for Growth in 2007 and Beyond 3
4 Triple Play Powers RGU Momentum RGU Net Additions (1) (in millions) A 2004A 2005A 2006A 2007E 2003Q 2004A 2005A 2006A 2007E Triple Play Marketable Homes: % of Homes Passed (2) : 19MM 40% 32MM 68% ~40MM ~85% (1) Additions are reported pro forma and include circuit switched phone sub losses of 171K, 43K, 108K, 335K and 500K, respectively. 2007E reflects Comcast guidance. (2) Amounts are adjusted for acquisitions, primarily Adelphia/Time Warner 4
5 Comcast Triple Play Digital Starter ON DEMAND Interactive Guide 6 Mbps Webmail McAfee Security Unlimited Local and LD 12 Most-Popular Calling Features Voic Three Products: Each $33 Per Month for 12 Months 5


6 The Triple Play Delivers... Value and Convenience Three Superior Products for $99/month One Appointment, One Bill Operational Efficiency Simple to Sell and Install: One Platform Strong Financial Results Lifts Take Rates for Video + HSD Monthly ARPU: $120 - $130 6


7 Digital Video A Superior Video Experience Digital Cable ON DEMAND HDTV DVR 13.3 Million Digital Cable Subscribers 55% of Video Customers 7
8 Digital Strategy: Drive Penetration with More Services Digital Customer Mix (in millions) 13.3MM Customers 5.0 Digital Cable with HD/DVR $75+/month 83% of Digital Customers have Video ARPU of $65/month or Higher 6.0 Digital Cable $65+/month 2.3 1Q07 Digital Starter $50+/month 8
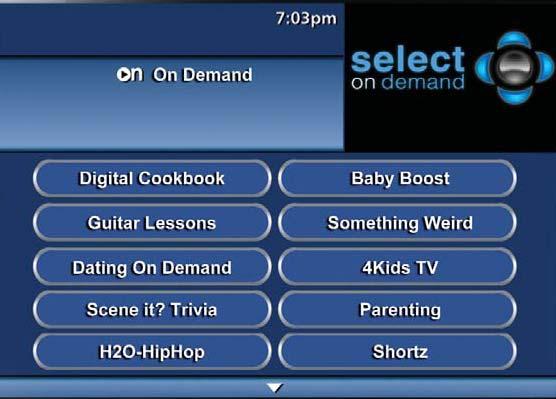
9 Comcast ON DEMAND: A Better Experience More than 4.5 Billion ON DEMAND views since 2004 APR 2004: 38 Million Views APR 2005: 103 Million Views APR 2006: 128 Million Views APR 2007: 219 Million Views 1,700 Programs 3,800 Programs 8,000 Programs 9,000 Programs 9
10 Digital Video: High-Definition Choice. Quality. Value Choices Satellite Customers Agree: Comcast Has the Best HD Choices * Today DIRECTV Today COMCAST Unparalleled Choice... And Picture Quality * 150 national HD channels based on Company Press Releases 10
11 High-Speed Internet: A Better Broadband Experience Record Growth and Stable ARPU Comcast High-Speed Internet Subscribers More Opportunity (in millions) to Grow 12.0 Delivering Value: Speed + Features with Comcast.net % penetration In last 3 years of homes 12MM+ passed Customers Make it a 8.3 Top 10 site 3 Speed 7 out of Increases, 10 Customers plus use PowerBoost Comcast.net 55% (1) 6.4 Video of Rich HSD Experience: growth ~700MM video views in 2006 from DSL 65 New switchers Features in including: Online Security 1Q07 Search Page Views Photo Streaming Sharing Video # 6 Comcast #10 Comcast Streaming #10 Comcast Radio (1) Comscore Market Share: 1Q 2007 (2) Yankee Group Q4, Q04 1Q05 1Q06 1Q07 Source: Neilson/ NetRatings & company research Jan 2007; comscore Video Matrix Dec 2006, comscore, Feb 2007 #1 Residential Broadband Provider (2) in U.S. 11
12 Comcast Digital Voice: Delivering Growth and Value 80% of CDV customers take all three products Marketable Homes: YE06: 32MM YE07: 40MM Ramping CDV Net Additions (in thousands) Q07: 7% penetration (1) Goal: 20-25% by YE Q05 2Q05 3Q05 4Q05 1Q06 2Q06 3Q06 4Q06 1Q07 4 th Largest Residential U.S. Phone Company by YE07 (1) Penetration of homes passed 12
13 Room to Grow 100% 50% 55% 26% 0% Penetration (1) 13.3MM DIGITAL VIDEO 12.1MM HSD 2.4MM Product Sell-in ~80% ~55% ~35% Rate CDV (1) Rates are of available homes except for digital video which represents penetration of basic customers 7% 13
14 A New Growth Opportunity: Business Services Customers in Footprint (in millions) Underserved Market 5 million businesses Annual Revenue Potential Natural Extension of our Network and Services (2006 $ in billions) Proven Business Model $0 $2 1Q06 $4 $12-15 billion revenue potential $6 2Q06 $8 $10 3Q06 Number of Employees $12 $14 4Q $16 $18 Our Focus: Companies < 20 Employees FY06 14

15 Significant Prospects for Growth: Business Services Capture 20% of the SMB Market in 5 Years Capex: $250MM in 2007 ~$3Bn+ over 5 years Overall Returns: ROI 25%+ Revenue: $2.5 Bn 50%+ OCF Margins Revenue Revenue $250MM OCF 2006A 2007E 2008E 2009E 2010E 2011E 15
16 Success Drives Capital Investment 75% of Capex is Variable and Revenue Driven Cable Capital Expenditures by Category Investments for Growth Capex Increase: ~$1.1Bn Commercial Services Acquired Systems CDV, VOD, Digital Simulcast ~$250MM ~$150MM $4.0Bn $4.6Bn $5.7Bn 2005A 2006A 2007E New Service Offerings Maintenance Upgrade Commercial Growth in RGUs / HD-DVR and Capacity for New Services and Enhancements ~$700MM CPE: Installation + Equipment (CDV, HD/DVR) Switched Digital, Node Splits More speed, HDTV, VOD Incremental Returns on Variable Capex Exceed 30% Note: 2005 and 2006 amounts shown pro forma for acquisitions, primarily Adelphia/Time Warner 16
 Reduced shares outstanding by 12% Maintaining Strong Investment Grade Ratings (1) Cumulative investment in buyback program includes $1.4Bn of Comcast Exchangeables.")
17 Balance Sheet Management Investing for Growth and Differentiation Texas / Kansas City Cable Partnership Returning Capital to Shareholders Q07: 100+% of FCF used to repurchase stock $8Bn or 393MM shares repurchased (1) Reduced shares outstanding by 12% Maintaining Strong Investment Grade Ratings (1) Cumulative investment in buyback program includes $1.4Bn of Comcast Exchangeables. 17
18 Triple Play and Superior Products Powering our Business Focused on Execution and Extending Our Leadership Significant Growth Ahead 18
19 19