Katie Delahaye Paine CEO Paine Publishing April 16 th,
|
|
|
- Lizbeth Wade
- 5 years ago
- Views:
Transcription


1 Barcelona Principles Meet Reality: Are PR and Social Media Measurement Standards Doomed? Katie Delahaye Paine CEO Paine Publishing April 16 th,


2 The Short Version It s harder than you think There are more dragons than you expect You need both magic and therapy Without a protector you can t do it The end product won t look like your thought it would when you started out


3 The biggest challenges Getting from this: to this: Finding the data Making it valid Making it consistent
4 Below Target At Risk On Target PUBLIC AFFAIRS DASHBOARD Sales Target Risk Reduction New Market Share Increases Brand Awareness, Reduce Sales Cycle Increase Trust, Reduce Threats Expand the Marketable Universe Current Goal Current Goal Benchmark Benchmark Benchmark Current Goal % increase in share of desirable voice 8.9% 8.9% 10% % Decrease in undesirable Share of Conversation 10% 12% 8% % Increase in stakeholder awareness 10% 9% 20% % decrease in share of undesirable voice 3.1% 2.1% <3% % Decrease in stakeholders not aware 21% 21% 7% % Increase in online engagement on issue 10% 5% 15% % increase in awareness 11% 11% 13% % increase in Trust scores % Increase in inbound requests for information 50% 45% 75%
5 Typical Framework for consumer company Engage as Owners Improving Perceptions & Creating Advocacy Support the business With Employees % increase in engagement score in pulse survey % increase in employees proud to work with score % increase in of employees who participate in extra effort action/volunteer % reduction in absenteeism % of employees agreeing that they have a clear understanding and are informed of how work contributes to achieving goals. % increase in awareness of CSR activities & community involvement Adherence to budget % increase in revenue per employee (by source coding of revenue) With Customers % increase in NPS % increase in customer engagement with comms (web traffic, social engagement) % change in ratio of favorable to unfavorable coverage & conversations Progress against Survey Action Plan


6 What we learned 1. First, get consensus on how PR contributes to the business 2. Then, define success for PR/Communications 3. Draft metrics that reflect those goals & expectations 4. Track down the data, determine the gaps, climb in & out of silos 5. Produce a bespoke Standards Document telling everyone, including agencies & foreign offices how to report 6. Produce a dashboard with the best data you can find & point out the gaps 7. Put on your bullet proof vest & explain to EVERYONE 8. Produce the first report 9. Repeat step Revise (as necessary) 11. Draw conclusions, make decisions 12. Take it to the board

7 Custom Standards Standards for Media Reporting Web Analytics
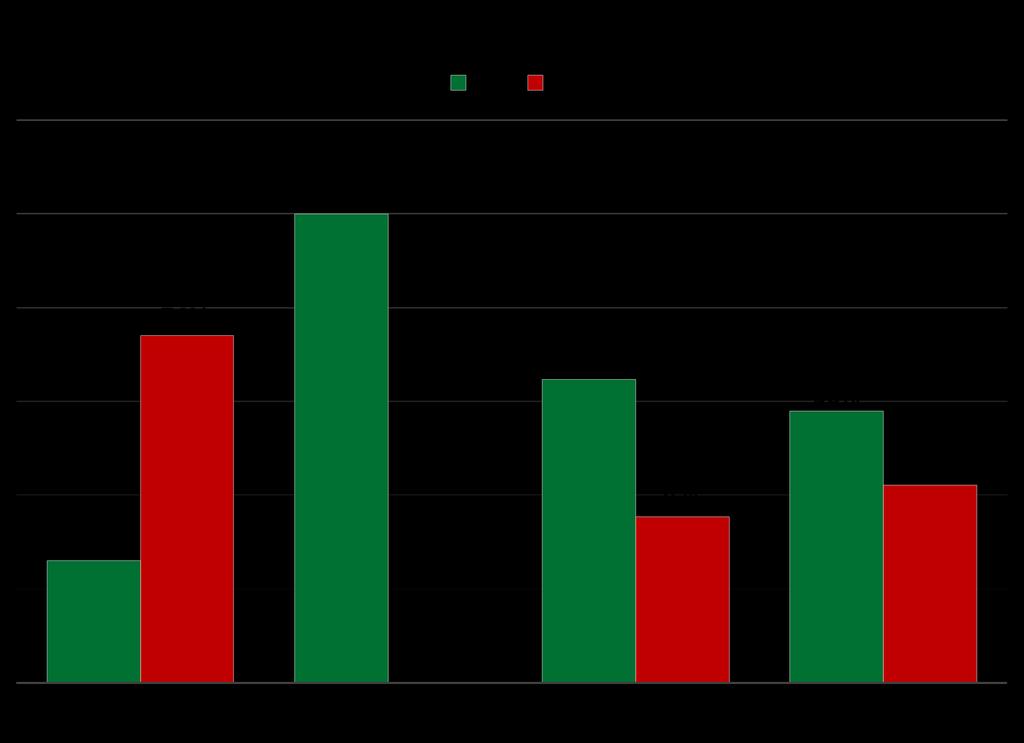
8 Comparison of Tonality Between Vendors % positive %negative %neutral UberVu 11.95% 9.46% 78.00% 0.32% NetBase 7.84% 92.11% Beyond 58.00% 13.00% 30.00% SDL 33.12% 26.53% 40.35%
9 Testing the Accuracy of Coding % Agreement with human coding % Disagreement with human coding NetBase 88.64% NetBase 11.36% UberVu 68.31% UberVu 31.69% SDL 48.94% SDL 51.06% 0.00% 20.00% 40.00% 60.00% 80.00% % SDL UberVu NetBase 0.00% 10.00% 20.00% 30.00% 40.00% 50.00% 60.00% SDL UberVu NetBase
10 Testing Completeness of Alerts % of alerts found SDL UberVu NetBase NetBase 17.65% UberVu 60.00% SDL % 14


11 Testing validity of criteria 3
12 Biggest Areas of Discrepancies Geographies vs. languages Lack of consistent competitors list Different definitions of products/brands covered Time frames Media types Search strings & filters
13 Definitions of Success Workshop defined the criteria All criteria linked back to the goals: High quality media coverage Intent to visit Improved reputation Visits/Non-gaming revenue
14 Defining High Quality Coverage The OCS Score Desirable Criteria Score Undesirable Score Score Positive sentiment 1 Negative Sentiment -2 Contains one or More Positive Messages Event/Program is mentioned 2 3 Contains one or more Negative Messages No Event/Program is mentioned Appears in Tier1 Media 2 Negative Mention in Tier Third Party Endorsement 1 Recommends competition -2 Contains a desirable visual 1 Contain undesirable visual -2 Total Score 10 Total -10
15 Average OCS Score Without ACA events, OCS Scores for Atlantic City would have been significantly lower The red line represents coverage of Atlantic City minus all mentions of ACA and its programs Average OCS Score Over Time Jan Feb Mar Apr May Jun Jul Aug Sep Oct Nov Dec Jan Feb Mar Apr May June Atlantic City OCS without ACA Atlantic City OCS with ACA
16 ACA programs drive higher OCS scores, which correlate highly with web visits Correlations between Web Visits and PR Metrics Pearson r. value ACA OCS Scores 0.47 ACA Items 0.44 AC items 0.41
17 When ACA programs received media coverage, traffic followed Relationship between ACA Program Mentions and Site Visits Site Visits Program Mentions

18 Thank you for joining! For more info & resources on measurement, visit PainePublishing.com Questions, feedback? me at Follow Katie on Twitter: QueenofMetrics Follow our Facebook page: Paine Publishing Or call me: