Preliminary Investigation of Near Infrared Spectroscopy for Green Sand Component Identification
|
|
|
- Rosaline Hancock
- 5 years ago
- Views:
Transcription
1 Preliminary Investigation of Near Infrared Spectroscopy for Green Sand Component Identification Dr. Scott R. Giese University of Northern Iowa
2 Research Objective Green sand molding characterization for process control Numerous tests Development of control charts by Heine Fairly slow for results for some tests Too generic in some instances Develop on-line method for determining compositional components
3 Compositional Components Major components Clay Serves as bonding agent and determines strength Water Actives clay and varies strength Minor components Additives such as seacoal Recycled core materials
4 Near-Infrared (NIR) Spectroscopy Wavelength = nm ( cm -1 ) Combination and overtones of CH, -OH, and NH vibration Normal Mode Vibration (MIR) High degree of Excitation Combination and Overtones (NIR) Low degree of Excitation Source -
5 Characteristics of NIR Reflection intensity stronger Silica can be used as transmittance materials Sample preparation not required NIR spectra characteristic to material
6 Example of Bentonite Stretching and Bending -OH Stretch Absorbed Water -OH Stretch Structural Hydroxyl Groups

7 InGaAs Linear Array Detector Dispersive Spectrometer Fiber-Optic Wavelength nm with resolution nm
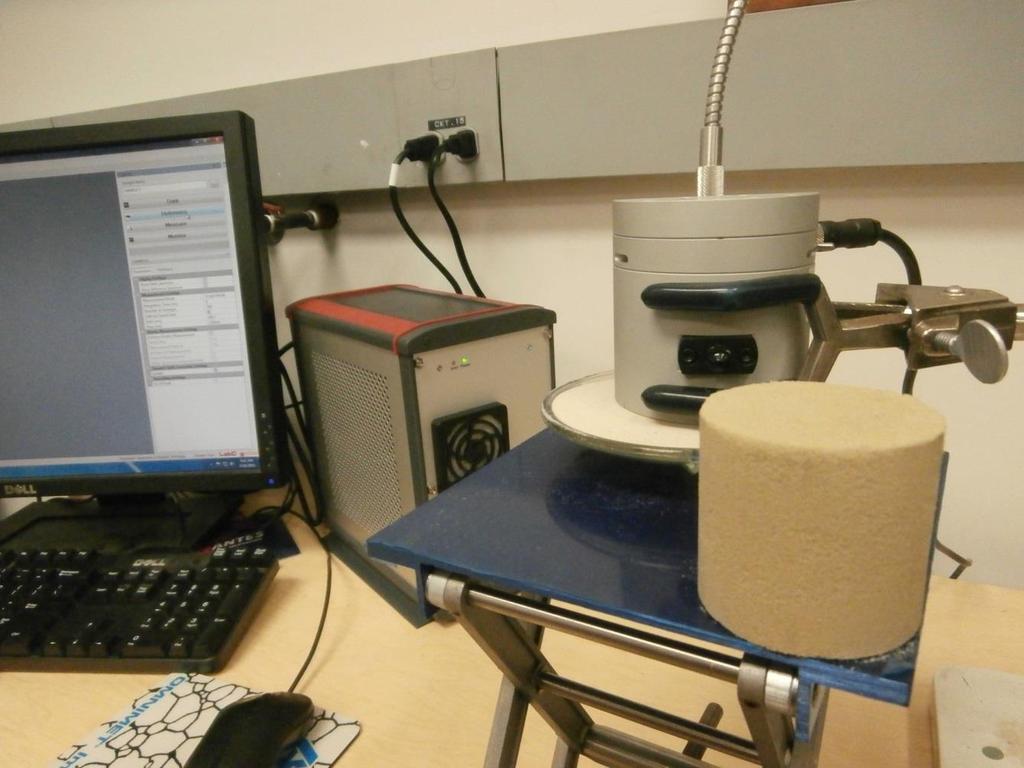
8 Experimental Technique
9 Initial Experiments Equipment designed for reflectance and absorbance Silica sand chemistry and distribution influence reflectance behavior Silica Sand GFN 110 Silica Sand GFN 70 Lake Sand GFN 55
10 Clay Characterization Western vs. Southern 118 th Metalcasting Congress April 8-11, 2014 Schaumburg, IL USA
11 Clay Characterization Baseline NIR Spectra Western Bentonite shows slightly higher absorbance 118 th Metalcasting Congress April 8-11, 2014 Schaumburg, IL USA
12 Influence of Clay on Reflectance Southern Bentonite Green Sand Decreasing Reflectance Trend in Spectra As Clay Content Increases
13 Influence of Water 9% Western & 2.6% Water
14 Experimental Plan First Analysis Prepare Green sand mixture at 3, 6, 9, and 12% bentonite levels Vary water content of 1, 2, 3, and 4% Develop calibration curves from linear partial least squares analysis (PLS1)

15 Typical Raw NIR Spectra 12% Western with Varying Water 118 th Metalcasting Congress April 8-11, 2014 Schaumburg, IL USA
16 Calibration Database Clay Content Example 118 th Metalcasting Congress April 8-11, 2014 Schaumburg, IL USA
17 Calibration Database Water Content Example 118 th Metalcasting Congress April 8-11, 2014 Schaumburg, IL USA
18 PLS1 Models Model Spectral Region R 2 # of factors A %Clay (full) B %Clay C %Clay A %H 2 O (full) B %H 2 O th Metalcasting Congress April 8-11, 2014 Schaumburg, IL USA
19 PLS1 Model Verification Sample %Clay Actual A %Clay B %Clay C %Clay %Moisture Actual A %Moisture B %Moisture th Metalcasting Congress April 8-11, 2014 Schaumburg, IL USA
20 Observations of Analysis High number of factors is detrimental to prediction capabilities Improved reliability when factors are centered on predicting variable PLS1 model for clay was fair Outer limits were poor (3 and 12%) PLS1 model for water was satisfactory Possible clay influence
21 Experimental Plan Second Analysis Repeat design of experiment on first attempt Baseline all curves to reduce potential noise

22 Base Lined Spectra Clay and Water Considered Curves show separation at 1425 and 1920 nm peaks
23 Baseline Spectra Example Varying Western Bentonite at 2% Water Change in 1420 and 1920 nm Peak Heights 118 th Metalcasting Congress April 8-11, 2014 Schaumburg, IL USA
24 Baseline Spectra Example Varying Water at 9% Western Bentonite Change in 1420 and 1920 nm Peak Height and Width 118 th Metalcasting Congress April 8-11, 2014 Schaumburg, IL USA
25 Large Peak Ratio 1920 nm Spectral Peak 2% H2O 3% H2O 4% H2O 1950 H L Western Bentonite (wt%) 118 th Metalcasting Congress April 8-11, 2014 Schaumburg, IL USA
26 Findings on Composition Chemistry and distribution of sand grains influence NIR reflectance intensity Southern and western bentonite can be distinguished. Water is associated with plateau between 1725 and 1860 nm
27 Findings on Predictive Model Simple PLS1 models can be tuned to a specific clay and water content, loses accuracy when limits are large Water appears to most influential in affecting limits Difficulty in simultaneously differentiating influence of water and clay
28 Findings on Predictive Model Linear relationship found when determining the width to height ratio at 1920 nm spectral peak
29 Recommendation on NIR Duality effect of clay and water Further investigation to W/H Ratio Differentiation of curves might yield more suited data Inclusion of other green sand components Might amplify the water/clay duality effect
30 For additional information, please contact: Dr. Scott Giese University of Northern Iowa Cedar Falls, IA Phone: Fax: