CHARACTERISTICS OF REPAIR MORTARS FOR HISTORIC BUILDINGS CONCERNING QUANTIFIED HYGRIC REQUIREMENTS
|
|
|
- Madison Hancock
- 5 years ago
- Views:
Transcription
1 CHARACTERISTICS OF REPAIR MORTARS FOR HISTORIC BUILDINGS CONCERNING QUANTIFIED HYGRIC REQUIREMENTS Prepared by: M. Rosário Veiga; LNEC, Portugal; Introduction The first requirement to be fulfilled by repair mortars to be used in Historic buildings is the assurance of introducing no damage on the pre-existent materials. Practice learns that effects of water and water transport may easily cause damage. For instance, the way water enters and moves through render and masonry mortars is related to moisture inside walls, salt crystallisation problems, biological colonisation, etc. For renders, it depends on the material characteristics, specially porosity and porosimetric structure, but also on the number and thickness of coats applied and on the finishing material or technique. It is important to evaluate the ease with which water reaches the masonry across the render, but also the time needed for drying. The drying capacity is particularly important when there is water on the foundations rising by capillarity. One of the secrets of lime renders good performance is surely their ability to dry. On the contrary, the high capillarity is a disadvantage. In ancient times, the water protection capacity was given by several methods: i) use of hydraulic materials, usually through pozzolanic additives; ii) use of several thin coats instead of one or two thick ones; iii) use of adequate finishings. Capillarity tests and water vapour permeability tests, which are meant to evaluate those properties, do not permit to simulate applications reality, namely thickness and different coats and finishings, and values obtained lack sometimes the accuracy needed to distinguish between different render solutions with diverse performance in practice. This paper describes a test prepared and used at LNEC (Laboratório Nacional de Engenharia Civil), of Lisbon, to simulate wetting and drying mechanisms on renders applied on a substrate; it presents a set of tests executed on several render solutions, both traditional and pre-fabricated, considering coats and finishing products; a correlation of results with capillarity and water vapour permeability values is tested; the results are discussed and some conclusions are presented, on the usefulness of the test method and on the parameters that can affect water behaviour. Description of the methodology Equipment A methodology was developed at LNEC, based on the variation of electric resistance with moisture content of materials [1, 2, 3] to follow the water path across renders and finishings to the substrate, able to test the whole system. The equipment used for the water protection test is a electric resistance based humidimeter designed by Palma specifically for this objective [1, 4, 5] (fig. 1). The measurements scale is directly related to the electric resistance of the material and varies between (wet) and (dry) for each mortar. The apparatus, constructed at LNEC with simple components, reads, registers and saves these values, using special electrodes also designed for it (fig. 2), and transfers the results to a computer through a software specially designed for it [5]. The data obtained is then worked out through conventional commercial software. 2.2 Test method The test method, developed for renders, consists on fixing the electrodes on a substrate, applying the render on it with the number and thickness of coats used in real work and, after cure, measuring and registering, with the humidimeter, the time needed for water, with a determined pressure, to wet the background and then to dry out again, after taking out the 35
2 source of water (figs. 2 to 4). The method has been previously tried and improved in some studies developed at LNEC that permitted the definition [3] and verification [3, 6, 7] of some parameters to interpret the results obtained and to classify the products behaviour (fig.5): W: wetting delay, measured in hours, is time needed for the water to wet the substrate across the render. It is defined as the delay between the water pressure application on the specimen until the electric tension on the electrodes has a fall of 5%. D: dry delay, measured in hours, is defined as the time during which the substrate stays wet, considering this happens while the electric tension is kept under 95% of the initial dry value. I: wetting intensity, measured in millivolts x h, is defined as the quantity of wetting determined during the test period, calculated as the area defined by the electric tension variation with time and tension value for the dry condition (95% of the initial value) I W D Fig. 1 Example of a humidimeter test graph with indication of parameters W, I and D In the present humidimeter tests the background used was a glass fibre cement plate, for simplicity and homogeneity. The test method is described in a Test Specification Sheet of LNEC [8]. For correlation, capillarity tests and water vapour permeability tests for renders were used as defined by EN tests and EN , respectively. Materials and conditions The referred test was applied to several site-prepared mortars: i) two cement mortars with different sands C4 and C4a; ii) two lime-cement mortars - LC3 and LC3a; iii) two hydraulic lime mortars H3 and H3a; iv) two air lime mortars - L3 and L3a; v) one air lime-natural pozzolan (LP) mortar. These mortars were tested as renders applied in three different conditions: a) one coat of 1 mm (all mortars); b) one coat of 2 mm (some mortars); c) 2 coats of 1 mm each (some mortars). The compositions selected were the most common of each type, in Portuguese construction. The ratio water/binder was chosen to guarantee adequate workability. The exact mortars compositions are described on table 1. The test was also applied on five industrial mortars commercialised for use as ancient buildings renders: vi) three industrial mortars based on lime IH, ILH and IL and ; vii) two industrial mortars of air lime with a small amount of synthetic resin with different proportions of siliceous sand ILSr for the lowest sand proportion (rich lime mortars) and ILSp for the 36
3 highest proportion (poor lime mortar), both with and without a thin finishing coat of lime, resin and fine siliceous sand. The aim of this set of tests was to evaluate the influence on water transport behaviour applying different binders, different sands, different coats and thickness and different finishings. The specimens for the test were obtained by application of the mortar, in one or two coats on plates of glass fibre cement with about mm 2 of area, cured during 28 days before testing, in laboratorial conditions characterised by 23 ± 2ºC / 5 ± 5% HR. The test was repeated at least twice for each render. The pressure used was 1 mm of water height, kept for one hour. Then the remaining (not absorbed) water was removed and the specimens were put in vertical position and let to dry (figs. 3 and 4). Table 1 Mortars compositions BINDER MORTAR COMPOSITION TYPE Volumetric dosage Constituents Factor to study C4 1:4 Cement : river sand Type of binder Cement Cement : river sand + C4a 1:2+2 renders pit sand* Type of sand Air Lime : cement : Lime - LC3 1:1:6 Type of binder river sand - cement renders Air Lime : cement : LC3a 1:1:3+3 Type of sand river sand + pit sand * Siliceous sand with a small proportion of clay Table 1 Mortars compositions (cont.) BINDER TYPE Hydraulic renders MORTAR Volumetric dosage Lime renders L3a 1:1,5+1,5 Lime pozolan renders Industrial lime renders COMPOSITION Constituents H3 1:3 Hydraulic lime : siliceous river sand Hydraulic lime : H3a 1:1,5+1,5 siliceous river sand + pit sand* L3 1:3 Air lime : siliceous river sand Air lime : siliceous river sand + pit sand*) Air lime : natural LP 1:,5:2,5 pozolan : siliceous river sand IH - Industrial hydraulic lime render ILH - Industrial air lime and hydraulic lime render IL - Industrial air lime render Industrial air lime render ILSr - with a small amount of synthetic resin rich lime mortar Industrial lime renders with synthetic resins ILSp - * Siliceous sand with a small proportion of clay Industrial air lime render with a small amount of synthetic resin poor lime mortar Factor to study Type of binder Type of sand Type of binder Type of sand Type of binder Industrial formulations based on lime plus admixtures Industrial formulations based on lime with synthetic resins 37
4 Results The results obtained for the renders with different binders are summarised in table 2, with different sands in table 3 and with different coats and thickness in table 4. Table 2 Results for renders with different binders WATER TRANSPORT BEHAVIOUR MORTAR Standardised tests Humidimeter tests Sd (m) C (kg/m 2.h 1/2 ) W (h) D (h) I (h) C4,9 12,6, LC3, 14,2, H3,75 1,1, L3,5 1,1, LP,35 9,5, IH,7 7,5, ILH,7,7, IL,6 1,9, ILSr,85,1 1, ILSp,8,5, Table 3 Results for renders with different sands WATER TRANSPORT BEHAVIOUR MORTAR Standardised tests Humidimeter tests Sd (m) C (kg/m 2.h 1/2 ) W (h) D (h) I (h) C4,9 12,6, C4a - 9,3, LC3, 14,2, LC3a - -, H3,75 1,1, H3a,75 14,7, L3,5 1,1, L3a - -, Table 4 Results for renders with different coats, thickness and finishings WATER TRANSPORT BEHAVIOUR MORTAR 1 coat (1 mm) 2 coats (1 mm + 1 mm) 1 coat (2 mm) W (h) D (h) I (h) W (h) D (h) I (h) W (h) D (h) I (h) C4, ,1 > 51 77,1 > C4a,2 24 -,7 > LC3, ,15 > 5177,1 > LC3a,2 96 -,25 > L3, , ,
5 L3a, , , ILH, , IL, , ILSr 1, * 12* 6 53* ILSp, * 15* 68 42* * For ILSr and ILSp the second coat is a thin finishing render of about 1-2 mm and a different composition Sd Air thickness of equivalent diffusion to,1 m of mortar; C Capillarity coefficient between 9 and 1 minutes The tests on industrial mortars IH to ILSp were accomplished with the present version of the humidimeter, which is more accurate and permits a better treatment of results than the previous version used for mortars made on site (C4 to LP). This fact must be taken into account when interpreting results. Discussion 5.1 Influence of binder The analysis of the electric resistance humidimeter tests parameters, synthesised in table 2, shows that the wetting delay is similar for current mortars made of cement, lime-cement, air lime and lime-pozzolan, when applied in a single coat of 1 mm. The hydraulic lime mortar tested and all the industrial mortars have a higher wetting delay. Considering table 2, the dry delay of current mortars is lower for the lime-pozzolan mortar tested, next for air lime and hydraulic lime mortars, higher for lime-cement and clearly the highest for cement mortars. The industrial mortars have different behaviour, showing medium dry delays for IH, very high for IL and ILH and surprising low dry delays for industrial mortars with some synthetic resin. This last result is probably a consequence of the low capillarity that prevents the penetration of a large quantity of water. The knowledge of the total volume of absorbed water could give important additional information to understand this effect. The observation of the graphs 4 and 7 confirms this behaviour. The wetting intensity shows relative values similar to those of dry delay except in what concerns IH, that has a higher I than cement mortar and LP, ILSr and ILSp that show values similar to L3 and H3. The values obtained for the evaluation of capillarity and of water vapour permeability through the standardised tests suggest that: all current mortars have similar impermeability, although lime-cement and cement have slightly higher coefficients of capillarity; industrial mortars have much lower coefficients of capillarity, except IH whose coefficient of capillarity is close to LP s; air lime and lime-pozzolan mortars have higher water vapour permeability and all the other show similar values for this characteristic. However, these tests don t seem accurate enough to distinguish the behaviour of rather different materials. 5.2 Influence of sand The observation of Table 3 clearly shows that sand with some clay (pit sand) increases slightly the wetting delay but usually also the dry delay and the wetting intensity, meaning that this kind of sand gives some improvement to impermeabilisation capacity but makes drying more difficult and contributes to keep the water inside the wall. 5.3 Influence of number and thickness of coats The analysis of table 4 shows that a higher thickness usually means higher wetting delay, higher drying delay and higher wetting intensity. However, the values of table 4 and graphs 2, 3, 5 and 6 also show that 2 coats of 1 mm + 1 mm are more efficient than one single coat of 2 mm, specially for lime mortars, improving the wetting delay and reducing drying delay and 39
6 wetting intensity. The graphics show these effects clearer than the numeric parameters, which need probably an adjustment to approach reality. 5.4 Influence of finishings ILSr and ILSp were tested without and with a finishing coat with a special product said to be based on the same materials. The results summarised in table 4 show that the application of a thin finishing coat can mean a completely different behaviour concerning water transport, with a much higher resistance to water penetration but also to water evaporation and a much higher wetting intensity. Actually the parameters w, d, and i are more than five times higher with a finishing coat. Conclusions The results obtained show that the electric resistance humidimeter test permits a much better distinction than standardised current tests of different materials behaviour with regard to water protection of walls. It also permits to evaluate the influence of the thickness of render and of using several coats and finishing coats. However, the methodology and the calculated parameters must still be improved. The tests presented point clearly to the next conclusions: Lime mortars show a quicker penetration of water to the substrate than cement mortars, but they don t have a tendency to retain the water inside the wall and contribute to a much faster drying of the substrate. The differences in the wetting delays is low: some minutes but the drying delays differ significantly: hours or days, so this characteristic is much more relevant. The type of sand has also some influence on the water protection capacity of renders: sands with some clay can retard water penetration, but it also delays the drying of the substrate, so it can be disadvantageous. The application of several thin coats is much more efficient than one thick coat, because there is a greater effect on delaying water penetration and an improvement of drying capacity. Industrial mortars, even when they are commercially presented as based on lime, show very different water transport behaviour compared to mortars made-on-site, probably because they contain water repellent additives. These characteristics can be aggravated by finishing coats. So, these materials must always be adequately tested before being recommended for use on ancient walls. Requirements may be established for parameters W, D and I for renders to use on ancient buildings, considering the exposition to water, from driven rain, from foundations or from other sources. However, these parameters may need adjustment and the analysis of water absorption and drying with time (presented in graphs) must always be observed. Other data concerning hygric behaviour of materials, such as capillarity, absorbed water, drying time and water vapour permeability should also be analysed as complementary information. 31
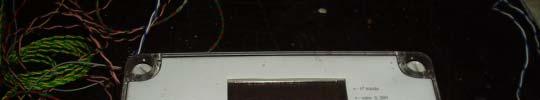


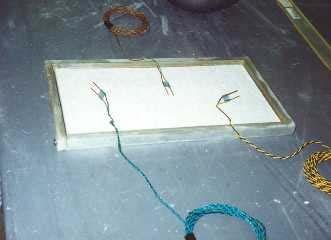
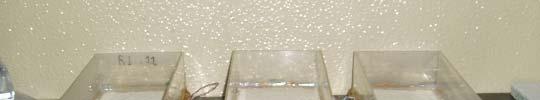
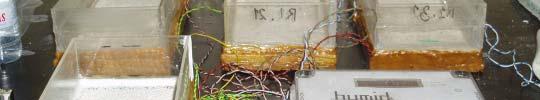
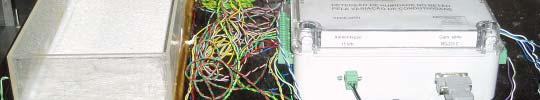
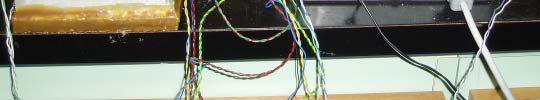

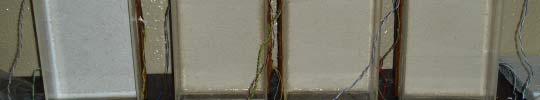

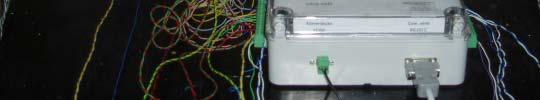
7 Fig.2 Humidimeter Fig. 3 Placement of electrodes Fig.4 Water protection test: wetting phase Fig. 5 Water protection test: drying phase The figures 2-5 give an impression of the test set-up used for the testing 311
8 APPENDIX MOISTURE ABSORPTION ,5,1,15,2 C4 LC3 L3a L3 GRAF 1-1 Coat: 1 mm - Absorption phase 1 9 ELECTRIC TENSIOM (mv) 8 6 5,2,4,6,8 1 1,2 1,4 C4 LC3 L3a L3 IL ILH GRAF 2-2 Coats: 1 mm + 1 mm - Absorption phase ,1,2,3,4,5 C4 LC3 L3a L3 GRAF 3-1 Coat: 2 mm - Absorption phase 312
9 APPENDIX DRYING 1 L LC3 L3a C C4 LC3 L3a L3 GRAF 4-1 Coat: 1 mm - Drying phase L3 L3a LC3 C TEMPO (H) C4 LC3 L3a L3 GRAF 5-2 Coats: 1 mm + 1 mm - Drying phase 1 1 L3a 1 9 L3 8 LC3 6 5 C GRAF 6-1 Coat: 2 mm - Drying phase C4 LC3 L3a L3 313
10 APPENDIX ABSORPTION + DRYING ILS r ILS p GRAF 7 - pre-dosed no finish 1 COAT: 1 mm - Absorption + Drying , 1, 2, 3, 4, 5, 6, 7, 8, 9,, 11, 12, 13, 14, 15, ILS p + F ILS r + F GRAF 8-1 COAT + FINISH - Absorption + Drying 314
11 REFERENCES [1] Palma, J., Leite, D. Aparelho Detector de Humidade no Betão com Base na Variação da Condutibilidade. Lisboa, LNEC, Report 56/92-GEEt, [2] Gonçalves, Teresa; Veiga, M. Rosário; Canha da Piedade, A. Evaluation of the capacity for impermeabilization of wall renders In International Symposium on Moisture Problems in Building walls, Proceedings. Porto, Setembro de [3] Gonçalves, Teresa. - Capacidade de impermeabilização de revestimentos de paredes à base de ligantes minerais. Desenvolvimento de um método de ensaio com base na resistência eléctrica. Lisboa, LNEC, Master on Construction Thesis by Universidade Técnica de Lisboa. [4] Palma, J. Incorporação de capacidades de Data-Logging no aparelho detector de humidade no betão. Lisboa, LNEC, Report 355/95-CPCE, [5] Palma, J. Novo sistema de aquisição de dados para sondas de penetração de humidade em argamassa e betão. Lisboa, LNEC, Report 355/1-CPCE, 1. [6] Veiga, M. Rosário; Carvalho, Fernanda - Some performance characteristics of lime mortars for use on rendering and repointing of ancient buildings. Proceedings of the 5th International Masonry Conference. London, October [7] Veiga, M. Rosário - Protecção contra a água de paredes de edifícios antigos. avaliação experimental da capacidade de protecção de argamassas de reboco com base em cal. Proceedings of Encontro Nacional sobre Conservação e Reabilitação de Estruturas - REPAR. Lisboa, LNEC, June. [8] LABORATÓRIO NACIONAL DE ENGENHARIA CIVIL (LNEC) Revestimentos de paredes. Caracterização da capacidade de impermeabilização. Lisbon, LNEC, May Test Specification Sheet FE Pa