PUNCHING SHEAR STRENGTH AND DEFORMATION CAPACITY OF FIBER REINFORCED CONCRETE SLAB-COLUMN CONNECTIONS UNDER EARTHQUAKE-TYPE LOADING.
|
|
|
- Barrie Lamb
- 5 years ago
- Views:
Transcription
1 PUNCHING SHEAR STRENGTH AND DEFORMATION CAPACITY OF FIBER REINFORCED CONCRETE SLAB-COLUMN CONNECTIONS UNDER EARTHQUAKE-TYPE LOADING by Min-Yuan Cheng A dissertation submitted in partial fulfillment of the requirements for the degree of Doctor of Philosophy (Civil Engineering) in The University of Michigan 29 Doctoral Committee: Associate Professor Gustavo J. Parra-Montesinos, Chair Professor Carlos E. Cesnik Professor Antoine E. Naaman Professor James K. Wight Professor Carol K. Shield, University of Minnesota
2 ACKNOWLEDGEMENTS This research was possible through the financial support provided by the US National Science Foundation, as part of the Network for Earthquake Engineering Simulation (NEES) Program, under Grant No. CMS The opinions expressed in this paper are those of the writer and do not necessarily express the views of the sponsor. The writer greatly appreciates to have been advised both academically and personally by Associate Professor Gustavo J. Parra-Montesinos. His invaluable and continuous support fulfilled the writer s Ph. D learning process and was instrumental in the completion of this dissertation. The writer is also grateful for having had the opportunity to be taught by Professors James K. Wight and Antoine E. Naaman. Their research enthusiasm and broad knowledge will definitely inspire and benefit the writer in his professional career. Appreciation is also extended to Professors Carlos E. Cesnik and Carol K. Shield for reviewing this report and offering helpful comments and suggestions. The support of Professor Shield during the tests conducted at the University of Minnesota NEES-MAST Laboratory is also greatly appreciated. The author wishes to thank his friends and fellow graduate students at the University of Michigan, in particular Afsin, Luis, Simon, Sean, Ekin, Chin, Ken, Andy, Hai, Adamantia, Remy, Matt, Monthian, Elizabeth and Terry for their kind help and quality time spent together. Sincere thanks are also due to the Structures Laboratory manager, Jan Pantolin and technicians, Robert Spence and Robert Fischer, for their invaluable help. The writer would also like to acknowledge the contributions from staff at the University of Minnesota NEES-MAST Laboratory, especially Paul Bergson, Angela Kingsley, Drew J. Daugherty, Chen P. Wan, and Jonathan Messier. Finally, the writer wishes to thank his parents, Chi-Kang Cheng and Mei-Li Chiag, as well as his sister, Min-Wen Cheng, whose love and encouragement were always with him. ii
3 TABLE OF CONTENTS ACKNOWLEDGEMENT LIST OF TABLES LIST OF FIGURES LIST OF APPENDICES ii vi viii xiv CHAPTER 1 INTRODUCTION 1.1 SLAB-COLUMN FRAMED STRUCTURES PUCNGHIN SHEAR FAILURE AND SHEAR REINFORCEMENT IN 2 SLAB-COLUMN CONNECTION 1.3 RESEARCH MOTIVATION RESEARCH OBJECTIVES REPORT ORGANIZATION 6 CHAPTER 2 LITERATURE REVIEW 2.1 REVIEW OF DESIGN PROVISIONS FOR PUNCHING SHEAR EXPERIMENTAL SETUP FOR REINFORCED CONCRETE SLAB- 11 COLUMN CONNECTIONS 2.3 DRIFT CAPACITY OF SLAB-COLUMN CONNECTIONS SHEAR REINFORCEMENT FOR SLAB-COLUMN CONNECTIONS Bent-up Bars Closed Stirrups Shearheads Shear Studs FIBER-REINFORCED CONCRETE IN SLAB-COLUMN CONNECTIONS SUMMARY 24 CHAPTER 3 BEHAVIOR OF FIBER REINFORCED CONCRETE SLABS UNDER MONOTONICALLY INCREASED PUNCHING SHEAR 3.1 INTRODUCTION TEST SPECIMENS MATERIAL PROPERTIES Concrete Mixtures Steel Fibers Reinforcing Steel TEST SETUP AND INSTRUMENTATION ARRAGNEMENT EXPERIMENTAL RESULSTS iii
4 3.5.1 Observed Damage Load versus Deflection Relationship Yield-Line Analysis Rotations Steel Strains Influence of Fiber Reinforcement on Deflection Capacity Energy Absorption 41 CHAPTER 4 BEHAVIOR OF FIBER REINFORCED CONCRETE SLAB- COLUMN CONNECTIONS UNDER COMBINED GRAVITY LOAD AND UNI- AIXAL LATERAL DISPLACEMENTS 4.1 INTRODUCTION TEST SPECIMENS SLAB INSTRUMENTATION TEST PROCEDURE MATERIAL PROPERTIES Fiber Reinforced Concrete and Regular Concrete Reinforcing Steel EXPERIMENTAL RESULTS Damage Progression Load Displacement Response and Gravity Shear History Rotations Evaluation of Shear Stresses Using Eccentric Shear Model Shear Stress versus Rotation Interaction Steel Strains Average Strain from Measurement of Potentiometers Curvature INFLUENCE OF REINFORCEMNT AND GRAVITY SHEAR RATIOS ON 7 SHEAR STRENGTH AND LATERAL DRIFT CAPACITY (REINFORCED CONCRETE VERSUS FIBER REINFORCED CONCRETE) CHAPTER 5 BEHAVIOR OF SLAB-COLUMN CONNECTIONS UNDER COMBINED GRAVITY LOAD AND BI-AXIAL LATERAL DISPLACMENTS 5.1 INTRODUCTION TEST SPECIMENS SPECIMEN INSTRUMENTATION STAGING OF SPECIMENS AND TEST PROCEDURE MATERIAL PROPERTIES Fiber Reinforced Concrete and Regular Concrete Reinforcing Steel EXPERIMENTAL RESULTS Damage Progression Load Displacement Response and Gravity Shear History Load versus Displacement Envelope Response Rotations Evaluation of Shear Stresses Using Eccentric Shear Model 96 iv
5 5.6.6 Shear Stress versus Rotation Interaction Steel Strains Average Strain from Measurement of LVDTs Curvature INFLUENCE OF REINFORCEMENT AND GRAVITY SHEAR RATIOS ON 18 SHEAR STRENGTH AND LATERAL DRIFT CAPACITY CHAPTER 6 CONCLUSIONS 11 TABLES 116 FIGURES 153 APPENDICES 32 REFERENCES 325 v
6 Table 2-1 LIST OF TABLES Summary of Tests of Interior Slab-Column Connections Without Shear Reinforcement 116 Table 3-1 Test Specimens 118 Table 3-2 Concrete Cylinder Strength (ksi) 118 Table 3-3 Steel Strength 119 Table 3-4 Load and Deflection at Peak 12 Table 3-5 Strength Comparison 121 Table 3-6 Strength Estimations using Yield-Line Analysis 121 Table 3-7 Comparison of Deflection Capacities 122 Table 3-8 Energy Absorption 122 Table 4-1 Main Features of Test Specimens 123 Table 4-2 Applied Gravity Shear 124 Table 4-3 Concrete Cylinder Strength (ksi) 124 Table 4-4 Beam Test Result 125 Table 4-5 Steel Strength 125 Table 4-6 Shear Stress at Critical Section for Specimen SU1 under a 1/2 Gravity 126 Shear Ratio Table 4-7 Shear Stress at Critical Section for Specimen SU1 under a 5/8 Gravity 127 Shear Ratio Table 4-8 Shear Stress at Critical Section for Specimen SU2 under a 1/2 Gravity 128 Shear Ratio Table 4-9 Shear Stress at Critical Section for Specimen SU2 under a 5/8 Gravity 129 Shear Ratio Table 4-1 Comparison of Experimental Results 13 Table 5-1 Main Features of Test Specimens 132 Table 5-2 Applied Gravity Shear 132 Table 5-3 Displacement History for Specimens SB1, SB2 and SB3 133 Table 5-4 Concrete Slump Measurements for Specimens SB1, SB2 and SB3 133 Table 5-5 Concrete Cylinder Strength (ksi) 134 Table 5-6 Beam Test Result 135 Table 5-7 Steel Strength 135 Table 5-8 Summary of Test Result 135 Table 5-9 Peak and Ultimate Lateral Load Comparison 136 Table 5-1 Peak Rotation Comparison 137 Table 5-11 Shear Stress at Critical Section for Specimen SB1 under a 1/2 Gravity Shear Ratio 138 vi
7 Table 5-12 Shear Stress at Critical Section for Specimen SB2 under a 1/2 Gravity 144 Shear Ratio Table 5-13 Shear Stress at Critical Section for Specimen SB3 under a 1/2 Gravity 149 Shear Ratio Table 5-14 Summary of Results from Eccentric Shear Model 152 vii
8 LIST OF FIGURES Fig. 1-1 Slab-Column Framed System 153 Fig. 1-2 Shear Failure of Slabs 153 Fig. 1-3 Perimeter of Critical Section 154 Fig. 1-4 Common Alternatives for Increasing Shear Resistance in Slab-Column Connections 155 Fig. 1-5 Arrangement of Shear Studs 157 Fig. 1-6 Mechanism of Headed Shear Studs 157 Fig. 2-1 Critical Section for Diagonal Tensile Stress of 192 ACI Standard Specification 158 Fig. 2-2 Slab Effective Width for Unbalanced Moment Transferred by Flexure 158 Fig. 2-3 Drift versus Gravity Shear Ratios Interaction Diagram in ACI Building Code (28) 158 Fig. 2-4 Experimental Setup for Tests of Slabs under Monotonically Increased Concentrated Load 159 Fig. 2-5 Experimental Setup for Tests of Slabs under Monotonically Increased Distributed or Multi-Point Load 16 Fig. 2-6 Experimental Setup for Tests of Slab-Column Connections under Combined Gravity Load and Unbalanced Moment 161 Fig. 2-7 Experimental Setup used by Hawkins et al. (1974) 162 Fig. 2-8 Sequence of Application of Gravity Load in Tests by Dovich and Wight (1994) 163 Fig. 2-9 Drift versus Gravity Shear Ratio Model by Hueste and Wight (1999) 164 Fig. 2-1 Test Results of Interior Slab-Column Connections without Shear Reinforcement (Using Target Gravity Shear Ratio) 165 Fig Test Results of Interior Slab-Column Connections without Shear Reinforcements (Using Gravity Shear Ratio at Peak Load) 166 Fig Bent-Up Bars as Shear Reinforcement (Specimen 4S Tested by Islam and Park, 1976) 167 Fig Hoop Reinforcement in Specimen 6CS Tested by Islam and Park, Fig. 3-1 Test Setup and Location of Potentiometers 169 Fig. 3-2 Reinforcement Layout and Strain Gauge Arrangement 17 Fig. 3-3 Fiber Reinforced Concrete in 3 x 3 in. Central Region for Specimens S5, S6 S9, and S1 171 Fig. 3-4 Laboratory Concrete Mixers 172 Fig. 3-5 Crack Pattern on Slab Tension Side 173 Fig. 3-6 Measurement of Deflection Associated with Deformations in the Test Setup 178 viii
9 Fig. 3-7 Load versus Deflection Response 179 Fig. 3-8 Normalized Shear Stress versus Deflection Response 18 Fig. 3-9 Assumed Yield-Line Pattern for Test Specimens with Corners Free to Lift (Elstner and Hognestad, 1956) 181 Fig. 3-1 Normalized Load versus Deflection Response 182 Fig Normalized Shear Strength versus Average Rotation 183 Fig Readings of Strain Gauges at d/2 Distance from Column Face (Specimens with 4 in. Rebar Spacing) 184 Fig Readings of Strain Gauges at 1.5d Distance from Column Face (Specimens with 4 in. Rebar Spacing) 185 Fig Readings of Strain Gauges at d/2 Distance from Column Face (Specimens with 6 in. Rebar Spacing) 186 Fig Readings of Strain Gauges at 1.5d Distance from Column Face (Specimens with 6 in. Rebar Spacing) 187 Fig Definition of Energy Absorption 188 Fig. 4-1 Specimens SU1 and SU2 189 Fig. 4-2 Test Setup for Specimens SU1 and SU2 19 Fig. 4-3 Slab Reinforcement Layout for Specimens SU1 and SU2 191 Fig. 4-4 Anchorage of Slab Flexural Reinforcement in Specimens SU1 and SU2 192 Fig. 4-5 Column Reinforcement for Specimens SU1 and SU2 192 Fig. 4-6 Strain Gauge Labels and Locations for Specimens SU1 and SU2 (Top Reinforcement) 193 Fig. 4-7 Strain Gauge Labels and Locations for Specimens SU1 and SU2 (Bottom Reinforcement) 194 Fig. 4-8 Potentiometer Arrangement for Specimens SU1 and SU2 195 Fig. 4-9 Locations of Strands for Simulations of Gravity Load in Specimens SU1 and SU2 196 Fig. 4-1 Lateral Displacement History for Specimen SU1 197 Fig Lateral Displacement History for Specimen SU2 198 Fig Load versus Deflection Response for Beam Specimens 199 Fig Specimen SU2 at 1.5% Drift 199 Fig Diagonal Cracks on Top of Slab 2 Fig Connection Damage in Specimen SU1 at 5% Drift (5/8 Gravity Shear Ratio) 2 Fig Connection Damage in Specimen SU2 after Test (5/8 Gravity Shear Ratio) 21 Fig Specimen SU1 after Saw-Cutting of Slab 21 Fig Lateral Force versus Drift Response for Specimen SU1 (1/2 Gravity Shear Ratio) 22 Fig Connection Shear versus Drift History for Specimen SU1 (1/2 Gravity Shear Ratio) 23 Fig. 4-2 Lateral Force versus Drift Response for Specimen SU1 (5/8 Gravity Shear Ratio) 24 Fig Connection Shear versus Drift History for Specimen SU1 (5/8 Gravity Shear Ratio) 25 ix
10 Fig Steel Plate Effect on Specimen SU2 26 Fig Lateral Force versus Drift Response for Specimen SU2 with Plate Effect (1/2 Gravity Shear Ratio) 26 Fig Adjusted Lateral Force versus Drift Response for Specimen SU2 (1/2 Gravity Shear Ratio) 27 Fig Connection Shear versus Drift History for Specimen SU2 (1/2 Gravity Shear Ratio) 28 Fig Adjusted Lateral Force versus Drift Response for Specimen SU2 (5/8 Gravity Shear Ratio) 29 Fig Connection Shear versus Drift History for Specimen SU2 (5/8 Gravity Shear Ratio) 21 Fig Peak Load versus Drift Envelope Response Comparison for Specimens SU1 and SU2 211 Fig Lateral Load versus Connection Rotation Response of Specimen SU1 at Distance 1d from Column Face (Gravity Shear Ratio of 1/2) 212 Fig. 4-3 Lateral Load versus Connection Rotation Response of Specimen SU1 at Distance 2d from Column Face (Gravity Shear Ratio of 1/2) 213 Fig Lateral Load versus Connection Rotation Response of Specimen SU2 at Distance 1d from Column Face (Gravity Shear Ratio of 1/2) 214 Fig Lateral Load versus Connection Rotation Response of Specimen SU2 at Distance 2d from Column Face (Gravity Shear Ratio of 1/2) 215 Fig Unbalanced Moment versus East Rotation Response Envelope for Specimen SU1 216 Fig Unbalanced Moment versus West Rotation Response Envelope for Specimen SU1 217 Fig Unbalanced Moment versus East Rotation Response Envelope for Specimen SU2 218 Fig Unbalanced Moment versus West Rotation Response Envelope for Specimen SU2 219 Fig Eccentric Shear Model for Interior Slab-Column Connection 22 Fig Shear Stress versus Rotation Capacity Relationship for Connections with High-Strength Hooked Steel Fibers (Dramix RC-8/3-BP) 221 Fig Shear Stress versus Rotation Capacity Relationship for Connections with Regular Strength Hooked Steel Fibers (Dramix ZP35) 221 Fig. 4-4 Top Reinforcement Strain Distribution at Distance.5d from Column Face in Specimen SU1 (West Side, 1/2 Gravity Shear Ratio) 222 Fig Top Reinforcement Strain Distribution at Distance.5d from Column Face in Specimen SU1 (East Side, 1/2 Gravity Shear Ratio) 223 Fig Top Reinforcement Strains at Distance 2.5d from Column Face in Specimen SU1 (1/2 Gravity Shear Ratio) 224 Fig Top Reinforcement Strain Distribution at Distance.5d from Column Face in Specimen SU1 (West Side, 5/8 Gravity Shear Ratio) 225 Fig Top Reinforcement Strain Distribution at Distance.5d from Column Face in Specimen SU1 (East Side, 5/8 Gravity Shear Ratio) 226 Fig Bottom Reinforcement Strains at Distance.5d from Column Face in Specimen SU1 (West Side, 1/2 Gravity Shear Ratio) 227 x
11 Fig Bottom Reinforcement Strains at Distance.5d from Column Face in Specimen SU1 (East Side, 1/2 Gravity Shear Ratio) 228 Fig Bottom Reinforcement Strains at Distance.5d from Column Face in Specimen SU1 (5/8 Gravity Shear Ratio) 229 Fig Top Reinforcement Strain Distribution at Distance.5d from Column Face in Specimen SU2 (West Side, 1/2 Gravity Shear Ratio) 23 Fig Top Reinforcement Strain Distribution at Distance.5d from Column Face in Specimen SU2 (East Side, 1/2 Gravity Shear Ratio) 231 Fig. 4-5 Top Reinforcement Strains at Distance 2.5d from Column Face in Specimen SU2 (1/2 Gravity Shear Ratio) 232 Fig Bottom Reinforcement Strains at Distance.5d from Column Face in Specimen SU2 (West Side, 1/2 Gravity Shear Ratio) 233 Fig Bottom Reinforcement Strains at Distance.5d from Column Face in Specimen SU2 (East Side, 1/2 Gravity Shear Ratio) 234 Fig Strain Comparison for Specimen SU1 (1/2 Gravity Shear Ratio) 235 Fig Strain Comparison for Specimen SU2 (1/2 Gravity Shear Ratio) 236 Fig East Side Curvature for Specimen SU1 (West Loading; 1/2 Gravity Shear Ratio) 237 Fig West Side Curvature for Specimen SU1 (East Loading; 1/2 Gravity Shear Ratio) 238 Fig West Side Curvature for Specimen SU2 (East Loading; 1/2 Gravity Shear Ratio) 239 Fig East Side Curvature of Specimen SU2 (West Loading; 1/2 Gravity Shear Ratio) 24 Fig Combined Shear Stress versus Slab Tensile Reinforcement Ratio 241 Fig. 4-6 Combined Shear Stress versus Slab Tensile Reinforcement Ratio (Accounting for Slab Reinforcement Ratio) 242 Fig Combined Shear Stress versus Lateral Drift Ratio 243 Fig Combined Shear Stress versus Lateral Drift Ratio (Accounting for Slab Reinforcement Ratio) 244 Fig Lateral Drift Ratio versus Gravity Shear Ratio 245 Fig Lateral Drift Ratio versus Gravity Shear Ratio (Accounting for Slab Reinforcement Ratio) 246 Fig. 5-1 Geometry of Specimens SB1, SB2 and SB3 247 Fig. 5-2 Test Setup for Specimens SB1, SB2 and SB3 248 Fig. 5-3 Slab Reinforcement Layout for Specimens SB1 and SB2 249 Fig. 5-4 Slab Reinforcement Layout for Specimen SB3 25 Fig. 5-5 Shear Stud Reinforcement and Slab Critical Perimeter beyond Shear Reinforcement (Specimen SB3) 251 Fig. 5-6 Stud Rail Geometry for Specimen SB3 251 Fig. 5-7 Column Reinforcement for Specimens SB1, SB2 and SB3 252 Fig. 5-8 Top and Base Block Reinforcement for Specimens SB1, SB2 and SB3 253 Fig. 5-9 Slab Strain Gauges for Specimens SB1, SB2 and SB3 254 Fig. 5-1 Column Strain Gauges for Specimens SB1, SB2 and SB3 255 Fig Slab and Column LVDTs for Specimens SB1, SB2 and SB3 256 xi
12 Fig Drift versus Cycle Number for Specimens SB1, SB2 and SB3 257 Fig Clover-Leaf Bi-Axial Lateral Displacement Pattern for Each Loading Cycle 257 Fig Casting of Fiber Reinforced Concrete 258 Fig Casting of Regular Concrete 258 Fig Load versus Deflection Response for Beam Specimens 259 Fig Diagonal Cracks in Specimen SB1 259 Fig Initiation of Punching Shear Failure in Specimen SB1 26 Fig Perimeter of Punching Shear Failure in Specimens SB1 (After Test) 26 Fig. 5-2 Initiation of Punching Shear Failure in Specimen SB2 261 Fig Perimeter of Punching Shear Failure in Specimens SB2 (After Test) 262 Fig Half-inch Vertical Settlement of Slab in Specimen SB2 after Punching Shear Failure 262 Fig Initiation of Punching Shear Failure in Specimen SB3 263 Fig Connection Damage after Test and Perimeter of Headed Shear Stud Reinforcement in Specimen SB3 263 Fig Punching Shear Failure of Specimens SB3 264 Fig Damage in Shear Stud Reinforcement of Specimen SB3 after Removal of Connection Concrete (Notice Tunnel of Concrete Left by Second 264 Shear Stud) Fig Load versus Displacement Response of Specimen SB1 265 Fig Shear Force at Critical Section of Connection in Specimen SB1 266 Fig Load versus Displacement Response of Specimen SB2 267 Fig. 5-3 Shear Force at Critical Section of Connection in Specimen SB2 268 Fig Load versus Displacement Response of Specimen SB3 269 Fig Shear Force at Critical Section of Connection in Specimen SB3 27 Fig Comparison of Specimen Load versus Drift Response in North-South Direction 271 Fig Comparison of Specimen Load versus Drift Response in East-West Direction 272 Fig Envelope of Load versus Drift Response for Loading in North-South Direction 273 Fig Envelope of Load versus Drift Response for Loading in East-West Direction 274 Fig Envelope of Load versus Bi-axial Drift Response 275 Fig Calculation of Unbalanced Moment 276 Fig Unbalanced Moment versus East Rotation (Specimen SB1) 277 Fig. 5-4 Unbalanced Moment versus West Rotation (Specimen SB1) 278 Fig Unbalanced Moment versus North Rotation (Specimen SB1) 279 Fig Unbalanced Moment versus South Rotation (Specimen SB1) 28 Fig Unbalanced Moment versus East Rotation (Specimen SB2) 281 Fig Unbalanced Moment versus North Rotation (Specimen SB2) 282 Fig Unbalanced Moment versus South Rotation (Specimen SB2) 283 Fig Unbalanced Moment versus East Rotation (Specimen SB3) 284 Fig Unbalanced Moment versus West Rotation (Specimen SB3) 285 Fig Unbalanced Moment versus North Rotation (Specimen SB3) 286 xii
13 Fig Unbalanced Moment versus South Rotation (Specimen SB3) 287 Fig. 5-5 Lateral Load versus Column Base Rotation in Specimen SB1 288 Fig Lateral Lateral Load versus Column Base Rotation in Specimen SB2 289 Fig Lateral Load versus Column Base Rotation in Specimen SB3 29 Fig Shear Stress versus Rotation Capacity Relationship for Connections with High-Strength Hooked Steel Fibers (Dramix RC-8/3-BP) 291 Fig Shear Stress versus Rotation Capacity Relationship for Connections with Regular Strength Hooked Steel Fibers (Dramix ZP35) 291 Fig Readings from Strain Gauge TE2 of Specimen SB1 292 Fig Readings from Strain Gauge TE3 of Specimen SB1 292 Fig Readings from Strain Gauge TS3 of Specimen SB1 293 Fig Readings from Strain Gauge TE6 of Specimen SB1 293 Fig Strain Distribution on Slab North Side of Specimen SB1 294 Fig. 5-6 Strain Distribution on Slab East Side of Specimen SB1 295 Fig Strain Gauges BE3 and BE4 of Specimen SB1 296 Fig Lateral Load versus Strain Gauge Reading on Column Longitudinal Reinforcement in Specimen SB1 297 Fig Readings from Strain Gauge TE3 of Specimen SB2 298 Fig Readings from Strain Gauge TS3 of Specimen SB2 298 Fig Readings from Strain Gauge TE2 of Specimen SB2 299 Fig Strain Distribution on Slab North Side of Specimen SB2 3 Fig Strain Distribution on Slab East Side of Specimen SB2 31 Fig Readings from Strain Gauge BS3 of Specimen SB2 32 Fig Readings from Strain Gauge TS2 of Specimen SB3 32 Fig. 5-7 Readings from Strain Gauge TE2 of Specimen SB3 33 Fig Readings from Strain Gauge TE3 of Specimen SB3 33 Fig Readings from Strain Gauge TS3 of Specimen SB3 34 Fig Readings from Strain Gauge TS1 of Specimen SB3 34 Fig Strain Distribution on Slab North Side of Specimen SB3 35 Fig Strain Distribution on Slab East Side of Specimen SB3 36 Fig Readings from Strain Gauges BS3 and BS4 of Specimen SB3 37 Fig Slab Strain Comparison for Specimen SB1 (North-South Direction) 38 Fig Slab Strain Comparison for Specimen SB1 (East-West Direction) 39 Fig Slab Strain Comparison for Specimen SB2 (North-South Direction) 31 Fig. 5-8 Slab Strain Comparison for Specimen SB3 (North-South Direction) 311 Fig Slab Strain Comparison for Specimen SB3 (East-West Direction) 312 Fig Curvature at North Side of Specimen SB1 (At Loading Point 4) 313 Fig Curvature at North Side of Specimen SB2 (At Loading Point 4) 314 Fig Curvature at North Side of Specimen SB3 (At Loading Point 4) 315 Fig Combined Shear Stress versus Slab Tensile Reinforcement Ratio 316 Fig Combined Shear Stress versus Slab Tensile Reinforcement Ratio (Accounting for Slab Reinforcement Ratio) 317 Fig Lateral Drift Ratio versus Gravity Shear Ratio 318 Fig Lateral Drift Ratio versus Gravity Shear Ratio (Accounting for Slab Reinforcement Ratio) 319 xiii
14 LIST OF APPENDICES Appendix A Yield-Line Analysis 32 Appendix B Design of Headed Shear Stud Reinforcement 322 xiv
15 CHAPTER 1 - INTRODUCTION 1.1 SLAB-COLUMN FRAMED STRUCTURES Reinforced-concrete framed structures that feature slabs supported directly by columns, without the use of beams or girders, are referred to as slab-column or flat plate framed systems (Fig. 1-1). This type of system offers economical advantages and larger open spaces with reduced story heights compared to framed systems with beams. Therefore, for low and medium-rise buildings, typically between 5 and 15 stories (Dovich and Wight, 1994), located in regions of low or no seismicity, reinforced concrete slab-column frames represent an attractive alternative to building designers and owners. Also, when combined with special moment-resisting frames or structural walls, slab-column frames may be used in moderate and high seismic regions. The design of slab-column framed systems often poses two main challenges, unacceptable deflections and punching shear failures around columns. Deflection-related problems in flat slabs are often eliminated by applying prestressing to the slab. However, connection punching shear failures are still of concern in the design of slab-column framed systems, particularly when located in regions of moderate to high seismicity because of the combination of gravity- and earthquake-induced shear stresses and deformations. Punching shear failures occur suddenly, without warning and therefore, they need to be prevented. Further, poor shear design of slabs may lead to a progressive collapse when lower floors fail to support the impact loading initiated from collapsed floors above. 1.2 PUNCHING SHEAR FAILURE AND SHEAR REINFORCEMENT IN SLAB-COLUMN CONNECTION Two types of shear failures have been observed in slabs of slab-column framed systems. The first is a one-way or beam-type shear failure, as shown in Fig. 1-2(a), which 1
16 involves an inclined crack extending across the entire width of the slab. The other failure mode, which often governs the slab design, is referred to as a two-way or punching shear failure, shown in Fig.1-2(b). This failure involves a truncated cone or pyramid-shape surface around the column. In regular concrete slabs, the angle of inclination of the truncated pyramid-shape surface with the slab failure plane typically ranges between 2 and 45 degrees (Nilson 23). Based on research work on two-way shear action reported by ACI Committee 326 (ACI Committee 326, 1962), a critical shear area corresponding to that of a vertical section of depth d that follows the column periphery at a distance d/2 from the column faces is recommended (Fig. 1-3), where d is the slab effective depth. In Fig. 1-3, c1 is the column dimension parallel to the reinforcement resisting the moment under consideration (in Fig. 1-3, bending about the y-y axis is assumed), while c2 is the column dimension in the perpendicular direction. This concept is incorporated in ACI Code Section (28 ACI Building Code), which requires that, for interior connections of slab-column frames, shear stresses be investigated at a critical section located at d/2 from the periphery of the concentrated load Thus, for the rectangular column section shown in Fig. 1-3, the critical section area is ( ) perimeter of the critical section. bd o = 2 [ c1 + d + ( c2 + d)] d, where b o is the In slab-column frames located in regions of high seismic risk, the connections must be capable of transferring gravity loads while the structure undergoes earthquake-induced lateral displacements. These displacements, besides inducing an unbalanced moment, could also translate into large inelastic rotations in the connections, which have the potential to decrease connection punching shear capacity. The detrimental effect of lateral displacements on connection strength may therefore lead to the need for shear reinforcement in slab-column connections that otherwise would be capable of resisting the imposed shear stresses. Increasing the slab thickness or using drop panels or column capitals is often not an economical and/or practical option. Increasing slab thickness results in a cost and weight 2
17 increase, while changes in slab cross section and formwork, when using drop panels or column capitals, take away some of the major advantages of slab-column systems over beam-column frames, i.e., uniformity in slab bottom surface and increased clear story heights. Therefore, methods to increase punching shear resistance without modifying the slab thickness are often preferred. Several reinforcement alternatives for increasing punching shear resistance of slab-column connections (Fig. 1-4), including bent-up bars (Hawkins, 1974; Islam and Park, 1976), closed stirrups (Islam and Park, 1976), shearheads (Corley and Hawkins, 1968; 1974), and shear studs (Dilger and Ghali, 1981), have been evaluated in the past five decades. A discussion of typical reinforcement schemes for increasing punching shear resistance of slab-column connections is provided in Chapter RESEARCH MOTIVATION Although there are well-established methods to increase punching shear capacity in slab-column connections, there is room for improvements to achieve better seismic performance at reduced costs. Currently, shear stud reinforcement represents the preferred option of structural designers and experimental results obtained from subassembly tests (Elgabry and Ghali, 1987; Megally and Ghali, 2; Robertson et al. 22) seem to confirm that this type of reinforcement is indeed effective for increasing punching shear resistance of slab-column connections subjected to uni-axial displacement reversals. To the writer s knowledge, the behavior of slab-column connections with shear stud reinforcement under bi-axial lateral displacements has only been studied by Ten and Tang (25). However, only connections with highly rectangular columns were considered, which are not representative of most slab-column connections in regions of high seismicity in the United States. Besides the limited information on the behavior of connections with shear stud reinforcement under combined gravity load and bi-axial lateral displacements, the high cost of shear stud reinforcement and potential interference problems with slab reinforcement (Fig. 1-5) call for the evaluation of potentially more cost-effective and less 3
18 intrusive reinforcement solutions. One such solution is represented by discontinuous, randomly oriented steel fibers, which can be added to the concrete used in the connection region. Because of their random orientation, this type of reinforcement has the advantage of being effective for bridging cracks in any direction. Fiber reinforcement is also highly effective in transferring tensile stresses across cracks as soon as cracking initiates, as well as in fosterting the formation of multiple, closely spaced cracks. This is in contrast to shear stud reinforcement, shown in Fig. 1-6, which due to its reliance on mechanical anchorage at both ends (and often smooth surface) requires an appreciable crack width in order to be fully mobilized, with its detrimental effect on shear resistance through aggregate interlock. A new type of fiber reinforced concrete, referred to as High-Performance Fiber Reinforced Concrete (HPFRC), has shown significant promise for use in shear-critical elements (Parra, 25). Compared with regular fiber reinforced concretes, HPFRCs exhibit a strain-hardening behavior under direct tension with strain capacity often ranging between.5% and 3.%. The effectiveness of HPFRCs to enhance the seismic performance of structural members with shear-dominated behavior has been the subject of several research studies (Parra and Wight, 2; Canbolat et al., 25; Parra et al., 25). These investigations have shown that HPFRCs are effective in increasing shear resistance and deformation capacity of shear-critical elements, such as beam-column connections and coupling beams, while allowing for reductions or even elimination of steel transverse reinforcement. Further, in reversed cyclic displacement tests of HPFRC beams without transverse reinforcement (Parra and Chompreda, 26), a shear stress of ' 3 f c, where f ' c referred to the concrete cylinder strength measured in pounds per square inches, represented a lower bound for the shear resistance, regardless of the rotation demand. The inherent material ductility of HPFRCs, as well as their proven effectiveness to enhance the seismic behavior of structural elements, makes them attractive for use in slab-column connections in earthquake-prone regions. Although extensive research work conducted in the past three decades (Swamy and Ali, 1982; Diaz and Durrani, 1991; 4
19 Alexander and Simmonds, 1992; Shaaban and Gesund, 1994; Harajli et al., 1995; McHarg et al., 2; Lee et al., 28) has led to the conclusion that adding fibers to the concrete mixture could significantly enhance slab punching shear capacity, most of the experiments conducted to date have only included the effect of gravity load and thus, fiber effectiveness under earthquake-induced deformations is not well known. 1.4 RESEARCH OBJECTIVES The main objective of this research was to evaluate the potential of using steel fiber reinforced concrete in slab-column connections for increasing their punching shear strength and deformation capacity when subjected to earthquake-induced lateral displacements. The research was divided in three phases. In the following, a brief description of the scope of each phase and its objectives is provided. In the first stage, a series of slabs with different types of fiber reinforced concretes was tested under monotonically increased concentrated load. A total of five pairs of slabs, four pairs constructed with fiber reinforced concrete and one pair with regular concrete were tested. Two flexural reinforcement ratios were evaluated for each material. The main objectives of this research stage were: 1) to evaluate the potential of various fiber reinforced cement-based materials for increasing punching shear strength and deformation capacity of slab-column connections subjected to monotonically increased concentrated load; 2) to evaluate the influence of flexural reinforcement ratio and rotation on punching shear strength; and 3) to select the best materials for further study under earthquake-type loading. In the second research stage, the behavior of two approximately 1/2-scale slab-column connections constructed with the fiber reinforced concretes that showed the most promise, based on the results from the Stage 1 tests, was evaluated when subjected to combined gravity load and uni-axial lateral displacement reversals. The objectives of this research phase were: 1) to study the effect of gravity-induced shear on the rotation (and drift) capacity of fiber reinforced concrete slab-column connections subjected to uni-axial displacement reversals; and 2) to evaluate the effect of fiber geometry and strength on the 5
20 deformation capacity of connections subjected to combined gravity load and lateral displacement reversals. The final research stage was aimed at evaluating the behavior of fiber reinforced concrete connections under bi-axial lateral displacements, as well as that of a nominally identical connection reinforced with shear studs, which was intended to represent current design practice. For this purpose, three nearly full-scale slab-column subassemblies were tested under combined gravity load and bi-axial lateral displacement reversals. The objectives of this research stage were: 1) to evaluate the effect of bi-axial lateral displacements on the rotation capacity of fiber reinforced concrete slab-column connections; 2) to compare the seismic performance of the proposed fiber reinforced concrete connection design with that of a typical connection design with shear stud reinforcement; and 3) to evaluate the ability of shear stud reinforcement to resist punching shear stresses in connections subjected to combined gravity-induced shear and bi-axial rotations. Experimental work associated with Stages 1 and 2 was conducted at the University of Michigan Structural Engineering Laboratory, while testing associated with Stage 3 was conducted at the University of Minnesota NEES-MAST (Network for Earthquake Engineering Simulation - Multi-Axial Subassemblage Testing) Facility. 1.5 REPORT ORGANIZATION A review of relevant research work on the use of various types of reinforcement, including fibers, to increase punching shear capacity in slabs is provided in Chapter 2. Research on the behavior of isolated slabs constructed with different types of fiber reinforced concretes under monotonic, gravity-type loading is described in Chapter 3. Chapter 4 focuses on the behavior of fiber reinforced concrete slab-column connections subjected to combined gravity load and uni-axial displacement reversals. An evaluation of the behavior of slab-column connections reinforced with either randomly oriented fibers or headed shear studs under combined gravity load and biaxial displacement reversals is provided in Chapter 5. Conclusions and recommendations drawn from this research are given in Chapter 6. 6
21 CHAPTER 2 - LITERATURE REVIEW 2.1 REVIEW OF DESIGN PROVISIONS FOR PUNCHING SHEAR According to Moe (1961), the first design specification for punching shear in the United States was introduced by the Joint Committee in This committee proposed the following equation, V ' ν =.6 f c (2-1) bt ' where b is the perimeter of the loaded area, t is the total slab thickness and f c is the concrete compressive strength. In this equation, the calculated shear stress is not used as a measure of diagonal tension, but as a stress that would cause vertical sliding. In 1916, a report published by ACI (Committee on Reinforced Concrete and Buildings Laws, 1916) required that this punching shear stress be less than or equal to '.75 f c. The critical section for punching shear had a perimeter equal to that of the loaded area and a depth equal to the effective depth of the slab, d. At the time, shear stress was still not recognized as a measure of diagonal tension stress in slab-column connections. A check of both vertical shear and diagonal tension in flat-slab regions was first required by ACI in 192 (Standard Specifications No. 23, 192). For vertical shear, a shear stress V ν =, computed over the periphery of the loaded area, b, was not to exceed bd '.1 f c. On the other hand, a shear stress calculated along a perimeter a distance d away from the loaded area was used as a measure of diagonal tensile stress, as shown in Fig This stress was limited to '.35 f c. Later, in the 1941 ACI Building Regulations for Reinforced Concrete (ACI Committee 318, 1941), two shear stress limits were specified, '.25 f c and '.3 f c, depending on 7
22 the flexural reinforcement ratio in the slab. This shear stress was required to be evaluated on a critical section of depth t 1.5 in. that lied at a distance t 1.5 in. (approximately equal to d) from the edge of the loaded area. Design criteria for punching shear in flat-plate construction remained mostly unchanged through the 1947 and 1951 versions of the ACI Code (ACI Committee 318, 1947; 1951). In the 1956 ACI Code (ACI Committee 318, 1956), an upper boundary of 85 psi and 1 psi was set for the shear stress limit of '.25 f c and '.3 f c, respectively. Also, a critical section with depth d was defined as the periphery at a distance d from the edges of the column or column capital. The 1963 ACI Code (ACI Committee 318, 1963) required, for the first time, that shear stresses due to unbalanced moment caused by gravity load, wind or earthquake be investigated through a rational method. However, no guidance was given regarding the calculation of shear stresses due to unbalanced moment. The specifications for shear and diagonal tension were discussed within the context of both Working Stress Design (WSD) and Ultimate Strength Design (USD). Instead of expressing shear stress limits in terms of the concrete compressive strength, the use of the square root of the concrete compressive strength was believed to be more appropriate for evaluation of shear stress as a measure of diagonal tension resistance. For slabs without shear reinforcement, shear stress V ν = was not to exceed bd o ' 2 f c (psi) in WSD and ' 4 f c (psi) in USD. The perimeter of the critical section for punching shear, b o, was specified at a distance d 2 from the periphery of the loaded or support area. A few, but significant changes were introduced in the 1971 ACI Code (ACI Committee 318, 1971). In this code, design was based on ultimate strength, as opposed to working stresses. In connections without shear reinforcement, factored shear stresses at the critical section ( d 2 from the periphery of the loading area) due to gravity load and transferred moment were limited to ' 4 f c (psi). Based on research work done by Di Stasio and Van 8
23 Buren (196), shear stresses induced by unbalanced moment were assumed to vary linearly about the centroid of the critical section. An empirical expression, γ v, for the fraction of unbalanced moment, M ub, inducing shear stress was developed as a function of the critical section dimensions. The expression to calculate γ v has remained unchanged since then. The remainder portion of the unbalanced moment, γ f M ub, where γ f = 1 γ v, is to be transferred by flexure within the width of the critical section defined for punching shear. In a document published by ACI Committee 426 in 1974, the shear strength at the critical section ( d 2 from the periphery of the loaded area) of connections without shear reinforcement was assumed to range from a maximum of ' 4 f c (psi) down to ' 2 f c (psi), depending on the geometry of the loaded area. This was meant to account for the fact that as the aspect ratio of the column or loaded area increases, connection shear behavior deviates from a two-way action and approaches a one-way shear behavior. This transition in shear behavior was assumed to occur when the ratio of long and short side dimensions of a rectangular column or loaded area was larger than 2. Therefore, a new concrete shear stress limit was introduced in the 1977 ACI Code (ACI Committee 318, 1977) for connections without shear reinforcement, as follows, where v = + f f (psi) (2-2) ' ' c (2 4/ βc) c 4 c β c is the ratio of long side to short side dimensions of the column or loaded area. For connections with shear reinforcement (except shearheads), the nominal shear strength was, v = v + v 6 f (psi) (2-3) ' n c s c in which v c referred to the shear capacity contributed by the concrete, not to exceed ' 2 f c (psi), while v s referred to the shear capacity contributed by the shear reinforcement. Also, the portion of the unbalanced moment, γ f M ub, was to be transferred by flexure over a width of one and one-half slab or drop panel thicknesses (1.5h ) on each side of the column or capital (Fig. 2-2). This width, typically referred to 9
24 as slab effective width, has remained unchanged since then. From 1977 to 1989, the design of slab-column connections in the ACI Code remained relatively unchanged, except for some minor modifications to the expression for moment transfer within the slab effective width and detailing of flexural reinforcement. In the 1989 ACI Code (ACI Committee 318, 1989), however, a new shear stress limit for connections without shear reinforcement was introduced to account for test results that showed a decrease in v c with an increase in the ratio defined as follows, ' ( α 2) c s o c bo d. This shear stress limit was v = d b + f (psi) (2-4) where α s = 4, 3 or 2 for interior, edge or corner connections, respectively. The upper limit for the shear stress in a slab-column connection without shear reinforcement was then taken equal to the smaller of the values obtained from Eqs. (2-2) and (2-4) In the 1995 ACI Code (ACI Committee 318, 1995), the magnitude of unbalanced moment for connections in slab-column frames not designed as part of the lateral force-resisting system was calculated at twice the lateral displacement, obtained from an elastic analysis, due to the application of the factored lateral loads. In the 1999 ACI Code (ACI Committee 318, 1999), however, this provision was revised and the magnitude of the connection unbalanced moment had to then be determined at the design lateral displacement for seismic lateral loading. Based on test results, Pan and Moehle (1989) concluded that slab-column connections are able to sustain loading cycles up to 1.5% drift when the shear stress induced by gravity loads is less than or equal to approximately 4% of the connection direct punching shear strength. These results served as the basis for a new provision in the 22 ACI Code (ACI Committee 318, 22), in which a gravity-induced shear stress limit was established in earthquake-resistant slab-column connections in intermediate moment frames. This limit was expressed in the form of a maximum gravity shear ratio of 4%, ratio that is defined as the gravity-induced shear stress divided by the direct punching shear strength of the 1
25 connection (typically ' 4 f c, psi). In the 25 ACI Code (ACI Committee 318, 25), slab-column framed structures not designed as part of the lateral force-resisting system were explicitly required to be able to support the design gravity load under the design lateral displacement. Further, a gravity shear ratio versus drift interaction diagram, shown in Fig. 2-3, was provided in Chapter 21. In the 25 ACI Code, connection shear reinforcement was required unless 1) the shear stress due to gravity load and transferred moment under the design displacement was less than v c, or 2) a point drawn in Fig. 2-3, corresponding to the design story drift and gravity shear ratio, falls below the drift versus gravity shear interaction diagram. Shear reinforcement in slab-column connections in the form of headed shear studs was recently introduced in the 28 ACI Code (ACI Committee 318, 28). Contrary to other accepted types of shear reinforcement for which v c is limited to ' 2 f c (psi), an upper limit of ' 3 f c (psi) is allowed when headed shear stud reinforcement is used. Further, the maximum shear stress limit for connections with this type of reinforcement was set at ' 8 f c (psi.), 33% greater than that for connections with other types of shear reinforcement. 2.2 EXPERIMENTAL SETUP FOR REINFORCED CONCRETE SLAB-COLUMN CONNECTIONS The strength of slab-column connections, as specified in several editions of the ACI Code, has been historically based on results from experimental research. Because only isolated connections and not floor systems are generally tested, the selection of a test setup capable of reasonably simulating the effect of loads and deformations in the connection region is critical. A review of typical experimental setups used for the testing of slab-column connections under either gravity load alone or combined gravity load and lateral displacements, is provided in the following. 11
26 For specimens subjected to monotonically increased gravity-type load, the load is typically applied either at the center of the slab (Elstner and Hognestad, 1956; Moe, 1961; Namman et al., 27; Broms, 27 (a) ) or uniformly distributed around the slab (Hanson and Hanson, 1968; Corley and Hawkins, 1968), as shown in Figs. 2-4 and 2-5, respectively. Most specimens tested under concentric load are supported around the slab edges with the corners free to lift (Elstner and Hognestad, 1956; Moe, 1961; Sieble et al., 198; Swamy and Ali, 1982; Harajli et al., 1995; Namman et al., 27), as shown in Fig. 2-4(a). In order to more accurately simulate points of contraflexure, specimens tested by Broms (27 (a) ) and Brikle and Dilger (28) were supported at discrete points around the slab perimeter, as shown in Fig. 2-4(b). The application of a distributed load on the slab while simply supporting the column at both ends has been another test method used for slabs subjected to monotonically increased gravity-type load. Hanson and Hanson (1968) tested three specimens by applying distributed loads along two opposite edges of the slab, as shown in Fig. 2-5(a). However, the test results showed that the specimens acted as wide-beams and not two-way slabs. Instead of being subjected to distributed loads along two sides of the slab, the specimens tested by Corley and Hawkins (1968) were loaded monotonically at eight points around the perimeter of the slab, as shown in Fig. 2-5(b). For specimens subjected to combined gravity load and unbalanced moment induced by lateral displacements, two methods have been often used for load application, as illustrated in Fig For example, in the tests of interior connections conducted by Hawkins et al. (1974), gravity load was simulated by four point loads, as shown in Fig Unbalanced moment, on the other hand, was induced by applying an upward and downward displacement at the edges of the slab. These two loadings are close to a combination of cases (b) and (d) in Fig An experimental setup in which uniform distributed load is applied around the slab and lateral displacements are applied at the top of the column was used by Robertson et al. (22), similar to cases (b) and (c) in Fig In the tests by Pan and Moehle (1989), gravity load was simulated by lead blocks uniformly distributed on the slab and by an upward jacking of the column at its base, as 12
27 in cases (a) and (b) of Fig In other tests (Elgabry and Ghali, 1987), gravity load has been almost entirely simulated through column jacking (case (a) in Fig. 2-6). This method of simulating gravity load, although convenient, does not properly represent the moment and shear gradients in the connection region. Limitations associated with typical specimens tested under combined gravity load and lateral displacement reversals were recently discussed by Broms (27 (b) ). Particular attention was paid to the use of simple supports at slab mid-span, which may be questionable when slab moments are primarily induced by gravity load. This limitation has been addressed in the past by adjusting the sequence of application of load and support conditions, as shown in Fig. 2-8 (Dovich and Wight, 1994). To the writer s knowledge, there is no widely accepted experimental setup for the test of slab-column connections under combined gravity load and lateral displacements. As described in Chapter 3, the setup used in this investigation for the testing of slab-column connections under monotonically increased gravity-type load was similar to that in Fig. 2-4(a). Recognizing the limitations of simulating gravity load through an upward jacking of the column base, a different approach was followed for gravity load simulation in the tests under combined gravity load and lateral displacements. In this case, gravity load was simulated through a series of prestressing cables pulling down on the slab at discrete locations. Details of this test setup are provided in Chapters 4 and DRIFT CAPACITY OF SLAB-COLUMN CONNECTIONS Ductility of slab-column framed systems is mostly provided by the rotational capacity of the connections, given the much larger stiffness and strength of columns in typical systems (Robertson and Durrani, 1991). This was verified by Kang and Wallace (24), who found that connection rotation and drift ratio are approximately equal for specimens with stiff columns. However, because of convenience and simplicity, drift remains the most popular measurement to characterize deformation capacity in slab-column connections. 13
28 Conventional design of slab-column connections up to the 199s involved a check of shear stresses induced by direct shear and eccentric shear (due to unbalanced moment) against the nominal capacity of the connection, v n. As discussed by Moehle (1996), the drift used for calculating connection actions, however, was substantially smaller than the drift obtained from the application of unreduced lateral forces to a linear elastic system. For the range of periods over which the peak displacement of an elastic and an inelastic system are comparable, this practice could have led to a substantial underestimation of expected drift for a design-level earthquake. As also pointed out by Moehle, a major deficiency in this design procedure was the lack of consideration of connection deformation capacity and the effect gravity shear has on it. Research work by Wight and Sozen (1973) led to the conclusion that shear strength of reinforced concrete columns decays with increasing displacement and number of cycles. Moehle (1996) applied a similar concept to slab-column connections and proposed that slab-column connections be detailed for sufficient drift capacity which, as research results had clearly indicated (Pan and Moehle, 1989; Robertson and Durrani, 1992; Megally and Ghali, 1997; Robertson and Johnson, 26), is highly influenced by the magnitude of gravity shear in the connection. A research study by Pan and Moehle (1989) indicated that lateral drift capacity of slab-column connections is highly dependant on the gravity shear ratio, Vg V c, where V g is the shear induced by gravity load and V c is the shear resistance attributed to the concrete. Results from the tests of four slab-column subassemblies, two of these subjected to uni-axial lateral displacement cycles and the other two to bi-axial lateral displacement cycles, led to the conclusion that an increase in gravity shear ratio and/or application of bi-axial lateral displacements led to a reduction in connection strength, stiffness and displacement capacity. An upper limit for the gravity shear ratio of.4 was recommended in order to ensure a minimum drift capacity in the order of 1.5%. Attention to the effect of gravity shear ratio on connection behavior was also given by Robertson and Durrani (1991; 1992). Three nominally identical one-story, two-bay 14
29 slab-column frames subjected to various levels of gravity load were tested under the same cyclic lateral displacement history. These tests confirmed the previous finding that an increase in gravity shear results in a decrease in the lateral drift capacity of the connection. Gravity shear ratios of.5 and.35 were suggested for exterior and interior connections, respectively, in order to ensure a minimum drift capacity of approximately 1.5%. Another investigation conducted by Durrani et al. (1995), in which four two-bay, one-story slab-column frames were tested under earthquake-type loading revealed a rapid stiffness degradation and significant reduction in drift capacity under increasing gravity load. In this research, a gravity-induced shear stress in the connection of ' 1.5 f c (psi) was associated with a 2% drift capacity. A drift-based punching shear failure model for interior slab-column connections was first proposed by Luo and Durrani (1995) and later revised by Hueste and Wight (1999). Based on regression analysis of data from interior slab-column connection tests, Luo and Durrani described the relationship between drift capacity and gravity shear ratio through three expressions. In their model, a parabolic curve was used for gravity shear ratios between approximately.15 and.54, while a linear relationship was used for both lower and higher gravity shear ratios. In this model, any point above the proposed envelope indicates prediction of a punching shear failure. A simple tri-linear envelope was later proposed by Hueste and Wight (1999). In their model, a minimum drift capacity of.5% was assumed. Drifts between.5% and 1.5% were associated with gravity shear ratios of 1. and.4, respectively, while a 4% drift was associated with a gravity shear ratio of.2 (Fig.2-9). No upper drift limit was specified for gravity shear ratios below.2. Results from prior tests of interior slab-column connections that experienced a punching shear failure are summarized in Table 2-1. It should be noted that some specimens developed a well-defined flexural yielding mechanism before failing in shear. Two drift ratios are presented in the table. First, the drift at peak lateral load, which is reported by most researchers and is usually used as an indicator of the displacement at which 15
30 maximum combined shear stress occurred. Also shown in the table, when available, is the ultimate drift. This drift is defined as the displacement at which the specimen failed in punching shear and a substantial loss of moment resistance was observed. Load redistribution occurred during the test of most specimens listed in Table 2-1 due to cracking and yielding of the slab. Thus, two gravity shear ratios are compared: 1) the gravity shear recorded at peak lateral load and 2) the connection shear recorded before application of the lateral load, also referred to as target gravity shear ratio or initial gravity shear ratio. Maximum relative rotation between the slab and the column is also given in the table along with the location of rotation measurement, if available. Fig 2-1 shows a plot of drift at peak load versus target gravity shear ratio, while Fig shows the drift at peak load versus gravity shear at peak load for the compiled experimental data. Also shown in the figures is the drift versus gravity shear ratio relationship used in the ACI Building Code (ACI Committee 318, 28). These test results provide further evidence that an increase in gravity shear results in a decrease in drift capacity of slab-column connections. From Figs. 2-1 and 2-11, it can also be seen that the ACI drift versus gravity shear relationship becomes less conservative when gravity shear ratio at peak load, as opposed to initial gravity shear, is used. 2.4 SHEAR REINFORCEMENT FOR SLAB-COLUMN CONNECTIONS As discussed above, slab-column connections subjected to large gravity shear ratios exhibit a rather limited drift capacity. One way to address this limitation is to add shear reinforcement to the connection in order to increase its shear resistance and deformation capacity. In the following, the most common types of slab shear reinforcement are briefly introduced Bent-up Bars This type of reinforcement was widely evaluated by several researchers during the 195 s because of its simplicity (Hawkins, 1974). Elstner and Hognestad (1956) tested thirty nine isolated interior slab-column connections under monotonic gravity-type loading, 16
31 several of them reinforced in shear by bent-up bars. Examination of the failure in specimens reinforced by 45-degree bent-up bars suggested that failure may have been caused by local crushing of the concrete under the bends of the bent-up bars. When 2-degree bent-up bars were used, local concrete crushing was not obvious and a 3% strength increase was obtained compared to a similar slab without shear reinforcement. From strain gauges located at the center of the inclined leg of the bent-up bars, it was noticed that none of the bent-up bars, either with 2-, 45- or 9-degree bends, had reached yielding at failure. Elstner and Hognestad found it impractical to fully develop the flexural capacity of relatively thin slabs by using bent-up bars as shear reinforcement. Yielding of the bent-up bars at the critical section of the connection was observed in a test (Islam and Park, 1976) of a slab-column connection specimen reinforced by two approximately 35-degree No. 3 bent-up bars (Fig. 2-12) under combined gravity load and monotonically increased lateral displacement. In this test, although the use of bent-up bars led to an increase in connection strength, no noticeable increase in ductility was observed. Contrary to the findings by Elstner and Hognestad, and Islam and Park, Dilger and Ghali (1981) claimed that bent-up bar reinforcement is not fully effective for punching shear resistance because of insufficient anchorage that results from local crushing of the concrete under the bends. More recently, Broms (2) reported on the monotonic tests of two specimens reinforced by 35-degree bent-up bars in each principal direction. The results showed that bent-up shear reinforcement had limited effect on slab punching shear capacity and ductility. In summary, previous research seems to indicate that the ultimate punching shear resistance of slab-column connections may be modestly improved by using bent-up bars as shear reinforcement, provided that they are well anchored (Hawkins, 1974; Ghali and Hammill, 1992; Polak, et al., 25). However, bent-up reinforcement does not seem to be effective in increasing connection deformation capacity Closed Stirrups Research by Islam and Park (1976) showed that closed stirrups or hoops engaging top 17
32 and bottom flexural reinforcement, as shown in Fig. 2-13, are effective in enhancing the deformation capacity of slab-column connections. Hanna et. al. (1975) also concluded that slab-column connections with closed stirrups behave in a ductile manner. The use of closed stirrups, with 135-degree hooks and engaging one or more top and bottom flexural bars, was recommended. Four slab-column subassemblies, each consisting of one interior and one exterior connection, were tested under combined gravity load and monotonically increased lateral displacement by Pillai et al. (1982). One specimen was reinforced by closed hoops. They reported that the specimen reinforced by hoops exhibited a connection rotation capacity twice as large as that of the specimen without shear reinforcement, allowing for substantial load redistribution. Robertson et. al. (22) tested four approximately half-scale interior slab-column connections under combined gravity-type load and lateral displacement reversals, one of them reinforced with closed stirrups. This specimen sustained drift cycles of up to 8% drift without failing by punching shear. Readings from strain gauges indicated that the connection shear reinforcement remained elastic throughout the test. However, the applied gravity shear ratio was only.16 and thus, extrapolation of the results to connections with higher gravity shear ratios is questionable. Although closed stirrups have been found to be effective in enhancing the shear strength and ductility of slab-column connections, this type of shear reinforcement is difficult to install, particularly in slabs with thickness less than 1 in. (MacGregor, 25). Also, as reported by Hawkins et al. (1975), closed stirrups should engage longitudinal reinforcing bars in each corner to be fully effective. Because of this, closed stirrups are seldom used as slab shear reinforcement in flat-plate construction Shearheads Shearheads consist of structural steel shapes (typically I or C shapes) embedded in the slab in the vicinity of the column (Fig. 1-4(e)). By strengthening the slab in the regions 18
33 adjacent to the column, the critical section in connections with shearheads is enlarged, leading to an increase in punching shear resistance. The effectiveness of this type of reinforcement was evaluated by Corley and Hawkins (1968). Despite their structural efficiency, Dilger and Ghali (1981) pointed out several drawbacks associated with shearheads. In particular, fitting a structural steel shape in between the top and bottom layers of reinforcement would require, for typical slab thicknesses, sections shallower than those commercially available. Interference problems and installation difficulties were also cited as drawbacks of shearhead reinforcement Shear Studs Shear reinforcement consisting of individual vertical bars with mechanical anchorage at both ends was first investigated by Langohr et al. (1976). From this research, it was concluded that punching shear failure in flat-plate systems can be prevented by using this type of shear reinforcement, especially when arranged radially from the column. For the purpose of simplicity and accurate placement of individual shear studs, the use of rails of studs in slab-column connections subjected to monotonically increased gravity-type load was first investigated by Seible et al. (198). Because of the high ductility exhibited by a test specimen with the proposed shear reinforcement, they concluded that headed studs welded to strips and arranged perpendicularly to the column faces are a simple and cost-effective type of shear reinforcement. For adequate anchorage, the diameter of the head was recommended to be at least four times the stem diameter (area of the head greater than or equal to 16 times the cross-sectional area of the stem). Headed shear stud reinforcement with a minimum head area of ten times the stem cross-sectional area was recommended by Dilger and Ghali (1981), based on results from slab-column connection tests under monotonic gravity-type loading, They also claimed that the use of well anchored headed reinforcement allows the upper limit to the nominal shear stress resistance to be raised to ' 8 f c (psi), the concrete providing a contribution 19
34 of ' 3 f c (psi) for connections with square columns. A total of five specimens, four with headed shear studs, were tested under combined gravity load and lateral displacements by Elgabry and Gahli (1987). The experimental setup used was a combination of configurations (a) and (c) in Fig The test results confirmed the validity of the design provisions suggested by Dilger and Ghali (1981). Results from the tests of five full-scale connection specimens (Megally and Ghali, 2), also using a test setup representing a combination of configurations (a) and (c) in Fig. 2-6, showed that headed shear studs are also effective in edge slab-column connections. Robertson et al. (22) reported on the tests of half-scale slab-column connections reinforced with either hoops, single-leg stirrups or shear studs under combined lateral loading and relatively low levels of gravity load. They concluded that these three types of shear reinforcement are equally effective in contributing to punching shear resistance. However, shear stud reinforcement was found to be more practical from a construction viewpoint. Kang and Wallace et al. (25) reported on the shake-table tests of two approximately 1/3-scale, two-story slab-column frame systems with connections reinforced with shear studs. One of the two slab systems was postensioned. The design gravity shear ratio for the interior connections in the non-prestressed slab system was.25. Punching shear failure of an interior connection in that system first occurred at approximately 2.5% drift. Punching shear failure of an exterior connection (design gravity shear ratio of.2), on the other hand, first occurred at 3.1% drift. It should be noted that these drift ratios are substantially lower than those obtained from quasi-static tests of isolated connections (Robertson et al, 22; Megally and Gahli, 2). With respect to the post-tensioned slab-column system, the design gravity shear ratio was.33 and.25 for interior and exterior connections, respectively. Punching shear failures of connections in that system occurred at drifts ranging from 2.8% to 4.2% drift. An evaluation of the behavior of slab-column connections with shear stud reinforcement under combined gravity-type load and either uni-axial or bi-axial lateral displacement 2
35 reversals was conducted by Tan and Teng (25). Five approximately ¾-scale interior connection subassemblies, two of them with shear stud reinforcement, were tested. The columns in the test specimens were highly rectangular, with a ratio of long to short side dimension of 5. For the uni-axial lateral displacement tests, the displacements were applied in the direction perpendicular to the long side of the column. The connections reinforced with shear studs were subjected to a gravity shear ratio of.28. The specimen with shear stud reinforcement subjected to bi-axial lateral displacement reversals failed in punching shear at 4% drift, while the other specimen, subjected to uni-axial lateral displacement reversals, exhibited a flexural failure at 8% drift. Broms (27 (a) ) reported on brittle failures of two slab-column connections reinforced with shear studs when subjected to monotonically increased concentrated load. The slab in these two specimens contained a substantial amount of flexural reinforcement (ratios of 1.29% and 1.21%). Based on results from slab-column connection tests under combined gravity load and lateral displacement reversals, Broms, (27 (b) ) concluded that the upper shear stress limit of ' 8 f c (psi) in the ACI Building Code (28) is unconservative for connections with headed shear studs. 2.5 FIBER-REINFORCED CONCRETE IN SLAB-COLUMN CONNECTIONS Fiber reinforcement has long been known to enhance the mechanical properties of concrete by providing post-cracking tensile resistance. However, only limited experimental studies have been conducted on the use of fibers to increase punching shear resistance of slabs. Relevant research projects conducted to date on the subject are introduced briefly below. Nineteen full-scale specimens that simulated interior slab-column connections were tested by Swamy and Ali (1982). All specimens were simply supported along the four edges of the slab with the corners free to rise. The slabs were loaded monotonically through a column stub, as shown in Fig. 2-4(a). Experimental results showed that the addition of steel fibers (hooked or crimped) in a 1% volume fraction resulted in a 4% reduction of service load deflection and a 3% increase in slab punching shear capacity. 21
36 Swamy and Ali concluded that, by providing fibers, a brittle punching shear failure in a slab-column connection could be transformed to a gradual, somewhat ductile shear failure. Inspection of the specimens after the tests revealed that the addition of fibers led to an increase in the horizontal projection of the punching failure surface. Providing fibers over a distance of 3h from the column face, where h is the slab thickness, was proven to be as effective as adding fibers over the entire slab. Contrary to the findings by Swamy and Ali (1982), results from the tests of thirteen slab specimens conducted by Shaaban and Gesund (1994) showed that the addition of corrugated steel fibers did not affect the angle of inclination of the failure surface relative to the slab plane. In their tests, this angle ranged between 16 and 2 degrees. The addition of fibers, however, was found to significantly increase the punching shear strength of the slabs. Results from the tests of six slab specimens by Alexander and Simmonds (1992), with an experimental setup similar to that shown in Fig. 2-4(b), indicated that the use of corrugated steel fibers in a dosage of approximately.4% by volume led to an increase in punching shear capacity of about 2%. Doubling the fiber content (.8%) led only to a 7% further increase. Although all specimens failed in punching shear, it was concluded that the addition of fibers leads to an increase in the punching shear capacity and ductility of slab-column connections. Two types of fibers, steel hooked fibers and polypropylene fibers, were compared in the experiments conducted by Harajli et al. (1994). Twenty four specimens were tested under monotonically increased gravity-type load using a test setup similar to that shown in Fig. 2-4(a). No significant differences were observed between the two types of fibers in terms of ductility. However, polypropylene fibers were not as effective as hooked steel fibers in increasing punching shear resistance. The addition of steel hooked fibers in a 2% volume fraction led to an increase in the ultimate shear resistance of about 36%. The presence of fibers also resulted in an enlarged projection of the failure cone on the slab plane, as previously reported by Swamy and Ali (1982). 22
37 McHarg et al. (2) reported on the tests of six slab-column connections under monotonically increased gravity-type load using a similar setup to that shown in Fig. 2-5(b). The use of steel hooked fibers in a.5% volume fraction up to a distance of 3.3h from the column faces resulted in a significant improvement in performance. This included an increase in punching shear resistance, ductility, and post-cracking stiffness, and a decrease in crack width at service load. More recently, Naaman et al. (27) reported on the monotonic tests of ten slabs using the same experimental setup shown in Fig. 2-4(a). Nine of those specimens were constructed with fiber reinforced cement composites (either mortar or concrete). The parameters studied included fiber type, cement-based material, and flexural reinforcement layout. Twisted steel fibers (Torex), developed by Naaman (1999), in a 2% volume ratio were shown to offer the best potential for performance enhancement in terms of ductility, energy absorption and punching shear resistance. From their limited test data, Naaman et al. suggested that the punching shear resistance of slabs with geometry similar to that of the specimens tested and constructed with high performance fiber-reinforced cement composite, (HPFRCC), could be taken as ' 8 f c (psi). To the writer s knowledge, Diaz and Durrani (1991) are the only researchers that, prior to this research, had evaluated the use of fiber reinforced concrete in slab-column connections subjected to combined gravity load and lateral displacements. They tested three interior and three exterior subassemblies. The experimental setup used for the interior subassembly tests was a combination of configurations (b) and (c) in Fig A simple support along the two sides of the slab perpendicular to the loading direction was provided. A gravity load that translated into a gravity shear ratio of approximately.2 was applied through concrete blocks hanging from the slab at several locations. Crimped steel fibers were added to the connection over a region with a radius of 48 in. (approximately 4.2h from each column face). Three volume fractions were evaluated, 1.11%,.76% and.38%. 23
38 The specimens with a 1.11% and.76% fiber volume fraction did not show a very well defined failure. At 7% drift, the maximum applied displacement, both specimens were able to sustain 9% of the peak lateral load. The specimen with a.38% volume fraction of steel fibers, on the other hand, failed by punching at 6% drift. Rotations in the specimens with larger fiber volume fractions (1.11% and.76%), measured over 6 in. from the column faces (1.33h), exceeded.6 radians. The specimen with a.38% fiber volume content failed in punching shear at a connection rotation of.5 radians. Based on their test results, Diaz and Durrani concluded that the optimum fiber volume content for interior slab-column connections is somewhere between.38% and.76%. The experimental setup used for the three exterior specimens was similar to that used for the interior subassembly tests. However, a simple support was provided only along one side of the slab perpendicular to the loading direction. All three specimens reinforced with fibers in a volume ratio of either 1.11%,.76% or.38% were able to sustain displacement cycles of up to 7% drift under a target gravity shear ratio of SUMMARY Connections in slab-column frames not designed as part of the lateral-force resisting system are vulnerable to punching shear failure during earthquakes due to a combination of an increase in shear stresses and inelastic deformation reversals caused by earthquake-induced lateral displacements. Results from experimental research have provided ample evidence that lateral displacement capacity of slab-column connections is highly dependent on the level of shear induced by gravity loads. Current design philosophy requires that slab-column connections be able to carry the gravity loads when subjected to the design lateral displacement. Typically, a gravity shear ratio versus drift capacity interaction diagram is used to determine whether shear reinforcement should be added to the connection. Several types of steel reinforcement, particularly shearheads and headed shear studs, have been shown to be successful in preventing punching shear failure in slab-column connections. However, shear stud 24
39 reinforcement has been shown to be substantially more practical than shearhead reinforcement. A potential alternative to traditional shear reinforcement in slab-column connections is randomly oriented fiber reinforcement. Results from past research have clearly shown that the addition of modest amounts of deformed steel fibers (corrugated, hooked or crimped) to the concrete leads to an increase in the punching shear capacity and ductility of slab-column connections when subjected to monotonically increased concentrated load. In some instances, a superior post-punching behavior has also been obtained (Swamy and Ali, 1982; Naaman et al., 27). Results from seismic tests of shear-critical elements (Parra and Wight, 2, Parra and Chompreda, 25; Canbolat et al., 25; Parra et al., 25) constructed with strain-hardening fiber reinforced cement composites, on the other hand, suggest that fiber reinforcement could also be effective for punching shear resistance in connections subjected to inelastic deformation reversals, such as those induced by earthquakes. Prior to this research, the behavior of fiber reinforced concrete slab-column connections under combined gravity load and lateral displacement reversals was not well known. Thus, a comprehensive experimental research program was undertaken to generate needed information that would help understand the role fiber reinforcement plays on the seismic behavior of slab-column connections and its ability to increase their strength, deformation capacity and damage tolerance. 25
40 CHAPTER 3 - BEHAVIOR OF FIBER REINFORCED CONCRETE SLABS UNDER MONOTONICALLY INCREASED PUNCHING SHEAR 3.1 INTRODUCTION Ten slab-column subassemblies constructed with either regular concrete or fiber reinforced concrete (FRC), including strain-hardening high-performance fiber reinforced concrete (HPFRC), were tested under monotonically increased gravity-type loading. This testing phase served two purposes: 1) to select the fiber reinforced concrete materials with the best potential for use in slab-column connections subjected to earthquake-induced deformations, and 2) to estimate an upper limit for slab punching shear strength that could be compared with the strength of slab-column connections subjected to combined gravity load and lateral displacement reversals. Selection of fiber reinforced concrete materials for potential use in earthquake-resistant slab-column connections was based on punching shear strength, ductility and construction practicality, while keeping fiber volume fraction and cost at a minimum. 3.2 TEST SPECIMENS Ten specimens, which represented isolated interior slab-column connections, were tested under monotonically increased punching shear load. The applied slab loading was meant to simulate, in a simple manner, shear and bending effects on interior connections of a regular two-way flat-plate floor system (neglecting unbalanced moments). The slab 26
41 dimensions were the same for all ten specimens, 5 x 5 x.5 ft, with a 6 in. square column stub at the center of the slab for load application. Fig. 3-1 shows a sketch of the slab specimens and test setup. The slab specimens were tested upside down, which meant that tension in the connection region was induced at the bottom of the slab, as opposed to the top, as is the case in connections of flat-plate construction subjected to gravity loads. Only bottom flexural reinforcement was provided in the slab specimens (Fig. 3-2). Two slabs were tested for each type of fiber reinforced concrete (or regular concrete) evaluated. One specimen contained flexural reinforcement at a.56% ratio in each principal direction, while the reinforcement ratio for the other specimen was.83%. The same reinforcing bar size (No. 4, i.e. ½ in. diameter) was used in all test specimens and thus, only the bar spacing was varied between the two specimens tested for each material evaluated. The bar spacing was either 4 in. (Specimens S1, S3, S5, S7 and S9) or 6 in. (Specimens S2, S4, S6, S8 and S1). All reinforcing bars were made of Grade 6 steel. The effective depth d, taken as the average value for both reinforcement directions, was equal to 5 in. The main parameters evaluated in this testing phase were steel fiber geometry, fiber steel strength, fiber content, and flexural reinforcement ratio. Table 3-1 summarizes the main features of each specimen. It is worth mentioning that fiber reinforced concrete in specimen pairs S5 and S6, and S9 and S1 was only used within a 3 in. square portion at the center of the slab (two slab thicknesses from each column face), as shown in Fig
42 3.3 MATERIAL PROPERTIES Concrete Mixtures Proportions: All concrete mixtures were designed for a 28-day compressive strength of approximately 5 psi. Course aggregate in the concrete mixtures consisted of crushed limestone with a maximum size of 1/2 in. In specimen pairs S1 and S2, S3 and S4, and S7 and S8, concrete mixtures (with or without fibers) were obtained from a local ready-mix concrete supplier. Concrete used outside the slab central region (3 x 3 in.) of specimen pair S5 and S6 was mixed in the laboratory with proportions by weight of 1:.49:2.95:2.65 (Type III Cement: Water: Coarse Aggregate: 2NS Sand), where 2NS sand, according to Section 92 of the 23 Standard Specifications for Construction of the Michigan Department of Transportation (Aggregate Div., Levy Corporate, Aug 28, refers to natural sand with particles sized from 3/8 in. to mesh #2 (diameter of.295 in.). Mortar, as opposed to concrete, was used in the central region of Specimens S5 and S6, with proportions by weight of 1:.4:1:.15 for Type III cement, water, fly ash and #16 Silica Sand. This sand is a product referred to as Flint Silica #16, manufactured by U.S. Silica Company, with sand particles sized from mesh #2 (diameter of.3346 in.) to mesh #14 (diameter of.417 in.). The same concrete mixture proportions used in Specimens S5 and S6 were used in Specimen S9, while in Specimen S1, a concrete mixture with proportions 1:.48:1.45:1.55 (Type III Cement: Water: Coarse Aggregate: 2NS Sand) was used. 28
43 Mixing Process: For Specimen S5 and S6, regular concrete was mixed in a 5 cubic feet mixer, while the fiber reinforced mortar used in the central portion of the specimens was mixed in a 1.5 cubic feet mixer (Fig. 3-4). Due to the capacity of the mixers, three batches of both regular concrete and fiber reinforced mortar were required for each specimen. Once the mixing process was completed, the two materials were then poured either in or outside the central 3 x 3 in. square portion of the slab (Fig. 3-3). As shown in the figure, a plexiglass formwork was used to keep both materials separate while casting. Once the casting process was completed, the central formwork was removed and modest vibration was applied to ensure adequate material transition between the central and outside portions of the slab. For specimen pair S9 and S1, both regular and fiber reinforced concretes were mixed with the same 5 cubic feet mixer used in Specimens S5 and S6. A total of five batches were required, batches 2 and 4 corresponding to fiber reinforced concrete. The concrete casting process for Specimens S9 and S1 was the same as that for Specimens S5 and S6. It should be mentioned that the concrete mixture used in Specimen S9 showed poor workability during casting, which led to significant air voids that had to be later patched. Although concrete slump was not measured before fibers were added into the mixer, it was visually clear that it was rather low. Based on this limited experience, a minimum concrete slump of 6 in. prior to the addition of steel fibers is recommended when hooked fibers in a 1.5% volume fraction are used. Compression Strength: Three 4 x 8 in. cylinders were prepared for each cement-based material (concrete or 29
44 mortar) and tested for determination of average compressive strength within a week either before or after each slab test. Tests were conducted using an Instron testing machine operated under displacement control. Table 3-2 summarizes the cylinder strengths for each cement-based material Steel Fibers Three types of steel fibers were used in this testing phase. The first fiber type evaluated was a Dramix ZP 35 hooked fiber, manufactured by Bekaert Corporation. This fiber is 1.2 in. long and has a circular cross section with a.2 in. diameter. The specified tensile strength of the fiber wire, as reported by the manufacturer, is 16 ksi. These fibers were used in specimen pairs S3 and S4, and S7 and S8. The second fiber type used in this testing phase was manufactured by Politorx under the brand name Helix. This fiber, twisted along its length, was 1.4 in. long and had a triangular cross section with an equivalent diameter of.2 in. The specified tensile strength of the wire used to manufacture this type of Helix fibers was 26 ksi. Helix fibers were used in Specimens S5 and S6. The third type of fiber was a Dramix RC-8/3-BP hooked fiber, also manufactured by Bekaert Corporation. This fiber is 1.2 in. long and.15 in. in diameter. The specified tensile strength of the wire used to manufacture this fiber, as reported by Bekaert Corporation, is 335 ksi. Limited information on the performance of these three types of fibers in large-scale 3
45 structural tests is available. Chompreda and Parra (25) reported on test results from direct tensile tests of FRC (mortar) with Dramix ZP35 fibers. They found that a fiber volume fraction less than or equal to 1.5% led to a tensile strain-softening behavior. On the other hand, results from direct tensile tests (Liao et al., 26) on FRC mixtures with high-strength hooked steel fibers (Dramix RC-8/3-BP) revealed that strain-hardening behavior can be achieved with a 1.5% fiber volume fraction. The tensile behavior of FRC (mortar) with the Helix fibers used in this study was not known. However, it was expected to be similar to that of FRC with regular strength hooked steel fibers (Dramix ZP35). In summary, limited research results suggest that if fiber volume content is limited to 1.5% only high-strength hooked steel fibers have the potential to develop strain-hardening behavior. Direct tensile tests and flexural tests of the various types of fiber reinforced concretes used in the test specimens were not performed at this experimental stage. As mentioned earlier, fiber reinforced concretes would be selected based on punching shear strength, ductility and construction practicality. Flexural tests, however, were conducted in the other two experimental phases and the results are reported in Sections and Reinforcing Steel Reinforcing bars in all ten specimens were made of Grade 6 steel. Measured yield and peak strengths, obtained through tensile tests of sample bars, are listed in Table 3-3. Steel reinforcement was ordered separately for each pair of specimens, except for Specimens S7 through S1, for which the steel came from a single order. For each steel bar shipment, five coupons were randomly selected for tensile testing. 31
46 3.4 TEST SETUP AND INSTRUMENTATION ARRANGEMENT A vertically oriented hydraulic actuator, connected to a steel reaction frame, was used for application of the load to the slab specimens, as shown in Fig The test specimens were supported along their perimeter on a.5 in. thick neoprene pad placed on top of a steel tube with cross section 3 x 5 x.25 in. in order to simulate a simply supported boundary condition. The load at the column stub was applied through a monotonically increased displacement at a rate of.15 in/min. Twelve strain gauges were attached to the reinforcing bars of each specimen at locations adjacent to the column stub. The location of the strain gages is shown in Fig Six strain gauges (three in each principal direction) were located at.5d away from the column faces. The remaining six strain gauges were located on the same reinforcing bars, but at 1.5d away from the column faces. Slab rotations were measured over a distance of 12 in. from each column stub face through four pairs of potentiometers, as shown in Fig Data were collected through a Data Acquisition System (MEGADAC 3415AC, OPTIM Electronic Corporation) at a 1Hz sampling rate. Tests were terminated when a significant loss of load carrying capacity was observed. 3.5 EXPERIMENTAL RESULTS Observed Damage At the end of each test, the specimens were flipped over in order to mark cracks on the 32
47 bottom (tension) side of the slab. Crack patterns at failure for all ten specimens are shown in Fig In all tests the column stub was clearly seen to punch through the slab. However, cracking on the slab bottom surface did not always give a clear indication that a punching shear failure had occurred. For instance, while the crack pattern on the slab bottom surface for Specimen S3 is typical of a punching shear failure (Fig. 3-5(c)), that observed in Specimen S6 is indicative of flexural yielding (Fig. 3-5(f)). It is believed that after initiation of the punching shear failure, the slab flexural reinforcement worked as a membrane that was able to accommodate the large column stub vertical displacement and prevented the punching cone from surfacing at the bottom of the slab. Removal of bottom cover in the fiber reinforced concrete specimens was not possible without the use of a concrete saw or other specialized equipment that would have required the hiring of an external contractor. Given the limited funds allocated to this testing phase and the fact that the column stub was clearly seen to punch through the slab at failure in all ten specimens, the option of further investigating the failure mode of the test slabs by cutting the concrete specimens was not pursued Load versus Deflection Relationship The magnitude of the load was recorded directly from a load cell attached to the vertical actuator. The applied displacement, on the other hand, was calculated by subtracting the displacement associated with deformations in the reaction frame, (see fishing wire in Fig. 3-6) from the actuator displacement, which was measured by a Linear Variable Differential Transformer (LVDT). It should be mentioned that for Specimens S3 and S4, displacements associated with deformations in the neoprene pad and steel support were 33
48 measured through a linear potentiometer, as shown in Fig The measured support-related deflections for these two specimens were below.1 in. and thus, this deflection component was neglected in the remaining eight specimens. In general, specimens with 4 in. rebar spacing showed greater initial stiffness and higher peak load compared with their counterpart specimens with 6 in. rebar spacing. However, because failure in the specimens with 4 in. bar spacing occurred prior to or after limited flexural yielding, these specimens showed little or no ductility. On the other hand, flexural yielding preceded failure of the specimens with 6 in. rebar spacing, leading to increased ductility, particularly for the slabs with 1.5% volume fraction of steel fibers (Specimens S6, S8, and S1). Fig. 3-7 shows the applied load P versus deflection responses for the ten slab specimens. Two separate plots are provided, one corresponding to a flexural reinforcement ratio ρ in each principal direction of.83 (4 in. bar spacing) and the other to a reinforcement ratio of.56 (6 in. bar spacing). For comparison purposes, Fig. 3-8 shows the specimen responses in terms of the average punching shear stress (P/b o d), normalized by the square root of the concrete cylinder strength, f ' c. The critical perimeter, b o, was calculated according to the ACI Building Code (25) and was equal to 44 in. This critical perimeter is the same as that in the 28 ACI Building Code (28). As mentioned earlier, Specimen S9 had to be patched due to air voids caused by poor concrete workability, which was believed to be the cause of the lower stiffness exhibited 34
49 by Specimen 9 (Figs. 3-7(a) and 3-8(a)). Thus, the test results for this specimen may not be reliable and should be taken with caution. From Figs. 3-7 and 3-8, it is clear that the addition of fibers led to increase in the strength and ductility of the test specimens. The initial stiffness, however, was not affected by the presence of fibers, as expected. Measured peak loads and corresponding deflections are summarized in Table 3-4. Also shown in Table 3-4 is the strength normalized by the square root of the concrete cylinder strength, f c, times the critical section area defined in the ACI Code (28), b o d. It should be noted that all normalized strength values at peak are greater than 4, which is the ACI Code strength factor applicable to the test slabs (in psi units). Among all specimens, Specimens S7 and S8, reinforced with regular strength hooked steel fibers in a 1.5% volume fraction, displayed the largest normalized strength. Comparing the response of control Specimen S1 with that of Specimens S5 (Helix fibers) and S7 (Dramix ZP35 fibers), both with a 1.5% fiber volume fraction, an 11% and 5% increase in normalized shear strength was obtained, respectively. This suggests that, for the same fiber volume ratio, hooked steel fibers are more efficient than Helix steel fibers in terms of normalized punching shear strength. Specimen S9, even though it required extensive patching prior to testing, showed a 25% higher normalized strength compared to control Specimen S1. For the specimens with 6 in. bar spacing, strength comparisons are somewhat deceiving due to the fact that flexural yielding governed the strength of Specimens S6, S8, and S1. Specimen S1, reinforced with high-strength hooked steel fibers in a 1.5% volume ratio, exhibited the largest amount of flexural yielding (and ductility) prior to failing by punching. The results from the tests of Specimens S6, S8 and S1 are a clear indication 35
50 that the addition of steel fibers to the concrete in a 1.5% volume fraction may lead to a change in failure mode from punching shear failure to flexural yielding, with the associated increase in ductility. One aspect that should be pointed out is that in specimen pairs S5 and S6, and S9 and S1, fibers were only added to the mixture used in the central 3 in. square region of the slab. The average shear stress calculated at the interface between the fiber reinforced material and the regular concrete ranged between 2.2 and 2.6 ' fc for these four specimens, where ' f c refers to the cylinder compressive strength of the regular concrete. None of these specimens failed or exhibited distress at the interface between the fiber reinforced concrete (or mortar) region and the surrounding regular concrete portion of the slab. These results are very encouraging from an economic viewpoint because they indicate that the use of fiber reinforced concrete can be restricted to the region where it is most needed, i.e. the slab-column connection region. The limited test results suggest that 2 ' f c (psi) is a safe limit for estimating the location of the transition between fiber reinforced concrete and regular concrete Yield-Line Analysis The use of a yield-line analysis (Elstner and Hognestad, 1956) allows the estimation of the flexural capacity of reinforced concrete slabs. The experimental setup shown in Fig. 3-1 allowed slab corners to lift freely by rotating about axis a-a in Fig Therefore, the yield-line pattern shown in Fig. 3-9 was used in order to estimate the theoretical flexural strength of the test specimens. 36
51 Yield-line analysis is based on the flexural capacity of the slab only, while potential contributions from membrane action are not considered. Typically, strain hardening of the steel reinforcement is neglected in yield-line analysis. Therefore, the result from a yield-line analysis is believed to represent a lower bound estimation of the strength of the slab (assuming punching shear does not govern the slab strength). Criswell and Hawkins (1974) found that a slab ductile behavior was associated with values of φ (peak load divided by strength estimated through yield-line analysis) between 1.1 and 1.2. Table 3-6 shows the experimental peak load and flexural capacity calculated from a yield-line analysis for each specimen. The load, normalized by the slab flexural capacity from the yield-line analysis, versus deflection response for the test specimens is presented in Fig In the yield-line analyses, the measured yield strength of the reinforcing steel and the cylinder compressive strength of the concrete were used. A detailed description of the yield-line analysis applied to the slab specimens is given in Appendix A. The results from the yield line analysis suggest that, except for Specimens S6, S8 and S1 (and likely Specimen S4), all specimens should have failed in punching shear with no or limited yielding of the reinforcing steel bars. Although specimens with φ greater than 1.1 generally exhibited large deformations before punching failure, the test results suggest that φ 1.2 is more appropriate for ensuring substantial flexural yielding prior to punching shear failure in FRC slabs. 37
52 Among the FRCs evaluated, those with either regular strength hooked steel fibers (Dramix ZP 35) or high-strength hooked steel fibers (Dramix RC-8/3-BP) in a 1.5% volume ratio (Specimens S8 and S1) showed the best potential for sustaining punching shear forces beyond flexural yielding with φ Rotations Slab rotations were measured over a distance of 12 in. from the column faces. A plot of the normalized shear strength versus average rotation (from all four sides) at peak for all ten specimens is shown in Fig In this figure, positive rotation values imply compression in the top fibers of the slab. Specimens with a reinforcement ratio equal to.56 showed an average rotation capacity 1.7 times that of the specimens with a reinforcement ratio of.83, while the peak strength decreased, on average, by 11%. The largest rotation ratio between each pair of specimens was 1.9 (Specimens S5 and S6), while the lowest ratio was 1.6 (Specimens S1 and S2). It is interesting to note that, except for Specimens S3 and S4, the slope for all specimen pairs was approximately the same. The addition of fibers basically led to a translation of the response of the regular concrete specimens (Specimens S1 and S2) along either the load axis or the rotation axis, or both. In Fig. 3-11, the closer the point is to the upper right corner of the plot the better the response is in terms of both punching shear strength and rotation capacity. Based on this criterion, it is clear that the best responses corresponded to specimen pairs S7 and S8, with regular strength hooked steel fibers, and S9 and S1, with high-strength hooked 38
53 steel fibers. It is interesting to note that the load versus rotation points corresponding to these two pairs of specimens fall almost along a single line, which suggests that these two materials were equally effective in improving slab punching shear resistance and deformation capacity Steel Strains Strains in the reinforcing steel of each specimen were measured by 12 strain gauges located around the connection region (Fig. 3-2). Plots of load versus strain, up to the point where the load capacity decreased significantly (if available), are presented in Figs through Before discussing the strains measured in the test specimens, it is worth mentioning that strains in reinforcing bars embedded in fiber reinforced concrete tend to be more sensitive to crack location than those in bars embedded in regular concrete, which is attributed to the increased bond strength provided by fibers. Thus, the reported strain readings should not be taken as the sole indicator of the degree of inelastic deformation experienced by the test slabs. Slab rotations, which were discussed in the previous section, are believed to represent a more robust measurement for comparing deformation capacity of the test specimens. In all tests, strains were negligible prior to flexural cracking in the slab. Beyond cracking and prior to yielding, strains were basically proportional to the applied load. Readings from strain gauges located at 2.5 in. from the column face (Fig. 3-12) indicate that some yielding occurred in the specimens with reinforcement at 4 in. spacing prior to punching failure. Except for Specimen S9 with high-strength hooked steel fibers, tensile strains at 2.5 in. from the column face just before failure were all below 1.2%. As expected, there 39
54 was discrepancy in the strain gauge readings for the same specimen, the average strain ranging between.4% and.6%. In Specimen S9, however, strains as large as 2% were measured at two locations and the average strain from all strain gauges at d/2 was 1.5%. At 7.5 in. away from the column faces, the measured strains were at or below the yield point ( ε y ) at failure, except for Specimen S9, in which a peak tensile strain of.4% was measured (Fig. 3-13). For all specimens with reinforcement at 6 in. spacing, peak strains at 2.5 in. from the column face exceeded 1% in at least one bar (Fig. 3-14). Specimens S2, S6 and S1 showed, on average, larger tensile strains with a peak strain of 2%. It is worth mentioning that although the strains measured in Specimen S2 are comparable to those in Specimens S6 and S1, the deflection and average rotation at failure for Specimen S2 were roughly 75% and 55% those for Specimens S6 and S1, respectively. These conflicting results could be attributed to the higher strain sensitivity to the crack location in bars embedded in fiber reinforced concrete compared to that in bars embedded in regular concrete, as explained earlier. Reinforcement yielding in the specimens with 6 in. bar spacing spread to at least 7.5 in. from the column faces, as can be seen in Fig Consistent with the strains measured at 2.5 in. from the column face, the bars in Specimens S2, S6 and S1 exhibited the largest tensile strains, with values exceeding 1% in several bars. 4
55 3.5.6 Influence of Fiber Reinforcement on Deflection Capacity The ability of fiber reinforcement to increase the deflection capacity of the test specimens ΔR was evaluated through the ratio Δ. Δ Rc refers to the deflection of either Specimen S1 Rc or Specimen S2 at a residual strength 75% of the peak load for specimens with flexural reinforcement ratio of.83 and.56, respectively. Δ R, on the other hand, is the deflection at a residual strength 75% of the peak load for each test specimen. The ΔR calculated values of Δ R, Δ Rc, and are listed in Table 3-7. Among all specimens, Δ Rc Specimens S9 and S1 exhibited the best performance with an increase of 122% and 77% in deflection capacity compared to control Specimens S1 and S2, respectively Energy Absorption Energy absorption capacity of the test specimens was evaluated based on the area under the normalized punching shear stress versus deflection response, where the vertical axis was selected as the normalized shear stress, Load bd o ' c f, and the horizontal axis represents the vertical deflection, as shown in Fig Table 3-8 summarizes the energy values for each specimen. The addition of fibers to the concrete led to an increase in energy absorption. It can also be noticed that the specimens with larger spacing of flexural reinforcement had better energy absorption ability because of the larger plastic rotations sustained. For the same fiber volume ratio (1.5%), the specimens reinforced with either Helix or regular strength hooked steel fibers absorbed comparable amounts of energy. Specimens 41
56 S5 and S6, with Helix fibers, exhibited a larger displacement at failure, while Specimens S7 and S8 showed a higher normalized shear strength. Specimens S9 and S1 exhibited the largest energy absorption capacity. These two specimens showed moderate peak strengths but superior deformation capacity. 42
57 CHAPTER 4 - BEHAVIOR OF FIBER REINFORCED CONCRETE SLAB-COLUMN CONNECTIONS UNDER COMBINED GRAVITY LOAD AND UNI-AXIAL LATERAL DISPLACEMENTS 4.1 INTRODUCTION Experimental results obtained from the direct punching shear tests of isolated slabs, described in Chapter 3, showed that both regular and high strength hooked steel fibers in a 1.5% volume ratio led to the best behavior in terms of punching shear strength and ductility. These two fiber types were thus selected for further evaluation in slab-column connections subjected to combined gravity load and simulated earthquake-induced lateral displacements. In this chapter, the results from the tests of two slab-column subassemblies under combined gravity load and uni-axial lateral displacement reversals are presented. Results from the study of the behavior of connections under combined gravity load and bi-axial lateral displacements are presented in Chapter TEST SPECIMENS Two approximately 1/2-scale interior slab-column connections, Specimens SU1 and SU2, were constructed and tested under combined gravity load and uni-axial (U) lateral displacement reversals. The slab in each specimen was 18 x 18 x 4 in. (Fig. 4-1). The slab-column subassemblies were pinned supported at the column base, and at each corner of the slab through four steel arms, as shown in Fig The steel arms were designed as 43
58 four rollers such as to restrain vertical displacement while allowing lateral displacements and rotations in the loading direction. Steel C-shape members, connected to the steel arms, were fastened above and below along the perimeter of the slab through bolts in order to restrain vertical displacement along the slab perimeter while allowing rotations. The subassembly columns had a 12 in. square cross section and extended 35 in. and 4 in. above and below the top and bottom slab surfaces, respectively. The columns were connected to steel fixtures for attachment to the test setup, which resulted in a total story height (distance between applied force and bottom pinned support) of approximately 1 in. Lateral displacement reversals were applied at the top of the column through a 1-kip hydraulic actuator. Specimens SU1 and SU2, with identical reinforcement layout, were designed to support a gravity load that would translate into an average shear stress of ' 2 f c (psi) at the critical section of the connection (d/2 from the column faces). For the connection configuration tested, the target shear stress corresponds to a gravity shear ratio of 1/2. ACI Code Section (ACI Committee 318, 28) requires that connection gravity shear ratio be evaluated using the following load combination: 1.2D + 1.L +. 2S, where D, L, and S represent the dead, live and snow loads, respectively. Assuming a specified concrete strength of 5 ksi and a dead load intensity twice as large as that of the live load while neglecting snow loads, equivalent dead and live load intensities of 26 psf and 13 psf were obtained for the target connection shear stress, respectively. Because the slab-column connection is assumed not to be part of the lateral force resisting system, the 44
59 factored gravity load combination corresponding to 1.2D L was then used for the design of the slab flexural reinforcement. No live load reduction was used in design. Required moment capacity was calculated by using the Direct Design Method, as specified in ACI Code Section The design unbalanced moment, which did not include the effect of lateral forces induced by a design-level earthquake, was calculated using Equation 13-7 of the 28 ACI Building Code as follows, 2 ' ' ' 2 M ub =.7 ( qdu +.5 qlu ) L2Ln qdul2l n (4-1) where L 2 = 8 ft and L = 7 ft. In order to increase the magnitude of the unbalanced n moment, the following assumptions were made, L 2 2 = L and L ' n = Ln and 3 3 ' 2 2 q ' Du = q. Du As required by ACI Code Section (ACI Committee 318, 28), flexural reinforcement within a width of one and one-half slab thicknesses from each column face parallel to the reinforcement was provided to resist the fraction of unbalanced gravity moment assumed to be transferred by flexure, γ f M ub, where 1 γ f = (4-2) 1+ (2 3) b b b 1 is the dimension of the critical section in the direction parallel to the reinforcement, and b 2 is the dimension of the critical section in the transverse direction. 1 2 The reinforcement layout for Specimens SU1 and SU2 is shown in Fig No.3, Grade 6 bars were selected as slab flexural reinforcement for both specimens. Two continuous 45
60 bottom bars passing through the column in each principal direction were provided in order to satisfy the ACI requirement against progressive collapse outlined in ACI Code Section (ACI Committee 318, 28). Also, the top reinforcement provided within the effective slab width exceeded 5% of the total reinforcement provided within the column strip, as specified in ACI Code Section (ACI Committee 318, 28). Flexural reinforcement was properly anchored by 18 degree hooks at both ends, as shown in Fig The effective slab depth d for the reinforcement parallel to the loading direction was equal to 3.25 in., as shown in Fig Based on the flexural capacity of the slab and applied gravity load, the column was designed such that the outermost layer of tension reinforcement would remain within the elastic range throughout the test. Eight No.5 Grade 6 bars were used as flexural reinforcement along the column length. Column longitudinal reinforcement was enclosed by No. 4 Grade 6 rectangular hoops at 3 in. spacing (Fig. 4-5). No ties were placed within the joint region (intersection between slab and column); the closest ties were positioned 1 in. above the slab and 1.25 in. below the lowest slab bottom reinforcement (Fig. 4-5), satisfying ACI Code Section (ACI Committee 318, 28). Four 1.5 in. diameter steel rods were embedded approximately 2 in. into the top end of the column for attachment to the top steel fixture used for connecting the column to the hydraulic actuator. Results from the tests of slabs under monotonic loading indicated that concrete mixtures with either regular strength (Dramix ZP 35) or high strength (Dramix RC 8/3 BP) hooked steel fibers in a 1.5% volume fraction offer the best potential among the materials 46
61 considered for increasing slab punching shear resistance and deformation capacity. Results from the tests of specimen pairs S5 and S6, and S9 and S1 also showed that providing the fiber reinforced concrete (FRC) material only in the connection region is sufficient to develop the desired punching shear resistance and ductility. For Specimens SU1 and SU2, FRC materials were used only in the 44 in. square region at the center of the slabs. The perimeter of the FRC region was thus located at four times the slab thickness (approximately five times the effective slab depth) from each column face. Thus, the shear stress on the perimeter d/2 away from the FRC region was less than 2 ' f c (psi). The connection region of Specimen SU1 was reinforced with high strength hooked fibers (Dramix RC 8/3 BP) in a 1.5% volume ratio, while the connection of Specimen SU2 was reinforced with regular strength hooked fibers (Dramix ZP 35), also in a 1.5% volume fraction. The main features of the test specimens are summarized in Table SLAB INSTRUMENTATION A total of 27 and 24 strain gauges were used to measure strains at various locations in the top and bottom flexural reinforcement, respectively. Out of those, 23 and 2 gauges were placed, respectively, on top and bottom bars running parallel to the loading direction. The label and location of each strain gauge is presented in Figs. 4-6 and 4-7, in which T and B refer to top and bottom reinforcement, respectively, and V and H refer to the reinforcement parallel and perpendicular to the loading direction, respectively. Eight linear potentiometers were placed above and below the slab, as shown in Fig. 4-8, to 47
62 measure slab rotations over lengths of 1d and 2d from the column faces. 4.4 TEST PROCEDURE Each test specimen was first moved into the test location through an overhead crane and then pinned supported at the column base. With the crane still supporting the specimen, the eight C-channels used for providing support along the slab edges were installed. Then, the four vertical steel arms were connected to the corners of the slab. With the pin support at the column base locked (no rotation allowed), external instrumentation was installed to the specimens. Finally, the 1-kip actuator was connected to the specimen shortly before each test. Simulated gravity load, in addition to the slab self-weight, was applied through four prestressing strands tensioned by hydraulic jacks, each located at approximately mid-length between the column face and the slab edge, as shown in Figs. 4-2 and 4-9. The force in the prestressing strands was dictated by the target average shear stress in the connection critical perimeter of ' 2 f c, where the concrete strength (psi) was obtained through cylinder tests performed one day prior to each test. Connection gravity shear was monitored through the load cell located underneath the column (Fig. 4-2). Connection shear prior to the application of lateral displacements was approximately 31 kips and 28 kips for Specimens SU1 and SU2, respectively. Components of simulated gravity load for both specimens are listed in Table 4-2. Once the desired gravity load was attained, the hydraulic pressure in the hydraulic jacks was locked. Because of load redistribution during testing, primarily due to cracking and reinforcement yielding, the connection shear 48
63 was checked between each drift cycle and the force in the prestressing strands adjusted if needed. The lateral displacement history for Specimens SU1 and SU2 is shown in Figs. 4-1 and MATERIAL PROPERTIES Fiber Reinforced Concrete and Regular Concrete Both fiber reinforced concretes (FRCs) were mixed in the Structural Engineering Laboratory with concrete proportions by weight of 1:.48:1.45:1.55 (Type III Cement: Water: Coarse Aggregate: Sand). Crushed limestone with a 1/2 in. maximum aggregate size was used. For the rest of the slab, ready-mixed concrete with specified 28-day strength of 5 psi was provided by a local concrete company. The pouring of regular concrete was performed immediately after the FRC material was cast in the connection region. Three 4 x 8 in. cylinders were prepared for evaluation of compressive strength of the regular concrete used in the slab regions outside the connection in each test specimen. For the FRC materials mixed in the University of Michigan Structural Engineering Laboratory, six 4 x 8 in. cylinders were prepared, three for each of the two batches required for each specimen. The compressive strengths obtained from the cylinder tests are listed in Table 4-3. In addition to cylinders for evaluation of compressive strength, beam specimens with dimensions of 6 x 6 x 2 in. were prepared for each FRC material. In Specimen SU1, two beams were prepared for the first batch and one beam for the second batch. In Specimen SU2, one beam specimen was made from each of the two batches. All beams were tested 49
64 under third-point load with an 18 in. span length, according to ASTM Net midspan deflections were measured through two linear potentiometers with a ±.1 in. stroke length, connected to an instrumentation frame, as required by ASTM Key results from beam tests are listed in Table 4-4. First peak load (cracking load) is defined, according to ASTM (Section 1.2), as the load value at the first point on the load versus deflection curve where the tangent slope is zero. Some load decrease occurred just after first cracking and a second peak load, which could be either greater or smaller than the first peak load, was measured. Fig shows the load versus deflection response for the beam specimens tested. Comparing the first and second peaks, it is noted that the FRC material used in Specimen SU1 clearly exhibited deflection hardening behavior. For the FRC material used in Specimen SU2, the two peak values were very similar, leading to a behavior that can be considered a transition between deflection softening and deflection hardening behavior. Strengths at deflection levels equal to.3 in. (span length/6) and.12 in. (span length/15) are also provided in Table 4-4. The tests were terminated after a midspan deflection of.12 in. was reached, as required by ASTM (Section 9.5) Reinforcing Steel Steel bars used in Specimens SU1 and SU2 were ordered and shipped together. Grade 6 No. 3 steel bars were used as slab flexural reinforcement. Column longitudinal and transverse reinforcement was made of No.5 and No.4 Grade 6 steel bars, respectively. For each bar size, two 2 ft. long coupons were requested from the steel supplier. Results from direct tensile tests are summarized in Table
65 4.6 EXPERIMENTAL RESULTS Damage Progression Due to safety concerns, cracks on the top slab surface were not marked during the tests. Thus, only the cracks that were visible from a distance could be detected while the test was in progress. Flexural cracks near the column due to applied unbalanced moment were not visible from a distance until 3.% drift for Specimen SU1. For Specimen SU2, on the other hand, flexural cracks on the slab near the column faces were observed at 1.5% drift, as shown in Fig Radial diagonal cracks (Fig. 4-14) on the top slab surface, extending from the corners of the column to the slab corners, were observed during the first cycle at 1.75% drift for both Specimens SU1 and SU2. These cracks opened gradually as the applied lateral displacement was increased. Both Specimens SU1 and SU2 were able to sustain displacement cycles up to 4% drift in combination with a target gravity shear ratio of 1/2. At this drift level, only slight connection damage was observed in either specimen. Because of the limited damage sustained by the connection in Specimen SU1 after the 4% drift cycles were completed under a target gravity shear ratio of 1/2, a decision was made to increase the applied gravity shear ratio to 5/8 and subject the specimen to additional lateral displacement cycles, as shown in Fig Specimen SU2, on the other hand, was subjected to two cycles to 5% drift in combination with a target gravity shear ratio of 1/2 prior to increasing this ratio to 5/8. After increasing the gravity shear ratio in Specimen SU2 to 5/8, this specimen was subjected to one displacement cycle at 3%, 4%, and 5% drift (Fig. 4-11). 51
66 At the end of the test, Specimen SU1 showed little damage in the connection region, as shown in Fig The connection of Specimen SU2, however, exhibited extensive cracking and some concrete spalling (Fig. 4-16) that indicated the initiation of a punching shear failure. After the completion of displacement cycles in Specimen SU2, the force in the strands was increased to 45 kips (connection shear stress of approximately ' 3 f c, psi). No signs of deterioration in the gravity load carrying capacity of this specimen were observed though. It is worth mentioning that no appreciable damage was observed in the columns of either specimen. In order to evaluate the residual gravity load carrying capacity of Specimen SU1, this specimen was subjected to a monotonically increased load after the completion of the lateral displacement cycles. This was achieved by increasing the force in the four prestressing strands connected to the slab. The maximum force that could be applied by the strands was 1 kips, which led to a connection shear force of 75 kips (average shear stress of approximately ' 4 f c, psi). The slab of Specimen SU1 was saw-cut after completion of the tests. Although some minor inclined cracks were found near the connection region (Fig. 4-17), most of the damage was in the form of flexural cracks Load Displacement Response and Gravity Shear History The load versus displacement relationship for Specimen SU1, with high-strength hooked fibers in a 1.5% volume fraction, is shown in Fig This specimen was loaded uni-axially in the east-west direction, the west direction being defined as positive in the 52
67 plot. As can be seen, the specimen exhibited a stable hysteresis behavior up to 4.% drift when subjected to a gravity shear ratio of 1/2. The relatively minor load drop at approximately -4.% drift was due to a sudden slip of the test setup. As mentioned earlier, applied gravity shear in the slab-column connection was monitored through a load cell located at the column base. Fig shows a plot of connection shear versus lateral drift. The target connection shear in Specimen SU1 was 31.3 kips, as explained in Section 4-4. As can be seen, substantial force redistribution from the connection to the vertical steel arms occurred, especially during the latter drift cycles, leading to a drop of up to 5% in connection gravity shear during the cycle to 4% drift. Upon completion of each loading cycle, however, the applied gravity shear was close to the target value. The load versus drift response for Specimen SU1 when subjected to a gravity shear ratio of 5/8 is shown in Fig. 4-2, while Fig shows the corresponding connection shear read from the load cell at the column base. As can be seen, the lateral resistance of Specimen SU1 was not appreciably affected by the increase in connection shear. The relatively wide hysteresis loops up to 5% drift at such a high connection shear are a clear indication of large deformation and energy dissipation capacity. A reduction in connection gravity shear was noticed during the application of lateral displacements. This shear decrease ranged from 1% for the cycle to 3% drift to 2% for the cycle to 5% drift. Some problems were encountered during the test of Specimen SU2, whose connection was reinforced with a 1.5% volume fraction of regular strength hooked steel fibers. First, 53
68 the data acquisition system stopped recording data during loading for the first time to negative 4% drift. For Specimen SU2, positive drift meant displacement in the east direction (opposite sign convention compared to Specimen SU1). The malfunction of the data acquisition system was not noticed until the peak displacement was attained during the second positive 4.% drift half-cycle. Upon completion of the second cycle to 4% drift, the data acquisition system was restarted. It was then decided to apply an additional full cycle to 4% drift. The test of Specimen SU2 was completed with another two cycles to 5% drift under a 1/2 gravity shear ratio. Although load and displacement readings were reliable after the data acquisition system was restarted, readings from strain gauges and linear potentiometers were not. The second problem encountered during the test of Specimen SU2 had to do with the pinned connection at the bottom of the column. During the specimen setup process, a steel plate between the top of the bottom steel fixture and the column bottom plate was inserted to restrain large rotations of the pin connection at the bottom of the column, as shown in Fig That steel plate was accidentally left in place during the test, which resulted in a rotational restrain at the base of the column for drifts greater than 2.5%. Fig shows the original load versus drift relationship for Specimen SU2. As can be seen, a well defined increase in lateral stiffness occurred at a drift slightly lower than 3%, particularly in the positive loading direction. In order to remove the effect of the plate from the load versus drift response shown in Fig. 4-23, Specimen SU2, after completion of the test, was subjected to additional displacement cycles at 3%, 4%, and 5% drift with and without the bottom plate. No 54
69 gravity load was applied during these additional loading cycles. The difference between the slopes of the two responses (with and without bottom plate) beyond 2.5% drift during loading to each drift level was then used to correct the loading portion of the original response shown in Fig for the drift cycles to 3% and higher. The unloading portions of the response were adjusted proportionally between the peak displacement and 2.5% drift based on the ratio between the modified and original peak loads. No modification was made to the readings from the load cell underneath the column because the effect of the bottom steel plate, if any, was not expected to be substantial. The modified load versus drift response is shown in Fig From the adjusted load versus drift response (Fig. 4-24), an appreciable drop in strength (slightly less than 2%) during the repeated cycle at 4% drift under a target gravity shear ratio of 1/2 can be seen. This is believed to have been caused by the initiation of punching shear-related damage. It should be noted, however, that the first negative half-cycle and the second full cycle at 4% drift were not recorded due to a malfunction of the data acquisition system, as described above. Thus, the strength drop at 4% drift in the positive loading direction occurred after two cycles at this drift level and not one, as implied by the plot. Further increase in drift from 4% to 5% led to a relatively minor decrease in strength for the positive loading direction. Specimen SU2 was able to sustain the applied gravity load, targeted at a 1/2 gravity shear ratio, throughout the test (up to 5% drift), as shown in Fig For drift levels of up to 4%, the applied gravity load was greater than or equal to the target value. For larger drifts, the applied gravity load decreased below the target value, as can be seen in Fig
70 After the cycle to 5% drift was completed on Specimen SU2, the applied gravity shear ratio was increased to 5/8. The lateral resistance decreased substantially, as can be seen by comparing Figs and Even though Specimen SU2 exhibited little lateral resistance, it was still able to sustain the applied gravity shear during the cycle to 3% drift. For the loading cycles to 4% and 5% drift, a decrease in the applied gravity shear for drifts greater than 3.5% was observed, similarly to the previous test under a 1/2 gravity shear (Fig. 4-27). This decrease in gravity load became severe during the cycle to 5% drift, but it was believed to be associated with the test setup and not with a loss of gravity load carrying capacity. The connection shear was increased to approximately 45 kips after completion of the 5% drift cycle under a target gravity shear ratio of 5/8, as can be seen in Fig This shows that the connection of Specimen SU2 still possessed adequate gravity load carrying capacity even though punching shear related damage was believed to have initiated at 4% drift under a target gravity shear ratio of 1/2. The envelope of load at maximum lateral displacement for each drift cycle for both specimens is compared in Fig Specimens SU1 and SU2 behaved similarly when subjected to a 1/2 gravity shear ratio. For the tests under a 5/8 gravity shear ratio, the envelope response was nearly linear and substantially softer than that under a 1/2 gravity shear ratio, particularly for Specimen SU2. Further, this specimen exhibited a substantial lateral strength loss, particularly for loading in the positive direction. This is attributed to punching shear-related damage, as discussed earlier Rotations Drift capacity in slab-column framed structures is greatly dependant on the rotation 56
71 capacity of the connections. Connection rotations were measured along the slab centerline, parallel to the loading direction, over a distance of 1d and 2d from the column faces through linear potentiometers (Fig. 4-8). Figs through 4-32 show the unbalanced moment versus rotation hysteresis response for both test specimens under a target gravity shear ratio of 1/2. Application of a positive rotation would lead to tension at the bottom and compression at the top of the slab. As mentioned earlier, during the test of Specimen SU2, the data acquisition system stopped during loading for the first time to 4% drift in the west (negative) direction. Because this specimen had been subjected to a second cycle to 4% drift before the data acquisition system was restarted, reasonable initial values (after system restart) for the linear potentiometers used to track slab rotations were needed. For this purpose, the initial measurement of each potentiometer was set equal to the value recorded at the last zero lateral force point prior to the failure of the data acquisition system. In Figs and 4-32, the lateral load versus rotation hysteresis responses for Specimen SU2 after the malfunction of the data acquisition system are plotted in dashed lines. The envelopes of the unbalanced moment versus rotation response for Specimen SU1 are shown in Figs and The unbalanced moment was calculated from the applied lateral load. Each point in the envelope response represents the rotation value corresponding to maximum unbalanced moment during the loading cycles at each drift level. The slab rotations on the east and west sides of the connection of Specimen SU1 were 57
72 very similar. The initial application of a gravity load (1/2 gravity shear ratio) led to a rotation of approximately -.25% (rad) on both sides of the slab. The lateral force (or unbalanced moment) versus rotation response was elastic up to approximately.5% drift. Most of the connection rotations occurred within 1d from the column faces, as indicated by the negligible difference in slab rotations between 1d and 2d from the column faces. For the test of Specimen SU1 under a target gravity shear of 1/2, the maximum connection rotation was approximately.5 radians, which occurred at 4% drift. When subjected to additional displacement cycles under a gravity shear ratio of 5/8, the unbalanced moment versus rotation response envelope was nearly linear with a substantially lower stiffness, as shown in Figs and For this test, the peak rotation was approximately.65 radians. As mentioned earlier, no loss of gravity load carrying capacity was noticed in Specimen SU1. The lateral load versus connection rotation response for Specimen SU2 was relatively similar to that of Specimen SU1 under a target gravity shear ratio of 1/2. For the cycles at 4% and 5% drift, however, peak positive rotations increased substantially compared to those in previous cycles, as shown in Fig Yielding of the slab bottom reinforcement is believed to have been the cause of this increase in positive rotations. The unbalanced moment versus rotation envelope responses for the connection of Specimen SU2 are shown in Figs and Similarly to Specimen SU1, most of the deformations concentrated within a 1d distance from the column faces. At 5% drift under a target gravity shear ratio of 1/2, the maximum connection rotation was approximately.6 and.55 radians on the west and east side of the column, respectively. As the target 58
73 gravity shear ratio was increased to 5/8, the peak connection rotation on both sides of the column remained relatively constant (approximately.6 radians). The response under this level of gravity shear was substantially softer, which can be attributed to the observed punching shear-related damage at the end of the drift cycles under a 1/2 target gravity shear ratio Evaluation of Shear Stresses Using Eccentric Shear Model In slab-column framed structures, lateral loads induced by wind or earthquakes create an unbalance moment, M ub, into the slab-column connections. In the 28 ACI Code, a fraction of the unbalanced moment, given by γ f M ub, is assumed to be transferred by flexure within an effective slab width defined by lines located at one-half slab thicknesses (1.5h) from opposite column faces. The remaining portion of the unbalanced moment, γ vm ub, is assumed to be transferred by shear in the critical section. In the eccentric model specified in ACI Code Section (ACI Committee 318, 28), it is assumed that the distribution of shear stress transferring unbalanced moment varies linearly in the critical section based on the following expression, V γ vm ubc v = ± (4-3) A J where c c γ = 1 γ (4-4) v f c 2 3 Jc = ( 16c d + d ) (4-5) 3 c is the distance measured from the centroid of the critical section to the location under consideration, and γ f is defined in Equation (4-2). The uniform shear stress around the 59
74 critical perimeter shown in Fig. 4-37(b) is induced by direct shear (V in Equation (4-3)). The linear variation of shear stress (Fig. 4-37(c)), on the other hand, is due to the unbalanced moment and is calculated by using the eccentric shear model (second term in Equation (4-3)). The superposition of the two stress states results in the final shear stress state shown in Fig 4-37(d). The maximum connection shear stress in Specimen SU1 at peak lateral displacement for each drift cycle under a target gravity shear ratio of 1/2 is listed in Table 4-6. The parameters used in the calculation of the values listed in Tables 4-6 through 4-9 include: γ =.4, J = 7772 in 4, A = 198.3in 2, and c = in. For Specimen SU1, the largest v c c combined shear stress was equal to ' 4.25 f c (psi), which was obtained for the first cycle at 4.% drift with a measured gravity shear ratio of.3. Table 4-7 lists the maximum combined shear stress in Specimen SU1 at peak displacement for each drift cycle under a target gravity shear ratio of 5/8. For this test, the largest calculated shear stress was ' 4.57 f c (psi), which occurred at 4% drift with a measured gravity shear ratio of.47. Maximum combined shear stresses in the connection of Specimen SU2 at peak displacement for each drift cycle are summarized in Tables 4-8 and 4-9 for a target gravity shear ratio of 1/2 and 5/8, respectively. The largest combined shear stress of ' 4.61 f c (psi) was obtained at 4% drift under a measured gravity shear ratio of.37 (target gravity shear ratio was 1/2). Results from the test under a 5/8 target gravity shear 6
75 ratio indicate that the connection of Specimen SU2 was able to maintain its gravity load carrying capacity throughout the test, although punching shear-related damage had been previously observed during the cycle at 4% drift under a target gravity shear ratio of 1/2. A peak shear stress of 46. f (psi) was calculated for the cycles at 3% drift under a ' c target gravity shear ratio of 5/8. Peak shear stress in the following cycles decreased substantially, particularly due to the loss of connection stiffness and moment capacity. As mentioned earlier, however, Specimen SU2 was able to sustain a gravity shear stress of approximately ' 3 f c (psi) after completion of the lateral displacement cycles. The maximum combined shear stress according to Eq. (4-3), calculated at the section d/2 outside the interface between the fiber reinforced material (44 x 44 in.) and the regular concrete was approximately 85. f (psi) for both Specimen SU1 and SU2, where ' c ' f c refers to the cylinder compressive strength of the regular concrete. The 2 ' f c (psi) stress suggested in Section seems to be an adequate limit for the shear stress demand at the location between fiber reinforced concrete and regular concrete. In order to evaluate whether the application of rotation reversals in the connection had an effect on its strength, the results from the direct punching shear tests described in Chapter 3 were used. It should be noted that the top (negative) reinforcement ratio in the column strip of Specimens SU1 and SU2 was.52%, while the reinforcement ratio in each direction for Specimens S7 and S9 and Specimens S8 and S1 was.83% and.56%, respectively. The maximum slab rotation over a distance of 2d from the column face in 61
76 Specimens SU1 and SU2 was compared to the average slab rotation over a distance of 12 in. (2h) from each column face in Specimens S7 through S Shear Stress versus Rotation Interaction Fig shows a plot of normalized shear stress (shear stress divided by f c ' ) versus rotation at failure for Specimens S9 and S1, subjected to monotonically increased loading (see Chapter 3), and Specimen SU1, subjected to combined gravity load and uni-directional displacement reversals. All three specimens were reinforced with high-strength hooked steel fibers in a 1.5% volume fraction. It is worth mentioning that Specimens S9 and S1 failed in punching shear after flexural yielding. However, Specimen SU1 was capable of sustaining the applied gravity load throughout the tests with no indication that failure was imminent. Similarly, Fig shows the values corresponding to Specimens S7 and S8, under monotonic gravity-type loading and Specimen SU2, under combined gravity load and lateral displacement reversals (all these specimens with a 1.5% volume fraction of regular strength hooked steel fibers). Although Specimen SU2 was able to maintain its gravity load carrying capacity throughout the tests, the extensive punching shear-related damage observed in the connection at the end of the test suggests that it was close to failure. In the specimens subjected to lateral displacement reversals, the maximum shear stress calculated from the eccentric shear model did not necessarily correspond to the maximum applied drift or connection rotation measured over a distance 2d from the column face. In Specimen SU1, the maximum shear stress and rotation were observed at 4% drift and 5% 62
77 drift, respectively, under a target gravity shear ratio of 5/8. Therefore, two values are shown in Fig along with the average value, which will be used in this discussion. In Specimen SU2, the maximum shear stress was calculated at 4% drift under a target gravity shear ratio of 1/2, while the maximum rotation occurred at 5% drift under a target gravity shear ratio of 5/8. These two values are plotted in Fig along with the average value. As shown in Fig. 4-38, if the average peak shear stress-rotation value for Specimen SU1 and those for Specimens S9 and S1 are connected through solid lines, a nearly linear relationship is found between normalized shear stress and slab rotation. Because no failure occurred in Specimen SU1, the data corresponding to this specimen may be taken as a lower bound. A similar trend can be seen when plotting the results for Specimens S7, S9 and SU2 (Fig. 4-49). Obviously, the available data are very limited and thus, these results should only be taken as an indication of behavioral trends. The results shown in Figs and 4-39 suggest that using an expression for shear strength independent of connection rotation may not be conservative when large deformations are expected. Test results also indicate that under combined shear stresses less than or equal to ' 4 f c (psi), a rotation capacity of at least.5 rad. can be expected in connections constructed with either of the two fiber reinforced concretes evaluated Steel Strains Strains at selected locations in the reinforcing bars were measured by strain gauges, as 63
78 shown in Figs. 4-6 and 4-7 for Specimens SU1 and SU2, respectively. The average yield strain for the No.3 bars used in the test specimens, calculated from the yield strength obtained from direct tensile test, was approximately.27. As discussed in Section 3.5.5, strain gauge readings in the connection region of these two specimens should be taken with caution because of the increased strain sensitivity to crack location in bars embedded in fiber reinforced concrete compared to bars embedded in regular concrete Specimen SU1 Fig. 4-4 shows the strain distribution in the top flexural reinforcement at a distance.5d from the column face for Specimen SU1, when subjected to a target gravity shear ratio of 1/2. Peak values from each strain gauge located on the west side of the slab (i.e. TV2, TV6, TV1, and TV16) are shown for loading half-cycles in the east direction. The horizontal axis in the diagram represents the distance from the slab edge, where strain is assumed to be zero. The bold solid line represents the theoretical yield strain of.27. Also shown in the figure are the strain histories for gauges TV1 and TV16, which were closest to the slab center. Although the theoretical yield strain was exceeded at these two locations during the cycles to 3% and 4% drift, respectively, the strain histories suggest that no yielding actually took place at those locations. The strain distribution in the longitudinal direction (loading direction) for the center top flexural reinforcement at the distance of.5d, 1.5d, 2.5d and 4.5d from the column face is also presented in Fig. 4-4 (top right corner). The horizontal axis represents the distance from the column face. It is worth mentioning that fiber reinforced concrete was cast in the 44 in. central region of the slab, which is equivalent to a 16 in. distance from each 64
79 column face. From this plot, it can be seen that steel strains at these locations (TV13 to TV16) were still within the elastic range. There was a relatively small strain gradient from.5d to 2.5d from the column face. Between 2.5d and 4.5d (near transition between fiber reinforced concrete and regular concrete), however, a substantial drop in the strain took place. Similarly to Fig. 4-4, Fig shows the strain distribution for the top flexural reinforcement on the east side of the slab, measured from strain gauges located at.5d from the column face. The distribution of steel strains on the east side of the slab is very close to that on the west side up to 1.25% drift. For larger drift levels, larger steel strains were measured on the east central region of the slab. Experimental steel yield strains of nearly.4 were first recorded by strain gauge TV17 during the first cycle at 2.5% drift. At 4% drift, yielding of the reinforcing steel extended over approximately 16 in. (4h) away from the column face in the transverse direction. In the longitudinal direction, a large strain gradient between.5d and 2.5d from the column face was measured on the flexural reinforcement passing through the column, as indicated by the readings from strain gauges TV17 and TV18. Strain gauges located on the top flexural reinforcement at 2.5d from the west column face (TV14, TV9, TV5, and TV1) indicated that the reinforcement remained elastic throughout the test (Fig. 4-42). Little difference can be seen between the strain histories recorded over a distance of 24 in. (6h) in the transverse direction (strain gauges TV14, TV9, and TV5). Strains measured by strain gauge TV1, on the other hand, were substantially smaller than those in the adjacent bar, 12 in. closer to the center, measured 65
80 by strain gauge TV5. As the gravity shear ratio was increased to 5/8, strains in the top flexural reinforcement on both sides of the slab increased, but not significantly (Figs and 4-44). For example, strain gauge TV17 recorded a strain of.131 at 4% drift under a 1/2 gravity shear ratio and.144 at 4% drift under a 5/8 gravity shear ratio. The spread of yielding across the slab width remained approximately the same, within the central 48 in. of the slab, as in the test under a 1/2 target gravity shear ratio. Strains measured in the bottom reinforcement (Figs and 4-46) indicated that the instrumented bars behaved elastically up to 4% drift during the test at a 1/2 target gravity shear ratio, except for one of the slab central bars, whose strain gauge located at.5d from the east column face (BV14) showed bar yielding during the cycle at 4% drift. Yielding of the same bar on the west column face was detected through strain gauge BV13 during the cycle at 5% drift under a 5/8 target gravity shear ratio (Fig. 4-47). Although the remaining strain gauges showed readings below the yield point, the strains in the slab bars outside the column located within a distance of 22 in. (5.5h) from the center of the slab showed peak strain values close to yielding during the last few loading cycles Specimen SU2 As mentioned earlier, the data acquisition system accidentally stopped at some point during the first loading cycle at 4% under a gravity shear ratio of 1/2. Strain measurements taken after the system was restarted are not reliable and thus, only the 66
81 strain histories prior to the system malfunction are discussed. Steel strain profiles along the transverse direction obtained from strain gauges mounted on the slab longitudinal reinforcement at.5d from the column faces are plotted in Figs and For both west and east sides of the slab, yielding of the longitudinal reinforcement near the column faces was first recorded during the cycles at 1.5% drift. With further increased in displacement, yielding of the longitudinal bars spread to those located within a width of 24 in. (6h) from the center of the slab. Prior to the malfunction of the data acquisition system, the instrumented bars outside of this central band remained well below the yield strain. Spread of yielding in the longitudinal direction was rather limited. As can be seen in Fig. 4-48, yielding of the longitudinal reinforcement was recorded only by the strain gauge located at.5d from the column face (TV16) up to approximately 4% drift, when strains beyond the yield point were measured at 1.5d by strain gauge TV15 (Fig. 4-48). On the other hand, readings from strain gauges TV13 and TV14 (Fig. 4-48), located at 2.5d and 4.5d from the column face, respectively, indicated linear elastic behavior up to 4% drift. Fig. 4-5 shows the strain gauge readings across the slab width on the west side of the slab at a distance of 2.5d from the column face. No yielding was found at those locations. Peak strains in one of the longitudinal bars that passed through the column, as well as in the adjacent bar outside of the column were near yielding at 4% drift (last loading cycle shown). Strains measured at 6h and 9h from the center of the slab were relatively uniform and slightly larger than half of the strains measured in the central bars. 67
82 With respect to the strains experienced by the bottom reinforcement, a more uniform distribution across the slab width was observed compared to the top reinforcement. As shown in Figs and 4-52, peak strains over a slab width of 9h were relatively similar and, except for one of the two bottom bars that passed through the column, below the yield point up to 4% drift. Strain gauge BV14, located at.5d from the column face, indicated bar yielding during the cycle at 4% drift. The relatively large tensile strains measured by strain gauge BV14 for loading in the negative (west) direction seem to be evidence of bar slip through the column. This is surprising considering the fact that the column depth was equal to 32 slab bar diameters Average Strain from Measurement of Potentiometers Average strains at the level of the slab reinforcement layers within a distance of 1d from the column face were estimated by assuming a linear variation between the top and bottom potentiometer readings used to measure slab rotations over 1d from the column face. Because these strains are averaged over a fixed length, the measurements are not sensitive to crack location, as is the case of readings from strain gauges attached to reinforcing bars. Figs and 4-54 show a comparison of bar strain gauge readings and calculated average strains for Specimens SU1 and SU2, respectively. As can be seen, large differences exist between strain gauge readings and average strains, particularly for the top reinforcing bars. In most cases, the strain gauge readings were smaller than the average strains. This would be expected if flexural cracks are not close to the location of 68
83 the strain gauge. The difference between strain gauge readings and calculated average strains was believed to be exacerbated by the enhanced bond between reinforcing bars and fiber reinforced concrete, particularly in Specimen SU1 with high-strength hooked fibers Curvature Curvatures at various slab sections were calculated based on readings from strain gauges attached to the top and bottom reinforcing bars. For a section crossing two bars (top and bottom) instrumented at the same location, the curvature can then be calculated as the difference between the strain in the top and bottom bars divided by the distance between the two reinforcing bars (2.5 in. for Specimens SU1 and SU2). Because the layout for the top and bottom reinforcement differed, interpolation of the strains measured by strain gauges was done at distances equal to 8 in., 2 in., 32 in., 44 in., and 54 in. from the edge of the slab. It is worth mentioning that the results are shown for the purpose of evaluating curvature distribution rather than individual values given the fact that curvatures were calculated from strain gauge readings, which are sensitive to the crack location. Figs and 4-56 show the curvature variation over half of the slab width for Specimen SU1, calculated from strain gauges located at d/2 from the column faces at both west and east direction. It is worth mentioning that fiber reinforced concrete was cast in the central region of the slab, 32 in. from each slab edge. A section subjected to tension at the bottom and compression at the top would exhibit positive curvature. From Figs and 4-56, it can be seen that curvatures were not symmetric for both 69
84 sides of the slab in Specimen SU1, which is not surprising given the sensitivity of strain gauge readings to crack location. A more symmetric curvature distribution, however, was observed in Specimen SU2, especially for drifts less than 1.5% (Figs and 4-58). Curvatures in both specimens increased substantially as the section considered was closer to the column, particularly at distances over 24 in. from the slab edge. This is an indication that unbalanced moment was transferred mostly within the column strip. 4.7 INFLUENCE OF REINFORCEMENT AND GRAVITY SHEAR RATIOS ON SHEAR STRENGTH AND LATERAL DRIFT CAPACITY (REINFORCED CONCRETE VERSUS FIBER REINFORCED CONCRETE) For specimens subjected only to monotonically increased punching shear, several researchers (Dilger et al. 25; Alexander and Hawkins, 25) have indicated that punching shear resistance of slab-column connections increases as the slab tensile flexural reinforcement ratio in the connection region is increased. The same trend was found by Luo and Durrani (1995) as well for specimens under combined gravity-type load and lateral displacement reversals, where connection shear stresses were calculated by using the eccentric model described in Section This increase in punching shear strength is not surprising given the fact that higher flexural reinforcement ratios will lead to a larger compression zone with the associated increase in shear transfer, as well as increased dowel action. The scenario of higher shear resistance resulting from higher flexural reinforcement ratios, however, usually leads to a decrease in ductility. Based on results from the tests of twenty three slab-column specimens, Pan and Moehle (1988) indicated that the tensile flexural reinforcement ratio in the slab effective width has less influence on drift capacity than gravity shear ratio. 7
85 In this section, the effect of flexural reinforcement ratio and gravity shear ratio on drift capacity and punching shear resistance of slab-column connections (reinforced concrete and fiber reinforced concrete) is evaluated. Table 4-1 summarizes test results available in the literature, which are compared with those obtained from the tests of Specimens SU1 and SU2. Ultimate drift ratio in Table 4-1 is defined as the displacement at which a substantial loss of moment resistance was observed, which in the test specimens corresponded to a punching shear failure of the connection. It should be noted that, based on this criterion, failure did not occur in Specimens SU1 and SU2 listed in the last row of Table 4-1. Even though the connection of Specimen SU2 had experienced significant punching shear-related damage by the end of the test, this specimen was able to sustain the applied gravity shear after completion of the loading cycles. Slab tensile reinforcement ratios reported in Table 4-1 were calculated over a slab effective width equal to C 2 +3h, as opposed to an average value either for the region where flexural reinforcement was concentrated or for the entire slab width. Because gravity shear ratio at punching shear failure was not always reported, the ratios shown in Table 4-1 correspond to those reported at peak unbalanced moment. For Specimens SU1 and SU2, two shear stress values are presented, one at peak unbalanced moment and the other at maximum shear stress. For Specimen SU2, these two values were the same. The relationship between combined shear stress at peak lateral load and tensile reinforcement ratio in the effective slab width is shown in Fig The combined shear stress was calculated by means of the eccentric shear model and was normalized by the 71
86 shear stress at nominal condition, which for the connections considered was ' 4 f c (psi). Although the shear stress values used corresponded to the peak lateral load, it is believed that in most cases, the combined shear stress at punching shear failure would be either less than or equal to that calculated at peak lateral load. As can be seen in Fig. 4-59, normalized shear stress values at punching failure below 1. were not uncommon for slabs with tensile reinforcement ratios less than.8%. These results suggest that the shear resistance of ' 4 f c (psi) specified in the ACI Building Code (ACI Committee 318, 28) is not conservative for use in lightly-reinforced slab-column connections. As observed in previous research studies, the data shown in Fig provide further evidence that an increase in slab tensile reinforcement ratio leads to an increase in punching shear strength of slab-column connections. The relationship between combined ultimate shear stress, v u, and slab tensile reinforcement ratio over the effective slab width, ρ tension, can be linearly approximated by Equation (4-6), which based on the limited test results, seems to be valid for reinforcement ratios of up to 1.2%. ' ρ vu = f c. + tension (psi) where ρ ρ 12 minimum tension. (4-6) As can be seen in Fig. 4-59, the shear stresses corresponding to Specimens SU1 and SU2 were approximately 3% above the proposed normalized shear stress versus tensile reinforcement ratio relationship. It should be mentioned, however, that these two specimens were able to sustain the applied gravity load throughout the tests. Although it is believed that Specimen SU2 was near failure, Specimen SU1 exhibited little damage at the end of the test. Thus, the data points shown in Fig corresponding to Specimen 72
87 SU1 may be taken as a lower bound. As shown in Fig. 4-6, the trend between combined shear stress and reinforcement ratio is nearly completely eliminated when the combined shear stress is normalized by the shear stress obtained from Equation (4-6). With respect to a potential relationship between combined shear stress and drift capacity, the data shown in Fig suggest that drift capacity is little (if any) dependent on combined shear stress. Only a slight decreasing trend in the peak shear stress with an increase in drift can be observed. Once the shear stress is normalized by Eq. (4-6), drift capacity seems to become independent of combined shear stress, as shown in Fig It should be kept in mind, however, that combined shear stresses were calculated through the eccentric shear model, which cannot be considered an accurate representation of actual shear stresses in a slab-column connection subjected to combined direct shear and unbalanced moment. Among the parameters considered, gravity shear ratio was found to have the most significant influence on lateral drift capacity, as shown in Fig The data presented in this figure indicate that the deformation-based check specified in the 28 ACI Code (ACI Committee 318, 28) to determine the need for shear reinforcement becomes less conservative as the gravity shear ratio increases. If the gravity shear ratio is adjusted using Eq. (4-6), the 28 ACI Code interaction diagram becomes slightly more conservative, as shown in Fig In either case, the points corresponding to Specimens SU1 and SU2 were located to the right and above other test data corresponding to similar failure drifts and gravity shear ratios, respectively. 73
88 The data corresponding to Specimens SU1 and SU2, plotted in Fig. 4-64, indicate that the use of either regular strength or high-strength hooked steel fiber reinforcement in a 1.5% volume fraction leads to a substantial increase in either punching shear strength or drift capacity, or both compared to those in regular concrete slab-column connections. Also, the limited test data suggest that high-strength hooked fibers are more effective in enhancing connection behavior than regular strength hooked steel fibers under combined gravity load and uni-axial lateral displacement reversals. Based on the results from the tests of Specimens SU1 and SU2, a gravity shear ratio of.35 (.4 using Eq. (4-6)) seems to be a safe limit for ensuring a minimum drift capacity of 4% drift in slab-column connections with the fiber reinforced concretes considered. 74
89 CHAPTER 5 - BEHAVIOR OF SLAB-COLUMN CONNECTIONS UNDER COMBINED GRAVITY LOAD AND BI-AXIAL LATERAL DISPLACEMENTS 5.1 INTRODUCTION Earthquakes typically hit structures at an angle with respect to their principal axes of lateral resistance. For slab-column framed structures, this means that the connections must be capable of transferring gravity loads while being subjected to bi-axial rotations, potentially into the inelastic range of behavior. Research by Pan and Moehle (1989) indicated that bi-axial lateral loading reduces the strength, stiffness and deformation capacity of slab-column connections. They claimed that interaction between torsion, moment and shear at one face of the connection accounts for the reduced capacity under bi-axial lateral loading. Experimental results from the uni-axial lateral displacement tests conducted as part of this investigation, described in Chapter 4, showed that slab-column connections reinforced by high-strength hooked steel fibers in a volume fraction of 1.5% can sustain a gravity shear ratio of approximately.45 during displacement cycles of up to 5% lateral drift. Although the specimen reinforced by regular strength hooked steel fibers in the same volume fraction showed extensive punching shear-related damage at the end of the test, the connection of this specimen was still able to carry a gravity shear stress of approximately ' 3 f c, psi (gravity shear ratio of.75), after completion of the lateral 75
90 displacement cycles. To evaluate the effect of bi-axial lateral displacement cycles on punching shear resistance and deformation capacity of slab-column connections constructed with fiber reinforced concrete, slab-column connections reinforced by either high-strength or regular strength hooked steel fibers in a 1.5% volume fraction were tested under combined gravity load and bi-axial lateral displacements. The results were compared to those from the test of a reinforced concrete connection with headed shear studs, designed according to the 28 ACI Building Code (ACI Committee 318, 28). The bi-axial tests were conducted at the MAST (Multi-Axial Subassemblage Testing) Laboratory at the University of Minnesota, which is part of the Network for Earthquake Engineering Simulation (NEES) created by the US National Science Foundation (NSF). 5.2 TEST SPECIMENS Three nearly full-scale interior slab-column subassemblies with identical geometry were tested under combined gravity load and bi-axial lateral displacement reversals. These specimens are identified as SB1, SB2 and SB3, where B stands for bi-axial displacements. The test specimens were designed to simulate a first floor interior connection of a slab-column framed structure. Inflection points were assumed to be located at mid-span of the slab in each principal direction. Slab dimensions were 17 x 17 x 1/2 ft (24 x 24 x 6 in.), as shown in Fig The slab was supported by a 16 in. square column at its center and four vertical actuators at each corner, as shown in Fig. 5-2, spaced at 15 ft in each principal direction of the specimen. These four vertical actuators restrained vertical displacement while allowing 76
91 bi-axial lateral displacements and rotations. The center column, which had a first story length of 129 in. (top of foundation to top of slab), was fixed connected to a 6 x 6 x 32 in. heavily reinforced concrete base block anchored into the laboratory strong floor. The second story column was extended approximately half a story above the slab level and was anchored to a rigid steel crosshead through a 42 x 42 x 16 in. concrete block. The total second story height, including the top block, was 76 in. The steel crosshead, rigid for practical purposes, was driven by eight actuators (Fig. 5-2) and operated under a six degree-of-freedom control system. In Specimens SB1 and SB2, the 64 x 64 in. central region of the slab, bounded by lines parallel to the edges of the slab and at 24 in. (four slab thicknesses) from the column faces, was reinforced with either regular strength or high-strength hooked steel fibers in a target volume fraction of 1.5% (Fig. 5-1). Regular concrete was used for the outer portions of the slab, as well as the other specimen components (i.e. column and base and top blocks). For Specimen SB3, reinforced by headed shear studs in the connection region, regular concrete was used throughout. A summary of the main features of the three test specimens is provided in Table 5-1. The flexural reinforcement in the three specimens was designed using the same design procedure as for the specimens subjected to uni-axial lateral displacements, discussed in Section 4.2. The gravity load intensity was selected such as to induce a connection direct shear force that would correspond to a ' 2 f c (psi) average shear stress at the connection 77
92 critical section (d/2 from the column face). The average slab effective depth, d, was 4.75 in. For design purposes, the concrete compressive strength and the yield strength of the reinforcement were assumed to be 5 psi and 6 ksi, respectively. The resulting slab flexural reinforcement layout for Specimens SB1 and SB2 is presented in Fig Flexural reinforcement for Specimen SB3 had the same layout as for Specimens SB1 and SB2, except for some minor changes in the location of the bottom reinforcement within the column in order to accommodate the headed shear stud reinforcement. The reinforcement layout for this specimen is shown in Fig The design shear stresses for the connection of Specimen SB3 were based on the results from the tests of Specimens SB1 and SB2. The experimental results for these two specimens indicated that for a lateral drift on the order of 2%, an unbalanced moment of 15 kip-in was a conservative design assumption. With this unbalanced moment, the factored shear stress due to direct gravity shear and unbalanced moment would be less than ' 6 f c (psi). Therefore, a 3.5 in. stud spacing was selected in accordance with the 28 ACI Code Specification (a) (ACI Committee 318, 28). Eight 3/8 in. diameter rods were required to provide sufficient shear capacity on each peripheral line of studs, with the first rod placed 2 in. away from the column face according to ACI Code Specification As shown in Fig. 5-5, two stud rails, perpendicular to each column face and spaced at 9.5 in. (2d) in accordance with ACI Code Section , were provided. It should be noted that for a square or rectangular column, the maximum distance between adjacent studs on the first peripheral line, 78
93 specified in ACI Code Section and shown as g in Fig. 5-5, shall be satisfied only for stud rails installed on the same side of a column. There are no requirements for spacing between two adjacent perpendicular rails, shown as g ' in Fig However, the distance between the first stud in adjacent perpendicular rails was 7.4 in., which is less than 2d. The farthest stud in each rail was located at 19.5 in. away from the column face. The factored shear stress due to gravity load and unbalance moment at a distance d /2 beyond the termination of the shear reinforcement was less than detailed description of the headed shear stud design can be found in Appendix B. ' 2 f c. A The geometry of the stud rail system used in Specimen SB3 is shown in Fig It should be mentioned that the stud rail system used in this research was provided by a Canadian company, Continental Decon Inc. Based on required rod diameters, Continental Decon Inc. provided default configurations for head size and rail dimensions. The column was designed to sustain the expected axial load and bending moments. The designed axial load, approximately 2 kips, consisted of 1) gravity shear applied through slab-self weight and prestressing strands, and 2) axial load equivalent to approximately 1% of the column axial load capacity. This second component was meant to simulate a small axial load due to the weight of stories above. The flexural demand was obtained based on a 2-D slab-column frame model constructed following the recommendations by Hueste and Wight (1997). The column was designed according to the Reciprocal Load Method by Bresler, as 79
94 reported by MacGregor and Wight (25). As shown in Fig. 5-7, the resulting column longitudinal reinforcement consisted of twelve No. 6 Grade 6 continuous bars with 9-degree hooks at both ends. Transverse reinforcement was provided at 3 in. spacing and consisted of No. 3 Grade 6 closed hoops in accordance with ACI Code Specification (ACI Committee 318, 28). Reinforcement for the top and base concrete blocks was designed such as to resist the demands corresponding to the capacity of the specimen. Reinforcement details for these two blocks are shown in Fig SPECIMEN INSTRUMENTATION A total of 26 strain gauges were installed on the top flexural reinforcement of each slab, arranged following the same configuration for each principal direction (Fig. 5-9). Strain gauges labeled as TS2 and TS3, where TS refers to top reinforcement in the N-S direction, are located at a distance of d/2 away from the column faces. Strain gauge TS4, on the other hand, is located at a distance of 2d from strain gauge TS3, while strain gauge TS1 is located at a distance of 2d from strain gauge TS2. Strain gauge TS6 was aligned with the column centerline. On the bottom flexural reinforcement, a total of 22 strain gauges were installed, also following the same arrangement for each principal direction (Fig. 5-9). Strain gauges BS2 and BS3, where B refers to bottom reinforcement, were located at a distance of d/2 away from the column faces, while strain gauges BS4 and BS1 were located at a distance of 2d away from these two strain gauges, respectively. Because of slightly different bottom reinforcement layouts between Specimens SB1, SB2 and SB3, only relative strain gauge positions are provided in Fig Exact locations of all strain gauges can be found by 8
95 comparing Figs. 5-3, 5-4 and 5-9. At the bottom end of the column, two pairs of strain gauges were installed on the flexural reinforcement located at the north-western and south-eastern corners, as shown in Fig These gauges were located at 1 in. and 7 in. away from the top face of the base block. Slab rotations relative to the column at a distance of 1d and 2d from each column face were measured through sixteen ± 1 in. stroke Linear Variable Differential Transducers (LVDTs), as shown in Fig Column base rotations with respect to the base block, on the other hand, were measured through four ± 2 in. stroke LVDTs at a distance of 14 in. (column effective depth) away from the face of the base block. 5.4 STAGING OF SPECIMENS AND TEST PROCEDURE Once constructed in an area adjacent to the testing space, the specimens were moved into the test location through a railing system. Liquid grout, forming an approximately 1/2 in. thick layer, was uniformly poured between the base block and strong floor once the specimen was positioned. The specimen was then anchored to the strong floor by twelve 1-1/2 in. diameter threaded rods. Eight boundary tubes (four HSS 12 x 6 x 3/16 in. sections above the slab and four HSS 12 x 6 x 1/4 in. sections below the slab), served as stiffening elements along the four edges of the slab. Pairs of 3/4 in. diameter threaded rods at 12 in. spacing were used to connect the tubes to the slab, as shown in Fig One day before the test, the top block was connected to the steel crosshead through 81
96 sixteen 1-1/4 in. diameter threaded rods. Also on the same day, vertical actuators, each with ± 1 in. stroke and ± 22 kip capacity, were connected to the four corners of the slab and anchored to the strong floor. Prior to application of lateral displacements, the column axial load and slab gravity loads were applied. The column axial load, approximately 14 kips, was applied first and this load was held throughout the test. According to the slab concrete compressive strength in the connection region, the target gravity load was applied through four prestressing strands to achieve a connection gravity shear stress of 2 ' f c (psi) (including slab self-weight). Vertical displacements at the slab corners were free to occur during application of the column axial load, but fully restrained under the application of the simulated gravity load. The force carried by each prestressing strand was determined by the average reading of three strain gauges whose load-strain coefficients had been determined experimentally prior to the tests. The gravity load in addition to the slab self-weight for each specimen, listed in Table 5-2, was obtained by subtracting the summation of the load from the four vertical actuators from the total load applied through the prestressing strands. Adjustment of the prestressing load was only made between each displacement cycle, if necessary. Lateral displacements were applied through the steel crosshead, which was driven by eight hydraulic actuators. This crosshead system is capable of delivering ± 16 in. displacement with ± 88 kips capacity in both lateral directions, while simultaneously 82
97 delivering ± 2 in. displacement with a force of ± 132 kips vertically. Each specimen was tested under the same lateral displacement history, shown in Table 5-3. An error in the specified specimen height during testing, however, led to an 8% difference between the applied drift and the target drift, the former being smaller. Corrected drifts, rounded to the closest.5%, are listed in Table 5-3 and are used when discussing test results. A plot of drift magnitude versus cycle number is shown in Fig Each displacement cycle followed a clover-leaf pattern consisting of 13 steps, as shown in Fig The tests were terminated at the end of the cycle in which a significant drop in the applied gravity load occurred due to punching shear failure of the connection. 5.5 MATERIAL PROPERTIES Fiber Reinforced Concrete and Regular Concrete All concrete mixtures were delivered by ready-mixed trucks from the same concrete supplier, Cemstone, Minnesota. According to the material weight sheet provided by the company, the concrete for all of the specimens had the following proportions: 2.25:1.85:1:.45 (Sand: Aggregate: Cement: Water). Course aggregate consisted of river rocks with a 3/8 in. maximum size. The specified slump and 28-day cylinder compressive strength for this concrete mixture was 6 in. and 5 psi, respectively. For the slabs of Specimens SB1 and SB2, fiber reinforced concrete was cast in the 64 in. square central region, as described earlier. The amount of fibers required to achieve a 1.5% volume fraction, to be added to the concrete truck onsite, was determined based on 83
98 the amount of concrete ordered. Fibers were mixed with the regular concrete for three minutes before casting. The remainder of the slab was cast using regular concrete from a separate ready-mix concrete truck. It should be mentioned that the volume ratio of high-strength hooked steel fibers in Specimen SB2 was less than the target volume fraction of 1.5% because the actual amount of concrete delivered was greater than the volume ordered, according to the material weight sheet provided by the concrete truck driver. This led to the amount of high-strength hooked steel fibers intended for 1.5 cubic yards of plain concrete being mixed into 1.65 cubic yards of plain concrete, resulting in a volume fraction of 1.36% (1% less than the target volume fraction). Concrete slump was measured before and after the addition of fibers. Slump measurements for each concrete delivery are listed in Table 5-4. As shown in the table, prior to the addition of steel fibers, the measured concrete slump was 6.25 in. and 9.5 in. for Specimens SB1 and SB2, respectively. After the addition of fibers, the concrete slump decreased to 6 in. and 8 in. for Specimen SB1 and SB2, respectively. Both fiber reinforced concrete materials exhibited adequate workability during casting. The good workability obtained in the fiber reinforced concrete used in Specimen SB1, for which the slump prior to the addition of fibers was 6.25 in., supports the recommended minimum concrete slump of 6 in. before addition of fibers, as discussed in Section As shown in Fig. 5-14, the 64 in. square region to be constructed with fiber reinforced concrete was marked by masking tape. After the fiber reinforced concrete was placed, 84
99 only light vibration was applied where necessary. Regular concrete, from a second ready-mix concrete truck requested to arrive 15 minutes after the first truck, was then cast following a spiral pattern from the interface, as shown in Fig Once all of the concrete was placed, the entire area was vibrated as needed. From the limited experience gained during the casting of the slabs of Specimens SB1 and SB2, an upper limit in the concrete slump of 1 in. (which may lead to approximately 8 in. slump for fiber reinforced concrete) is recommended in order to prevent excessive flow of fiber reinforced concrete into the outer slab regions. The compressive strength of the concrete in each delivery was evaluated through compressive tests of six 4 x 8 in. cylinders. Three cylinders were used for 28-day compressive strength, while the other three were tested one day before the test of the specimen. Results from cylinder tests are summarized in Table 5-5. Specimen SB3 was tested 27 days after the slab was poured. Therefore, 28-day compressive strength was not available for the concrete used in the slab, top column and top block. The average strength listed in Table 5-5 for each component of Specimen SB3 was calculated from the test of six cylinders. The flexural behavior of each type of fiber reinforced concrete was evaluated through three 6 x 6 x 24 in. beam tests. All beams were tested under third-point loading with an 18 in. span length according to ASTM Deflections at mid-span were measured through two LVDTs with stroke lengths of ±.1 in. The tests were terminated after a mid-span deflection of.12 in. was reached. Fig shows the load versus deflection response for the beam specimens tested. The average test results are summarized in Table 85
100 5-6. Both fiber reinforced concrete materials exhibited deflection-hardening behavior. This deflection-hardening behavior was more pronounced in the FRC material used in Specimen SB2 with high-strength hooked fibers, where the average residual strength at the end of the test was 1% greater than the first peak (cracking) load defined in Section 1.2 of ASTM For the FRC material used in Specimen SB1, the average residual strength at the end of the test was 25% lower than the first peak load Reinforcing Steel All steel reinforcing bars had a nominal yield strength of 6 ksi. The headed shear studs installed in Specimen SB3, which were provided by Continental Decon Inc, had a specified minimum yield strength of 5 ksi. The reinforcing steel used for Specimens SB1 and SB2 were ordered and shipped together. The reinforcing steel used in Specimen SB3 was ordered separately after the test of Specimen SB2. Three 2-foot long steel coupons were requested for each bar diameter for strength evaluation. The steel properties for all three specimens are summarized in Table EXPERIMENTAL RESULTS Damage Progression Specimen SB1 The connection region of Specimen SB1 was reinforced by regular strength hooked steel fibers in a volume fraction of 1.5%. The first detected flexural crack on the top surface of the slab formed adjacent to the east side of the column face during the.25% drift cycle. 86
101 Flexural cracks on the top surface of the slab adjacent to the north, south and west sides of the column faces were observed at the end of the.45% drift cycle. On the bottom surface of the slab, flexural cracks around the holes for the prestressing strands used to simulate gravity load were observed at.45% drift. Cracks propagating from the corner of the column towards the top corners of the slab were observed during the 1.4% drift cycle, as shown in Fig Minor spalling of concrete in the corners of the column just above the slab was observed during the.7% drift cycle. The concrete cover at the bottom end of the column (above the base block) also started to spall off during the drift cycle at 1.6% drift. At this drift level, negligible damage could be observed in the connection region. Punching shear-related damage was first observed at the end of the 2.3% drift cycle on the east side of the slab, as shown in Fig A sudden drop in lateral load occurred when the specimen was loaded from point 4 to point 5 (Fig. 5-13) during this loading cycle. The applied connection shear did not decrease significantly until the specimen was loaded from point 1 to point 11. Punching shear damage all around the column became evident after the specimen was subjected to loading steps 1 through 3 at approximately 2.8% drift, as shown in Fig Specimen SB2 The connection of Specimen SB2 was reinforced by high-strength hooked steel fibers in a target volume fraction of 1.5%. As discussed earlier, the actual fiber volume fraction for this specimen was estimated at 1.36% because of a larger than ordered delivery of 87
102 concrete. Slab first flexural cracking was observed during the cycle at.25% drift in the region adjacent to the south face of the column. By the end of the.45% drift cycle, slab flexural cracks near all four column faces had already formed. On the bottom surface of the slab, cracks around the holes for prestressing strands were noticed during the cycle at.45% drift, as for Specimen SB1. Minor concrete spalling in the corners of the column above the slab and at the base were observed during the cycles at.7% and 1.6% drift, respectively. Cracks propagating from the corners of the column to the corners of the slab were observed during the.9% drift cycle. Punching shear-related damage was first observed on the north side of the connection, followed by the south-west and south-east corners of the connection when the specimen was loaded from point 5 to point 8 during the cycle at 1.85% drift, as shown in Fig By the end of the 2.3% drift cycle, a full punching shear failure around the column had developed, as shown in Fig At the end of the test, a 1/2 in. vertical settlement of the slab around the primary punching shear crack was observed (Fig. 5-22) Specimen SB3 The connection of Specimen SB3 featured headed shear studs for punching shear resistance. At the end of the.25% drift cycle, flexural cracks were visible on the top surface of the slab adjacent to each column face. A diagonal crack on the top slab surface extending from each column corner to the corners of the slab was observed at.45% drift. As shown in Fig. 5-23, punching shear-related cracks formed at the south-east corner of 88
103 the connection during loading step 5 (Fig. 5-13) at 1.15% drift, followed by a sudden drop in lateral load when the specimen was loaded from point 6 to point 7. At the end of the 1.15% drift cycle, it appeared that the primary punching shear crack intersected the top surface of the slab at roughly the perimeter formed by the last row of headed shear studs (Figs and 5-25). However, after close inspection of the connection region, it became clear that the punching shear crack propagated across the slab thickness between the first and second row of headed shear studs on all four sides of the connection (Fig. 5-26) Load Displacement Response and Gravity Shear History Specimen SB1 The load versus displacement relationship for Specimen SB1, decomposed into x (North-South, N-S) and y (East-West, E-W) directions, is shown in Fig In this figure, the south and east directions are defined as positive. This sign convention was applied to all test specimens. Specimen SB1 exhibited a stable hystesis response in both x and y directions throughout the cycles up to 1.85% drift. During the 2.3% drift cycle, a sudden decrease in lateral load occurred when the specimen was loaded from point 4 to point 5 in the clover-leaf loading pattern (Fig. 5-13); this drop is circled in Fig and was believed to have been the initiation of the punching shear failure. During the following quarter cycle at 2.3% drift, from point 6 to point 9 (Fig. 5-13), the lateral load versus displacement did not seem to be affected by the existing damage. In the last quarter cycle at 2.3% drift, however, significant loss of lateral load resistance was observed when the specimen was loaded in the west direction (point 1 to point 11), accompanied by a significant drop in applied gravity shear. The specimen was then 89
104 cycled at 2.75% drift without adjusting the applied gravity load. The test was terminated after the first quarter cycle at this drift level, once a nearly total loss in gravity shear occurred. As shown in Table 5-2, a gravity shear ratio of 1/2 corresponded to a shear force of 57.7 kips. The fluctuation of connection shear with time for Specimen SB1 is plotted in Fig In this diagram the shear at the critical section, which consists of contributions from the slab self-weight, applied gravity load and weight of the boundary elements, is plotted with reference to the right vertical axis. Drift versus time histories for loading in the N-S and E-W directions are also plotted with reference to the left vertical axis. It should be mentioned that the test of Specimen SB1 was completed in two days. At the end of the first day of testing, the prestressing strands were unloaded and recording of data was stopped. The data plotted in Fig indicate that punching shear failure, characterized by a drop in the applied gravity shear, occurred between loading points 1 and 11 during the cycle at 2.3% drift. During the quarter cycle applied at 2.75% drift, the applied gravity shear dropped to negligible levels Specimen SB2 The test of Specimen SB2 was completed in two days as well. The load versus displacement relationship for Specimen SB2 is shown in Fig During this test, a gradual decrease in load occurred when the specimen was loaded from point 1 to point 11 during the 1.85% drift cycle, as encircled in Fig This was believed to have been the initiation of the punching shear failure. The applied connection gravity shear versus time, shown in Fig. 5-3, indicated a significant decrease in applied shear at the end of 9
105 the 1.85% drift cycle. However, the slab was still able to sustain approximately 4 kips of shear (1. 52 f ), which was equivalent to a gravity shear ratio of.38 at the critical ' c section. Therefore, it was decided to skip the cycle at.9% drift, and the specimen was instead further cycled at 2.3% drift without adjustment of the applied gravity load. As can be seen in Figs and 5-3, even though a punching shear failure had initiated during the previous drift cycle, the connection was still able to carry approximately 45 kips of shear (equivalent to a gravity shear ratio of.43) at loading point 1 of the 2.3% drift cycle. The applied gravity shear then decreased significantly between loading points 1 and 2, at which point the connection was considered to have completely failed in punching shear. The test was terminated at the end of the 2.3% drift cycle Specimen SB3 As opposed to the tests of Specimens SB1 and SB2, the test of Specimen SB3 was completed in one day. The load versus drift relationship for Specimen SB3 is shown in Fig Applied connection shear and drift ratio versus time histories are shown in Fig Specimen SB3 exhibited a stable response up to loading point 6 during the cycle at 1.15% drift. When loading to point 7, a sudden drop in the lateral load occurred, which is indicated by a circle in Fig This point was believed to mark the initiation of the punching shear failure in Specimen SB3. Unlike Specimens SB1 and SB2, the lateral load resistance of Specimen SB3 decreased for both loading directions during the remaining loading steps at 1.15% drift. 91
106 From Fig. 5-32, it can be seen that a significant drop in gravity shear occurred when the specimen was loaded from point 7 to point 8 during the 1.15% drift cycle. At the end of this cycle, an attempt to increase the applied gravity shear to the target level was unsuccessful, which led to the termination of the test. For comparison purposes, the hysteresis responses of Specimens SB1 and SB2, and Specimens SB1 and SB3 are plotted together in Figs and 5-34, respectively. As can be seen, prior to failure all three specimens exhibited similar hysteresis responses (e.g. similar strength, stiffness and energy dissipation capacity). The similarity in lateral strength among the three specimens indicates that the presence of fiber reinforced concrete in the connection region of Specimens SB1 and SB2 did not lead to an appreciable increase in slab moment capacity. Resultant drift at punching shear failure for each specimen, as well as the loading step at which failure occurred, is listed in Table 5-8. Specimen SB1, with 1.5% volume fraction of regular strength fibers in the slab central region, is considered to have failed in punching shear at a resultant drift of 3.25% (2.3% drift in each loading direction, which is the drift at which a substantial drop in gravity shear occurred. Resultant drift at complete punching shear failure for Specimen SB2 was also equal to 3.25%, although it should be noted that the first drop in gravity shear occurred during the cycle at 1.85% drift (2.6% resultant drift). On the other hand, Specimen SB3 failed in punching at a resultant drift of approximately 1.65% (1.15% drift in each direction). 92
107 5.6.3 Load versus Displacement Envelope Response The load versus displacement envelope responses for all 13 loading points within each drift cycle (Fig. 5-13) are plotted in Figs to The peak and ultimate lateral loads for each point in the loading pattern are listed in Table 5-9. The peak value is defined as the maximum lateral load observed during the test, while the ultimate load is defined as the maximum lateral load at the drift cycle where punching shear failure occurred. Within the elastic range, the stiffness for all three specimens was nearly identical and the influence of fiber reinforced concrete on the load-displacement response was not significant. In general, post-yield lateral loads for Specimen SB1 with regular strength hooked fibers in a 1.5% volume fraction were slightly larger than those for Specimen SB2 for drifts of up to approximately 1.6% in each loading direction. For larger drifts, however, the difference in lateral load increased, as punching shear-related damage developed earlier in Specimen SB2 compared to Specimen SB1. It should be reminded, however, that the volume fraction of high-strength hooked fibers used in Specimen SB2 was 1.36%. The fact that prior to failure the response of Specimen SB3 was very similar to that of the fiber reinforced concrete specimens, particularly Specimens SB1, is a clear indication that the main contribution of fiber reinforcement was in providing ductility to the specimens, as opposed to either strength or stiffness. 93
108 5.6.4 Rotations Connection Rotations Sixteen ± 1 in. stroke Linear Variable Differential Transducers (LVDTs) were installed above and below the slab, as shown in Fig 5-11, to measure slab rotations relative to the column at a distance of 1d and 2d from each column face. The unbalanced moment, which was calculated according to Fig. 5-38, versus rotation responses are presented in Figs through The unbalanced moment was calculated from the loads measured in the vertical actuators at each corner of the slab and the strand loads at mid-span in each direction, as shown in Fig A1, A2, A3 and A4 in Fig refer to the locations of the four vertical actuators. The actuator force is defined as positive under compression (pushing up) while the strand load is defined as positive under tension (pulling down). The resulting positive unbalanced moments in the E-W and N-W loading directions acted about the positive x (south) and positive y (east) axes, respectively. During the cycle where punching shear failure initiated, data recorded from LVDTs, especially those at the bottom surface of the slab, became unreliable due to settlement of the slab (Fig. 5-22). The rotation versus unbalanced moment response for each specimen was then cut off at the point beyond which the LVDT measurements were not believed to be reliable. In Figs through 5-42 the unbalanced moment versus rotation responses for Specimen SB1 were clipped at point 1 in the 2.3% drift cycle. The data for Specimen SB2 were presented up to point 9 during the cycle at 1.85% drift (Figs through 5-45). It should be mentioned that the LVDTs on the top surface of the slab at a distance 94
109 of 1d and 2d from the west column face did not work properly and thus, rotation data for Specimen SB2 on the west side of the connection were not available. For Specimen SB3 (Figs through 5-49), the response was cut off at point 7 of the 1.15% drift cycle. The LVDT on the bottom surface of the slab at a distance of 2d from the south column face did not work and thus, rotations over 2d from the south column face were not available. In all three test specimens, most of the connection rotations concentrated over a distance of 1d from each column face. Thus, little difference was noticed between rotation readings at 1d and 2d from the column faces. As can be seen in Figs through 5-49, Specimen SB1 exhibited a stable moment versus slab rotation hysteresis response. A rotation slightly less than.1 rad corresponded to first yielding of the slab, which occurred during the cycle at.7% drift. Maximum unbalanced moment corresponded to a rotation, on average, of approximately.15 rad. The peak unbalanced moment during subsequent loading cycles remained relatively constant up to a slab rotation of approximately.4 rad, when a punching shear failure initiated. The behavior of Specimen SB2 (Figs through 5-43) was similar to that of Specimen SB1, with maximum rotations at punching shear failure between.37 and.51 rad for all four connections sides. The behavior of Specimen SB3 with headed shear studs was characterized by a limited connection rotation capacity, as shown in Figs through Maximum rotation at failure on all four sides of the connection ranged between.23 rad and.27 rad, the lowest rotation measured on the east side of the connection (Fig. 5-46). 95
110 For each specimen, the peak slab rotations over a distance 2d from the column faces during the last drift cycle prior to punching shear failure (or where data were available) are summarized in Table 5-1. As can be seen, peak connection rotations in Specimens SB1 and SB2 were all greater than or equal to.37 rad prior to punching shear failure. For Specimen SB3, on the other hand, the maximum rotation prior to failure at the north side of the connection was.23 rad, which was the lowest value among all four connection sides. This value is approximately 6% of that in Specimens SB1 and SB Column Base Rotations Column base rotations measured through four ± 2 in. stroke LVDTs at a distance of 14 in. (column effective depth) away from the top face of the base block (Fig. 5-11) are presented in Figs. 5-5 through In Specimens SB1 and SB2, the column rotation corresponding to the peak lateral load was approximately.75 rad. Yielding of the flexural reinforcement corresponded to a column base rotation of approximately.5 rad. By the end of the 2.3% drift cycle, the column base in Specimens SB1 and SB2 had undergone moderate inelastic rotations (peak total rotation on the order of.15 rad). For Specimen SB3, on the other hand, the column base rotation was about.75 rad at the end of 1.15% drift cycle Evaluation of Shear Stresses Using Eccentric Shear Model In the two principal directions, x and y directions, the combined shear stress v at the critical section of the connection due to direct gravity shear V and unbalanced moment M ub at each peak lateral displacement was calculated using the eccentric shear model 96
111 specified in ACI Code Section (ACI Committee 318, 28). The direct gravity shear was calculated by subtracting the upward reaction forces from the vertical actuators supporting the slab from the total downward force due to the slab self-weight and prestressing force in the strands. The unbalanced moment used in the calculation was obtained from the reactions in the four vertical actuators supporting the slab and the applied strand loads, as shown in Fig The maximum connection shear stresses at each peak lateral displacement for the three test specimens are listed in Tables 5-11, 5-12 and 5-13, respectively. The parameters used in the calculation of combined shear stress include: γ = γ =.4, J = J = in 4, A c = in 2 and c = 1.375in. The combined shear stress, considering bending moment in one direction only, can be calculated by using Eq. (4-3). Eq. (5-1), on the other hand, was used to account for bi-axial bending. It should be noted, however, that the stress calculated using Eq. (5-1) only applies to a corner point on the connection critical section, as opposed to the combined shear stress obtained through Eq. (4-3), which applies to an entire side of the critical section. vx vy cx cy v V γ M c γ M c A J J vx ubx vy uby = + + (5-1) c cx cy The peak and ultimate (at which punching shear failure occurred) combined shear stresses for each specimen are summarized in Table In Specimens SB1 and SB2, the peak combined shear stress for loading in each principal direction was approximately equal to 4.5 f c ' (psi). For Specimen SB3, with shear stud reinforcement, the peak shear stress 97
112 was approximately 4 f ' (psi) and 4.3 f ' (psi) for loading in the N-S and E-W c c direction, respectively. When Eq. (5-1) is used to account for bi-axial bending rather than bending in one direction only, a peak shear stress of 6.5 f ' (psi) and 7. f ' (psi) is c c obtained for Specimens SB1 and SB2, respectively. For Specimen SB3, on the other hand, the peak shear stress caused by gravity-induced shear and bi-axial bending was 5.7 f c ' (psi). In the E-W direction, the maximum shear stresses (peak value) in Specimens SB1 and SB2 were 8% and 14% higher, respectively, than the peak shear stress in Specimen SB3. In the N-S direction, these stresses were 13% and 2% higher for Specimens SB1 and SB2, respectively, compared to Specimen SB3. From either the uni-axial eccentric model or the bi-axial eccentric model, the largest punching shear stress among all three test specimens was carried by Specimen SB2. Specimen SB1, however, showed a slightly larger ductility than Specimen SB2. The nominal shear stress capacity of the connection in Specimen SB3, calculated according to the 28 ACI Building Code (ACI Committee 318, 28) as the summation of the concrete and the shear stud contributions to shear strength, was equal to ' 489. f (psi) (see Appendix B, where f = 645 (psi)). The peak shear stress demand ' c c obtained using Eq. (4-3), however, was 429. f (psi), calculated at point 1 during the.9% drift cycle, which is 12% lower than the nominal shear stress capacity. If the concrete contribution to shear strength is reduced by 25%, as recommended by ACI ' c 98
113 Committee 352 (1989) to account for the effect of inelastic displacement reversals, a nominal shear stress of 414. f (psi) would be obtained, which is just 3% below the ' c calculated shear stress demand. Given these results and the fact that the peak shear stress demand was less than 1% higher than the shear stress level for which shear reinforcement is not required for the configuration tested ( 4 ' f c, psi), it can be argued that the shear stud reinforcement played little or no role in increasing both the strength and deformation capacity of the connection. From inspection of the connection in Specimen SB3 after punching shear failure, it seems that the shear stud reinforcement was not effective in bridging the primary punching shear crack once it formed, as evidenced by the breakout failure of the concrete engaged by the second line of studs. One argument that could be made is that, as described in Section 1.3, the fact that shear studs rely on mechanical anchorage at their ends may require a wide diagonal crack in order for the shear studs to yield. In this case, the use of 3 ' f c (psi) for the concrete contribution to shear strength may not be adequate. On the other hand, the use of 2 ' f c (psi), as for connections with shear reinforcement other than shear studs, would have led to a safe prediction of the shear capacity of the connection. More troubling, however, is the fact that the shear stud reinforcement seems to have been little or no effective in increasing connection ductility. The maximum combined shear stress according to Eq. (4-3), calculated at the section d/2 outside the interface between the fiber reinforced material (44 x 44 in.) and the regular 99
114 concrete was approximately 8. f (psi) for both Specimen SB1 and SB2, where ' c ' f c refers to the cylinder compressive strength of the regular concrete. None of these specimens failed or exhibited distress at the interface between the fiber reinforced concrete region and the surrounding regular concrete portion of the slab. Again, although the specimens did not reach the critical value of 2 ' f c (psi), this value seems to be an adequate limit for the shear stress demand at the location between fiber reinforced concrete and regular concrete Shear Stress versus Rotation Interaction In Figs and 4-39, the shear stress and corresponding rotation at failure for specimen pairs S9 and S1, and S7 and S8, subjected to monotonically increased loading, was compared with the peak rotation values for Specimens SU1 and SU2 (no failure occurred in this specimens), respectively, subjected to uni-directional lateral displacements. Also shown in the figures were the peak shear stress and corresponding rotation values for Specimens SU1 and SU2. This comparison was made for specimens with the same fiber reinforced concrete material in the connection region (i.e. high-strength or regular strength hooked steel fibers in a 1.5% volume fraction). The plots in Figs and 4-39 are repeated in Figs and 5-54, but with the addition of the test results from Specimens SB2 and SB1, respectively. The slab rotations in Specimens SB1 and SB2 were measured at a distance of 2d from the column face as well as Specimen SU1 and SU2, while the shear stress on the critical section was calculated according to the eccentric shear model, based on Eqs. (4-3) and (5-1). 1
115 In Fig. 5-54, the data point for Specimen SB1 representing the peak rotation with its corresponding shear stress (Eq. (4-3)) was obtained for the E-W direction at loading point 8 during the 2.3% drift cycle. The shear stress accounting for unbalanced moments in both principal directions (Eq. (5-1) was also calculated at this loading point, which was the last diagonal displacement (S-W) before Specimen SB1 failed in punching shear. Although not correct, the corresponding total rotation at this point was conveniently assumed to be represented by the square root of the summation of the squared rotations from the east and north sides of the connection, as (( ) 2 ( ) 2 ) θ = θ + θ total East North (5-2) Specimen SB2 completely failed in punching shear during the 2.3% drift cycle. However, rotation data were not available beyond loading point 9 during the 1.85% drift cycle. In Fig. 5-53, the peak recorded rotation with its corresponding shear stress (Eq. (4-3)) was obtained at loading point 8 during the 1.85% drift cycle. The shear stress due to bi-axial bending was calculated according to Eq. (5-1) at the same loading point as well, while the corresponding rotation was calculated by using Eq. (5-2). Comparing the peak rotation data for Specimens SB1 and SU2, calculated according to Eq. (4-3), a 27% decrease in shear stress was obtained for bi-axial loading. In both cases, the peak rotation was nearly identical (7% difference). On the other hand, the shear stress and rotational capacity of Specimen SB2 decreased approximately 3% and 35%, respectively, compared to those in Specimen SU1. It should be reminded that the fiber volume fraction in Specimen SB2 was 1.36% and the point representing peak rotation 11
116 was selected in the 1.85% drift cycle. From Table 5-1 through 5-12, it suggests that under combined shear stress of 35. f (psi), a rotation of.35 rad. over a distance 2d ' c from the column face could be taken as a conservative lower bound for the rotation capacity of connections with the fiber reinforced concretes evaluated. When plotting in Figs and 5-54 the shear stress and rotation values calculated according to Eqs. (5-1) and (5-2), respectively, the points corresponding to Specimens SB1 and SB2 are seen to fall above the trend observed for the specimens under monotonically increased loading and uni-axial lateral displacements. This is due to the use of a shear stress at a corner connection point, which is substantially larger than the shear stress calculated according to Eq. (4-3). These results imply no (or even a beneficial) effect of bi-axial lateral displacements on connection shear stress versus rotation interaction, which is contrary to logic and is not supported by the overall behavior of the test specimens. Thus, the use of a shear stress measure at a connection corner point is not recommended Steel Strains Specimen SB1 Unfortunately, several of the strain gauges attached to the slab flexural reinforcement were damaged during the casting of the slab. In Specimen SB1, strain gauges attached to the top slab flexural reinforcement TE1, TE13, TS1, TS5, TS11 and TS12 were damaged (see Fig. 5-9 for location of strain gauges). Based on the available readings, steel yielding on the top layer of steel bars was observed at six locations, all located at a distance of d/2 12
117 from the column faces. No steel yielding was found from the strain gauges located at 2.5d from the column faces. First steel yielding in the slab of Specimen SB1 was observed at the location of strain gauge TE2 during the.7% drift cycle (Fig. 5-55). At a drift of 1.15%, readings from strain gauges TE3 and TS3 also gave indication of steel yielding, as shown in Figs and 5-57, respectively. During the cycles at 1.4% and 1.85% drift, steel yielding was also detected by strain gauges TS2 and TE8, respectively. At punching failure, strains beyond yielding were measured by strain gauge TE6 (Fig. 5-58), which was located near the failure surface. Steel strains were within the elastic range throughout the test at all other strain gauge locations. The strain distributions at a distance of d/2 from the north and east column faces are shown in Figs and Fig. 5-6, respectively, for loading in the south and west direction. For strain gauges installed on the steel bars running in the East-West direction, the readings were collected at loading point 7 (Fig. 5-13) in each displacement cycle. For the steel running perpendicularly, the readings were collected at loading point 4. Test data indicate that yielding of the top steel reinforcement in the transverse direction was limited to a width of 3 in., which corresponded approximately to a width of C 2 +3d, where C 2 is the column width. On the bottom reinforcement, strain gauges BE1, BE2 and BS1 were broken prior to the test. The steel strains at all strain gauge locations on the bottom layer of reinforcement were all within the elastic range up to the end of the test. At punching failure, however, 13
118 yielding was detected on the instrumented bottom bars passing through the column, as shown in Fig This yielding was believed to be caused by the dropping of the slab and the opening of the primary punching shear crack. The steel strains at north-west and south-east corners of the column base were measured at a distance of 1 in. and 7 in. above the base block by four strain gauges (Fig. 5-1). For strain gauges located at 1 in. above the base block, yielding of these two corner steel bars both occurred during the 1.15% drift cycle. The strain history for the south-east corner bar is shown Fig At a distance of 7 in. above the base block, yielding was observed during the 1.4% and 1.6% drift cycles for the steel bars at the north-west and south-east corners, respectively Specimen SB2 Similarly to Specimen SB1, several strain gauges on the slab reinforcement of Specimen SB2 were damaged prior to testing. On the top slab reinforcement, strain gauges TE4, TE13 and TS5 were damaged. Although Specimen SB2 failed in punching during the 2.3% drift cycle, most strain gauges did not work properly after the 1.85% drift cycle. Yielding of the slab top reinforcement was first detected at the location strain gauge TE3 at the beginning of the.7% drift cycle, as shown in Fig Later in the same drift cycle, readings from strain gauge TS3 also showed yielding at that location (Fig. 5-64). The only other indication of yielding of steel occurred during the cycle at 1.6% drift from readings of strain gauge TE2, as shown in Fig The strain distribution across the slab at d/2 from the north and east column faces are 14
119 presented in Figs and 5-67, respectively. It seems that yielding of flexural reinforcement in Specimen SB2 was limited to a width of 24 in., which is approximately equal to a width of C 2 +2d. With respect to the bottom reinforcement, elastic behavior was observed from the strain gauges that were operational prior to the test (data from strain gauges BE1 and BE2 were not available). As in Specimen SB1, the development of a punching shear failure led to some reinforcement yielding, as evidenced by the readings from strain gauge BS3 (Fig. 5-68). Strain gauges installed on the longitudinal column bars at a distance of 1 in. above the base block indicated that steel yielding occurred at those locations during 1.15% drift cycle. Strain gauges at 7 in. above the base block on the north-west and south-east corner bars, however, did not show yielding until the 1.6% and 1.85% drift cycles, respectively Specimen SB3 Readings from strain gauge TS2 indicated that first steel yielding occurred during the cycle at.45% drift, as shown in Figs Steel strains at locations of strain gauges TE2, TE3, and TS3 exhibited yielding during the.7% drift cycle, as shown in Figs. 5-7 through At the end of the 1.15% drift cycle, as punching shear failure occurred, readings from strain gauges TS1, TS4, TS5 and TS8 exceeded the theoretical yield strain. Fig shows the strain history obtained from strain gauge TS1. The strain distributions at a distance d/2 from the North and East column faces are shown 15
120 in Figs and 5-75, respectively. As can be seen, flexural yielding was limited to a width of 3 in. (C 2 +3d) at the center of the slab, as in Specimen SB1. Yielding of bottom steel reinforcement in Specimen SB3 was observed at punching shear failure of the slab. However, this yielding was believed to have been triggered by the dropping of the slab and the growing of the punching shear crack as punching failure occurred, as in the other two specimens. Fig shows an example of the readings obtained from two of the strain gauges in the connection region (strain gauges BS3 and BS4). Yielding of column longitudinal reinforcement was very limited because punching shear failure occurred soon after yielding had initiated during the cycle at 1.15% drift at the north-west corner bar, 1 in. above the base block. At other three locations, the steel strains were within the elastic range throughout the test Average Strains from Measurement of LVDTs Average strains for the slab reinforcement, calculated from readings of LVDTs over a distance of 1d from the column face, are compared with the strains measured through strain gauges located at a distance d/2 from the column face. A comparison of these two strains for the north and west sides of the connection of the test specimens is presented in Figs through For Specimen SB2, however, this comparison was only made for the north side of the connection due to a malfunction of one of the LVDTs placed on the connection west side. It is worth mentioning that a similar behavior was observed for the east and south sides of the slab, when strain gauge data were available. 16
121 As can be seen in Figs. 5-8 and 5-81, the strain gauge data and the average strains calculated from LVDTs showed good agreement for Specimen SB3, particularly on the west side of the connection. However, larger differences in the two strain measurements can be observed for Specimens SB1 and SB2, with fiber reinforced concrete in the connection. As explained in Section 4.6.7, this is attributed to the increased bond between reinforcing bars and fiber reinforced concrete, which makes strain gauge readings more sensitive to the crack location. Out of the two fiber reinforced concrete connections, the largest difference was observed for Specimen SB2 (Fig. 5-79), with high-strength hooked fibers, which is consistent with the results obtained from the uni-axial lateral displacement tests, as discussed in Section Curvature Curvatures at various slab sections were calculated based on readings from strain gauges attached to the top and bottom reinforcing bars at a distance of d/2 from the column face. Given the sensitivity of strain gauge readings to crack location, the calculated values of curvature are meant to provide an idea about the distribution of flexural deformations across the slab width rather than precise information about the magnitude of such deformations. Because the layout of the top and bottom reinforcement differed, interpolation of the strains measured by strain gauges was done at distances equal to in., 38 in., 7 in., 86 in., 94 in., and 12 in. from the edge of the slab. The latter two sections correspond to the edge of the column and to the center of the slab, respectively. It should be mentioned that for Specimens SB1 and SB2, the transition between regular concrete and fiber reinforced concrete occurred a 7 in. from the edges of the slab. 17
122 The curvature profiles for the slab of all three test specimens, calculated for the north section of the slab d/2 away from the north side of the column, are shown in Figs through In these figures, a section subjected to tension at the bottom and compression at the top would exhibit positive curvature. It should be noted that because not all strain gauges were operational during testing, curvature data for some of the sections were not available. In Specimen SB3, the curvatures were not available at a distance of 86 in. and 94 in. from the edge of the slab due to broken strain gauge TS7. A straight line was used in Fig between the curvature value at 7 in. and 12 in. from the edge of the slab. As can be seen in the figures, slab curvatures mostly concentrated between 86 in. and 12 in. from the slab edges. Taking into account the entire slab width, this would translate into the central 32 in. (approximately 6d) of the slab, regardless of the type of concrete used in the connection region. 5.7 INFLUENCE OF REINFORCEMENT AND GRAVITY SHEAR RATIOS ON SHEAR STRENGTH AND LATERAL DRIFT CAPACITY The relationship between shear stresses on the connection critical section according to Eq. (4-3) and reinforcement ratio within the effective slab for Specimens SB1, SB2 and SB3 are presented in Fig The shear stress for each specimen was selected at the point just before punching shear failure occurred, which is consistent with results reported by other researchers. 18
123 From Figs and 5-86, it can be seen that even though Specimens SB1 and SB2 were subjected to bi-axial lateral displacements, the proposed relationship given by Eq. (4-6), which was developed based on results from uni-axial lateral displacement tests, is still adequate. For Specimen SB3, however, this relationship overestimated the strength by approximately 2%, which is likely to be due to the influence of bi-axial lateral displacements on the behavior of this specimen. The drift versus gravity shear ratio relationship previously shown in Fig is now plotted in Fig including the test results from Specimens SB1, SB2 and SB3. The resultant drift ratio was used for those three specimens, while the combined shear stress was calculated according to Eq. (4-3) given the arguable meaning of a stress at a corner connection point. From Fig. 5-87, it is seen that the experimental results from the three test specimens satisfied the specification of Section in the current ACI Building Code (ACI Committee 318, 28). A more conservative trend is obtained, however, when gravity shear ratio is normalized by Eq. (4-6), as shown in Fig While the failure drifts for Specimens SB1 and SB2 are considerably greater than the drift assumed in the ACI Code relationship, the data point corresponding to Specimen SB3 is close to this relationship and comparable to several test results from connections without shear reinforcement. This makes it difficult to draw any conclusion with regard to the effectiveness of the shear stud reinforcement in increasing the ductility of Specimen SB3. 19
124 CHAPTER 6 CONCLUSIONS In this research, the use of discontinuous steel fiber reinforcement to increase punching shear strength and deformation capacity of slab-column connections was investigated. Both gravity-type and earthquake-type loadings were evaluated. For comparison purposes, the effectiveness of headed studs as shear reinforcement in slab-column connections subjected to lateral displacement reversals was also investigated. The experimental phase of this research was conducted in three stages. First, a series of fiber reinforced concrete slab tests under monotonically increased load was conducted. A total of ten slabs were tested, eight of which were constructed with various types of fiber reinforced concrete. Parameters investigated in this phase included fiber type, fiber volume fraction, and steel tension reinforcement ratio. Among all specimens, the slabs reinforced with a 1.5% volume fraction of either regular strength or high-strength hooked steel fibers exhibited the best performance in terms of punching shear strength, deformation capacity and energy absorption. These two materials were then selected for further investigation in connections subjected to lateral load reversals. In the second testing stage, two approximately 1/2-scale slab-column subassemblies, reinforced with either regular strength or high-strength hooked steel fibers in a 1.5% volume fraction, were tested under combined gravity load and uni-axial lateral displacement reversals. Fiber reinforcement was used only in the connection region over a distance of four slab thickness from each column face. The gravity shear ratio at peak displacement, targeted at 1/2, ranged between.3 and.56 for drift ratios less than 3%. The test specimen reinforced with regular strength hooked fibers exhibited punching shear-related damage during the 4% drift cycle at a target gravity shear ratio of 1/2. Despite of the connection damage, this specimen was able to sustain the applied gravity shear during subsequent loading cycles. For the loading cycles at 5% drift, the gravity 11
125 shear ratio ranged between.19 and.32. The specimen with high-strength hooked steel fibers, on the other hand, sustained displacement cycles of up to 5% drift with little damage in the connection region. At the peak displacement demand, this specimen was subjected to a gravity shear ratio of.4 and.45 for the two loading directions. Peak connection rotations in the two test specimens exceeded.5 rad. After completion of the lateral displacement cycles, the specimens with regular strength and high-strength hooked fibers were able to sustain an applied gravity shear stress of 3 respectively. ' f c (psi) and 4 ' f c (psi), In the last experimental phase, three nearly full-scale slab-column subassemblies were tested under combined gravity load and bi-axial lateral displacement reversals. The connection of the first two specimens was constructed with the same fiber reinforced concretes evaluated in the second testing phase. The connection in the third specimen, on the other hand, was reinforced with headed shear studs, designed according to the 28 ACI Building Code (ACI Committee 318, 28). The two fiber reinforced concrete connection subassemblies showed a drift capacity of approximately 2.3% in each principal direction, with average peak connection rotations on the order of.4 rad. The specimen with shear stud reinforcement, on the other hand, failed by punching shear during the cycle at 1.15% drift in each principal direction. Average peak connection rotation for this specimen was.26 rad. From the experiments and analyses conducted in this research the following conclusions can be drawn. (1) The addition of steel fibers in the slab-column connections tested under monotonically increased load led to an increase in slab punching shear strength and/or ductility. Among the fiber reinforced concretes evaluated, those reinforced with a 1.5% volume fraction of either regular strength or high-strength hooked steel fibers led to the best behavior in terms of punching shear strength, ductility, and energy absorption. Specimens S7 and S8, with regular strength hooked steel fibers in a 1.5% volume fraction, exhibited the largest punching shear strength. Compared to 111
126 the regular concrete Specimens S1 and S2 with 4 in. and 6 in. bar spacing, respectively, these two specimens showed an approximately 5% increase in strength. On the other hand, Specimens S9 and S1, with a 1.5% volume fraction of highstrength hooked steel fibers, exhibited an 8% and 12% increase in deformation capacity compared to the control specimens. No appreciable change in stiffness was observed due to the addition of fibers. (2) For specimens under monotonically increased loading, the increase in punching shear strength due to the use of fiber reinforced concrete may lead to a change in failure mode from punching shear failure to flexural yielding. The behavior of Specimen S1, with a 1.5% volume fraction of high-strength hooked steel fibers, partially illustrated this phenomenon. In this specimen, the increase in punching shear resistance allowed the slab to exhibit substantial flexural yielding prior to punching shear failure. (3) Test results showed that using fiber reinforced concrete only in the connection region was sufficient to increase punching shear resistance in the specimens subjected to monotonically increased loading, as well as in those subjected to combined gravity load and lateral displacements. A limit of 2 ' f c (psi) for the shear stress in the transition region between fiber reinforced concrete and regular concrete was found to be adequate for determining the extension of the fiber reinforced concrete portion of the slab. (4) From the limited experience gained during this investigation, a concrete slump prior to the addition of hooked steel fibers in a 1.5% volume fraction between 6 in. and 1 in. is recommended. The lower slump limit was found to be sufficient to ensure adequate workability while the upper limit is meant to prevent excessive flow of fiber reinforced concrete into the slab regions outside of the slab-column connection. (5) Specimen SU1, reinforced with a 1.5% volume fraction of high-strength hooked steel fibers in the connection region, was able to sustain lateral displacement cycles of up 112
127 to 5% drift under a gravity shear ratio at peak displacement for each loading cycle that ranged between.29 and.59. At the end of the test, a monotonically increased load corresponding to a connection shear stress of 4 ' f c (psi) was applied and only minor damage could be observed in the connection region. (6) Specimen SU2, reinforced with a 1.5% volume fraction of regular strength hooked steel fibers in the connection region, showed punching shear-related damage at 4% drift under a gravity shear ratio of approximately.4. However, this specimen was able to sustain additional drift cycles of up to 5% under a gravity shear ratio at peak displacement for each loading cycle that ranged between.19 and.35. After completion of the lateral displacement cycles, the connection of this specimen was able to sustain a gravity shear stress of 3 ' f c (psi). (7) Test results from Specimens SU1 and SU2 indicate that under a combined shear stresses due to gravity load and unbalanced moment less than or equal to ' 4 f c (psi), a rotation capacity of at least.5 rad. can be expected in connections constructed with either high-strength or regular strength hooked steel fibers in a 1.5% volume fraction. (8) A review of previously published experimental data on slab-column connections subjected to combined gravity load and lateral displacement reversals indicates that the shear resistance of ' 4 f c (psi) specified in the ACI Building Code (ACI Committee 318, 28) may not be conservative for use in lightly-reinforced slabcolumn connections. The effect of tensile reinforcement ratio over the slab effective width, ρ tension the following expression,, on ultimate connection shear stress, v u, can be taken into account using ' ρ vu = f c. + tension (psi) where ρ ρ 12 minimum tension. Eq. (4-6) 113
128 Alternatively, the concrete shear strength may be reduced by 25%, as recommended by ACI Committee 352 (1989), to account for the effect of inelastic displacement reversals. (9) Concrete reinforced with either regular strength or high-strength hooked steel fibers in a 1.5% volume fraction was found to be more effective in increasing punching shear resistance and deformation capacity of slab-column connections than headed shear stud reinforcement. The limited test results suggest that current ACI Code design criteria (ACI Committee 318, 28) for headed shear studs in slab-column connections that may be subjected to earthquake-induced deformations is not conservative. The use of a concrete shear stress limit of 2 f ' (psi), as is the case c for other types of shear reinforcement, would have led to a slightly conservative estimation of punching shear strength in the test specimen with shear stud reinforcement. However, the shear stud reinforcement seems to have had little or no effect in enhancing connection ductility. (1) Specimens SB1 and SB2, subjected to bi-axial lateral displacements and reinforced with a 1.5% volume fraction of either regular strength or high-strength hooked steel fibers in the connection, failed in punching shear during the 2.3% drift cycle (each principal direction) under a gravity shear ratio of approximately.4. At failure, fiber pullout was evident in the connection of these two specimens. Specimen SB3, whose connection was reinforced with headed shear studs as opposed to fiber reinforcement, failed in punching shear during the 1.15% drift cycle (each principal direction) under approximately the same gravity shear ratio. Punching shear failure in this specimen developed after a breakout failure of the concrete engaged by the second line of studs. In Specimens SB1 and SB2, the peak combined shear stress for bending about each principal direction was approximately equal to 4.5 f ' (psi), c while that for Specimen SB3 was approximately 4.3 f ' (psi). c 114
129 (11) The application of bi-axial lateral displacement reversals led to a decrease in both connection shear strength and rotational capacity compared to those in connections under uni-axial displacement reversals. For connections under bi-axial bending constructed with the fiber reinforced concretes, a shear stress upper limit for bending about each principal direction of 3. 5 f (psi) should result in an average rotation capacity (at 2d from column face) of at least.35 rad in each direction. ' c Even though extensive experimental studies were conducted as part of this investigation, further experimental research, coupled with analytical studies, is needed in the following areas, (1) Behavior of slab-column connections with lower fiber volume content under combined gravity load and lateral displacement reversals. In this research, only fiber reinforced concretes with a 1.5% volume fraction of hooked steel fibers were evaluated for use in connections under earthquake-type loading. Given the increase in cost associated with the addition of fibers to the concrete, the ability of lower fiber content concretes to increase connection punching shear strength and deformation capacity should be evaluated. (2) Efficiency of shear stud reinforcement in slab-column connections subjected to reversals of inelastic deformation. The results from the test of Specimen SB3 indicated that current provisions in the 28 ACI Building Code (ACI Committee 318, 28) for the design of shear stud reinforcement in slab-column connections subjected to earthquake-induced displacements are potentially unsafe. Further studies are needed to better assess shear stud strength, anchorage, and spacing requirements in connections subjected to inelastic rotation reversals. (3) Retrofit of existing slab-column connections with shear stud reinforcement. Given the test results of Specimen SB3, little intrusive retrofit schemes for slab-column connections with shear stud reinforcement susceptible to punching shear failures should be evaluated. 115
130 Table 2-1 Summary of Tests of Interior Slab-Column Connections Without Shear Reinforcement Researchers Label Slab Thickness (in.) Setup (Fig. 2-6) V g V c Target V g V at c Peak Load Ultimate Drift (%) (Punching Failure) Drift at Peak Load (%) Failure Mode* Slab Rotation at Punching (rad); Measurement location from column face S P ~.2; 6 in. Hawkins et al. (1974) S2 S3 6 6 (b) & (d) P P ~.12; 6 in. ~.25; 6 in. S P ~.14; 6 in. Symonds et al. (1976) S6 S7 S (b) & (d) P P F-P ~.14; 6 in. ~.2; 6 in. ~.42; 6 in. Ghali et al. (1976) SM.5 SM1. SM (a) & (c) NA NA NA 6.5 (Non-cyclic) 2.7 (Non-cyclic) 2. (Non-cyclic) 4.3** F-P P P NA NA NA Islam and Park (1976) 1 2 3C (b) & (d) (Non-cyclic) 5. (Non-cyclic) P P P NA NA NA Morrison and Sozen (1981) S4 S5 3 3 (b) & (c).8.16 NA NA F-P F-P.4; 5 in..37; 5 in. Zee and Moehle (1984) INT 2.4 (b) & (c) P ~.44; 5.4 in. AP F-P ~.35; 4.8 in. Pan and Moehle AP2 4.8 (a)(b)& (EW) 1.5(EW) F-P ~.19(EW); 4.8 in. (1989) AP3 4.8 (c) F-P ~.29; 4.8 in. 116 AP (EW) 3.2(EW) F-P ~.22(EW); 4.8 in.
131 Robertson and Durrani (199) Wey and Durrani (1992) Durrani and Duo (1992) Farhey et. al (1993) Robertson et al. (22) Robertson and Johnson (26) 3SE F-P NA 5SO P NA (b) & (c) 6LL P NA 7L P NA SC 4.5 (b) & (c) P.15; 8 in. DNY_ (b) & (c) DNY_ NA NA (a) & (c) NA NA P P ~.26, 6in. ~.7, 6in. F-P.11; 7.9 in. F-P.12; 7.9 in. F-P.43; 7.9 in. F-P.61; 7.9 in. 1C 9.8 (b) & (c) P NA ND1C DN4LL ND5XL ND6HR ND7LR (b) & (c) F-P F-P P P F-P NA NA NA NA NA * F-P: Flexural yielding prior to punching shear failure; P: Punching shear failure before flexural yielding. **Value calculated as the average of displacement at the elastic limit and displacement at failure from idealized load-deflection curve shown in the original paper. ~: Approximate value taken from original plot. : Specimen subjected to biaxial lateral displacements. EW: East-west loading direction. 117
132 Table 3-1 Test Specimens Specimen Steel Fiber Shape Fiber Diameter (Fiber Length) Fiber Strength Cement-Based Material V f Rebar Spacing S1 & S Concrete % 4 in. & 6 in. S3 & S4 Hooked.2 in. (1.2 in.) 16 ksi Concrete 1% 4 in. & 6 in. S5* & S6* Twisted.2 in. ** (1.4 in.) 26 ksi Mortar 1.5% 4 in. & 6 in. S7 & S8 Hooked.2 in. (1.2 in.) 16 ksi Concrete 1.5% 4 in. & 6 in. S9* & S1* Hooked.15 in. (1.2 in.) 335 ksi Concrete 1.5% 4 in. & 6 in. V f : Fiber volume fraction *FRC only in 3x3 in. slab central region ** Equivalent diameter Table 3-2 Concrete Cylinder Strength (ksi) Specimen Material Strength Average Strength S1 & S2 Regular Concrete N/A S3 & S4 3.9 Concrete with % Hooked Steel Fiber Concrete Regular Concrete S5 9.4 Mortar with 1.5% Twisted Steel Fibers Regular Concrete S Mortar with 1.5% Twisted Steel Fibers S7 & S Concrete with % Hooked Steel Fiber Regular Concrete S9 6.7 Concrete with % High-Strength Hooked Steel Fibers N/A 8.15 Regular Concrete S Concrete with % High-Strength Hooked Steel Fibers
133 Table 3-3 Steel Strength Specimen Yield Stress (ksi) Average Yield Stress (ksi) Peak Stress (ksi) Average Ultimate Stress (ksi) S1 & S S3 & S S5 & S S7, S8, S9 & S
134 Table 3-4 Load and Deflection at Peak Specimen Material Rebar Spacing Concrete Strength (psi) Peak Load, P max P max ' Deflection at b (kips) d f c Peak Load (in.) S1 4 in Regular Concrete S2 6 in S3 Concrete with 4 in % Hooked Steel S4 Fibers 6 in S5 Mortar with 4 in S6 1.5% Twisted Fibers* 6 in S7 Concrete with 4 in S8 1.5% Hooked Steel Fibers 6 in S9 Concrete with 1.5% 4 in S1 Hight-Strength Hooked Steel Fibers* 6 in *FRC only in 3x3 in. slab central region 12
135 Table 3-5 Strength Comparison (a) Specimens with 4 in. rebar spacing Specimen Failure Mode P max ' b d f c P max for S1 P max / S1 Punching S3 Punching S5 Punching S7 Punching S9 Punching* * Results of Specimen S9 were believed to have been affected by significant air voids that required patching (b) Specimens with 6 in. rebar spacing Specimen Failure Mode P max ' b d f c P max for S2 P max / S2 Flexure-Punching* S4 Flexure-Punching* S6 Flexure-Punching* S8 Flexure-Punching* S1 Flexure-Punching* *Punching shear failure preceded by flexural yielding Table 3-6 Strength Estimations using Yield-Line Analysis Specimen Rebar Spacing Steel Yield Strength (ksi) Concrete Strength (ksi) Peak Load (kips) Yield-Line Analysis (kips) Test Yield-Line S1 4 in S2 6 in S3 4 in S4 6 in S5 4 in S6 6 in S7 4 in S8 6 in S9 4 in S1 6 in
136 Table 3-7 Comparison of Deflection Capacities Specimen Δ Δ / Δ Δ R S S S S S S S S S S Rc R Rc Table 3-8 Energy Absorption Specimen Deflection at Peak Load (in.) Deflection at.75 Peak Load (in.) Normalized Energy* Energy/ S1 Energy Energy/ S2 Energy S x S x 1. S x S x 1.23 S x S x 1.61 S x S x 1.74 S x S x 2.45 *Normalized Energy: Area under bd o P f ' c versus deflection plot up to.75 peak load residual strength 122
137 Table 4-1 Main Features of Test Specimens Specimen Slab Dimensions (in.) d (1) (in.) C (2) (in.) Fiber Reinforced Area (in.) Fiber Type V f (3) (%) Column Strip Effective Width (4) ρ top ρ ρ bot top ρ bot SU1 18 x 18 x x x 44 Dramix ZP SU2 18 x 18 x x x 44 Dramix RC 8/3 BP (1) d: Slab effective depth (2) C: Column plan dimension (3) V f : Fiber volume fraction (4) ρ : Reinforcement ratio 123
138 Table 4-2 Applied Gravity Shear Required Force for Fiber Concrete Specimen 1/2 Gravity Shear Strength (ksi) Ratio (kips) (1) Slab Weight (kips) (2) Channel Weight (kips) (3) Applied Force (kips) SU SU ' (1) bd 4 2 o f c, where b o = 4( ) = 61 in. and d = 3.25 in. (2) Slab weight outside critical section. Assumed concrete unit weight equal to 15 lb/ft 3 (3) C 1 x 2, 16 in. long perpendicular to loading direction and 84 in. long parallel to loading direction Table 4-3 Concrete Cylinder Strength (ksi) Specimen Slab Column Material Strength Average Top Bottom 4.33 Regular Concrete SU1 8.68(1) 8.84(1) Concrete with 1.5% High 8.68(1) Strength Steel Fibers 8.63(2) (2) 7.93(2) 8.8 Regular Concrete SU2 6.99(1) 6.89(1) 6.59(1) Concrete with 1.5% Regular 5.46(1) Strength Steel Fibers 7.64(2) (2) 6.89(2) 8.3(2) (1) Data from batch 1; (2) Data from batch 2 124
139 Table 4-4 Beam Test Result First Peak Specimen Load (kips) Deflection (in.) Load (kips) Second Peak Deflection (in.) P15,.75 (1) (kips) P15, 3. (2) SU SU All tests conducted on 6 x 6 x 2 (in.) beams (1) P15,.75: Load at.3 in. (.75mm) deflection (2) P15, 3.: Load at 1.2 in. (3 mm) deflection (kips) Table 4-5 Steel Strength Reinforcement Yield Stress (ksi) Average Yield Ultimate Stress Stress (ksi) (ksi) No No No Average Ultimate Stress (ksi)
140 Table 4-6 Shear Stress at Critical Section for Specimen SU1 under a 1/2 Gravity Shear Ratio Drift (%) Peak Lateral Gravity Shear Unbalanced Maximum Shear Normalized Max. Load (kips) kips (1) Ratio (2) Moment (kips-in) Stress (psi) Shear Stress (3)
141 Table 4-6 continued (1) Data from bottom load cell ' ' (2) Direct Shear 4 fc bod where f c = 849 (psi) and Direct Shear = Bottom load cell reading + slab self-weight ' (3) Normalized by f c (psi) Table 4-7 Shear Stress at Critical Section for Specimen SU1 under a 5/8 Gravity Shear Ratio Drift (%) Peak Lateral Gravity Shear Unbalanced Maximum Shear Normalized Max. Load (kips) kips Ratio Moment (kips-in) Stress (psi) Shear Stress
142 Table 4-8 Shear Stress at Critical Section for Specimen SU2 under a 1/2 Gravity Shear Ratio Drift (%) Peak Lateral Gravity Shear Unbalanced Maximum Shear Normalized Max. Load (kips) kips Ratio (1) Moment (kips-in) Stress (psi) Shear Stress
143 Table 4-8 continued x x x x x x (1) Direct Shear ' ' 4 fc bod where f c = 694 (psi) and Direct Shear = Bottom load cell readings + slab self-weight Table 4-9 Shear Stress at Critical Section for Specimen SU2 under a 5/8 Gravity Shear Ratio Drift (%) Peak Lateral Gravity Shear Unbalanced Maximum Shear Normalized Max. Load (kips) kips Ratio Moment (kips-in) Stress (psi) Shear Stress
144 Table 4-1 Comparison of Experimental Results 13 Authors Hawkins et al. (1974) Symonds et al. (1976) Islam and Park (1976) Zee and Moehle (1984) Pan and Moehle (1989) Robertson and Durrani (199) Wey and Durrani (1992) Durrani and Duo (1992) Robertson et al. (22) Robertson and Johnson (26) Label S1 S2 S3 S4 S6 S7 S C V at Peak M (kips) ub d avg (in.) C1 (in.) C2 (in.) VV c at Peak M ub Ultimate Drift (%) (Punching Failure) (Non-cyclic) 5. (Non-cyclic) 5.2 Ultimate M (kips-in) ub v ACI ' fc ρ top (%) (1) INT AP1 AP2 AP3 AP4 3SE 5SO 6LL 7L (East-West) (East-West) SC DNY_2 DNY_ C ND1C DN4LL ND5XL ND6HR ND7LR (1).54 (1).54 (1) (2).49 (2)
145 SU Did not fail Current Study SU Did not fail (1) Calculate over a width equal to C2+3h. (2) Equivalent flexural reinforcement ratio converted from Grade 4 steel to Grade 6 steel by multiplying the original flexural reinforcement ratio by 2/3. 131
146 Table 5-1 Main Features of Test Specimens Specimen Slab Dimensions (in.) d (1) (in.) C (2) (in.) Fiber Reinforced Area (in.) Shear Reinforcement Type V f (3) (%) Column Strip Effective Width ρ (4) top ρ (4) ρ bot top ρ bot SB1 24 x 24 x x16 64 x 64 (in.) Dramix ZP SB2 24 x 24 x x16 65 x 64 (in.) Dramix RC 8/3 BP SB3 24 x 24 x x16 N/A Headed Shear Studs N/A (1) d: Slab effective depth (2) C: Column plan dimension (3) V f : Fiber volume fraction (4) ρ : Reinforcement ratio Table 5-2 Applied Gravity Shear Specimen Concrete Strength (ksi) Required Force for 1/2 Gravity Shear Ratio (1) (kips) Slab Weight (2) (kips) Weight of Steel Tubes (3) (kips) Applied Force (kips) SB SB SB ' (1) bd 4 2 o f c, where b o = 4( ) = 83 in. and d = 4.75 in. (2) Slab weight outside critical section. Assumed concrete unit weight equal to 15 lb/ft 3 (3) HSS 12 x 6 x 3/16 & HSS 12 x 16 x 1/4, 192 in. long perpendicular to loading direction and 16 in. long parallel to loading direction 132
147 Table 5-3 Displacement History for Specimens SB1, SB2 and SB3 Cycle Target Drift (%) Corrected Drift (1) (%) (1) Corrected drift was 8% lower than target drift. Corrected drift values shown were rounded to closest.5%. Table 5-4 Concrete Slump Measurements for Specimens SB1, SB2 and SB3 Slab Column Block Specimen (in.) (in.) (in.) SB1 SB2 FRC RC Top Bottom Top Bottom 6.25 (1) 6 (2) (1) Bottom Half 6 Top Half N.A (2) SB3 N. A (1) Measured before addition of fibers (2) Measured after addition of fibers 133
148 Table 5-5 Concrete Cylinder Strength (ksi) Specimen Slab Column Blocks Material Strength Average Top Bottom Top Base 4.61(28) 5.81(28) SB1 Regular Concrete Concrete with 1.5% Hooked 5.69(28) (28) 4.37(28) 6.1(28) (28) (28) (28) 7.87 Bottom Half 6.38(28) Top Half 6.5(28) (28) (28) 5.96 Steel Fibers (28) 6.76(28) Regular 7.7(28) 6.66(28) Concrete SB2 Concrete with 1.36% High Strength Steel Fibers (28) 4.31(28) 4.49(28) (28) (28) (28) (28) (28) SB3 Regular Concrete (28) (28) (28) refers to 28 day concrete strength 134
149 Table 5-6 Beam Test Result Specimens First Peak Load Deflection (kips) (in.) Second Peak Load Deflection (kips) (in.) P15,.75 (kips) P15, 3. (kips) SB SB Note: (1) All tests conducted on 6 x 6 x 2 (in.) beams (2) P15,.75: Load at.3 in. (.75mm) deflection (3) P15, 3.: Load at 1.2 in. (3 mm) deflection Table 5-7 Steel Strength Reinforcement No.3 No.4 No.5 No.6 Yield Stress (ksi) Average Yield Average Ultimate Ultimate Stress (ksi) Stress (ksi) Stress (ksi) SB1,2 SB3 SB1,2 SB3 SB1,2 SB3 SB1,2 SB Table 5-8 Summary of Test Result Specimen Punching Shear Initiation Punching Shear Failure Resultant Drift at Punching Shear Failure SB1 Point 4 to point 5 at 2.3% drift Point 1 to point 11 at 2.3% drift 3.25% SB2 Point 1 to point 11 at 1.9% drift Point 1 to point 2 at 2.3% drift 3.25% SB3 Point 6 to point 7 at 1.15% drift Point 6 to point 7 at 1.15% drift 1.65% 135
150 Table 5-9 Peak and Ultimate Lateral Load Comparison Location Data Specimen SB1 Specimen SB2 Specimen SB3 Point 1 Point 2 Point 3 Point 4 Point 5 Point 6 Point 7 Point 8 Point 9 Point 1 Point 11 Point 12 Peak Load (kips) Resultant Drift at Peak Load (%) Ultimate Load (kips) Resultant Drift at Ultimate Load (%) Peak Load (kips) Resultant Drift at Peak Load (%) Ultimate Load (kips) Resultant Drift at Ultimate Load (%) Peak Load (kips) Resultant Drift at Peak Load (%) Ultimate Load (kips) Resultant Drift at Ultimate Load (%) Peak Load (kips) Resultant Drift at Peak Load (%) Ultimate Load (kips) Resultant Drift at Ultimate Load (%) Peak Load (kips) Resultant Drift at Peak Load (%) Ultimate Load (kips) Resultant Drift at Ultimate Load (%) Peak Load (kips) Resultant Drift at Peak Load (%) Ultimate Load (kips) Resultant Drift at Ultimate Load (%) Peak Load (kips) Resultant Drift at Peak Load (%) Ultimate Load (kips) Resultant Drift at Ultimate Load (%) Peak Load (kips) Resultant Drift at Peak Load (%) Ultimate Load (kips) Resultant Drift at Ultimate Load (%) Peak Load (kips) Resultant Drift at Peak Load (%) Ultimate Load (kips) Resultant Drift at Ultimate Load (%) Peak Load (kips) Resultant Drift at Peak Load (%) Ultimate Load (kips) Resultant Drift at Ultimate Load (%) Peak Load (kips) Resultant Drift at Peak Load (%) Ultimate Load (kips) Resultant Drift at Ultimate Load (%) Peak Load (kips) Resultant Drift at Peak Load (%) Ultimate Load (kips) Resultant Drift at Ultimate Load (%)
151 Table 5-1 Peak Rotation Comparison (rad) East 2d South 2d West 2d North 2d Point (Fig. 5-13) Specimen SB1 2.3% Drift Specimen SB2 1.85% Drift Specimen SB3 1.15% Drift N.A. 11 N.A. N.A N.A N.A. N.A N.A N.A N.A N.A. 11 N.A. N.A
152 138 Table 5-11 Shear Stress at Critical Section for Specimen SB1 under a 1/2 Gravity Shear Ratio Peak Lateral Load Gravity Unbalanced Moment Drift V 4. M Point (kips) Shear (kips-in) ubx c V 4. M uby c V 4. M 4 ubx c. Muby c (%) ' ' ' ' ' ' ' A x y kips Ratio M ubx M c fc Jcx fc Ac fc Jcy fc Ac fc Jcx fc Jcy fc uby
153
154
155
156
157
158 144 Table 5-12 Shear Stress at Critical Section for Specimen SB2 under a 1/2 Gravity Shear Ratio Peak Lateral Load Gravity Unbalanced Moment Drift V u 4. Mubx c V 4. M uby c u V 4 u 4. Mubx c. Muby c Point (kips) Shear (kips-in) (%) ' ' ' ' ' ' ' x y kips Ratio M ubx M Ac fc Jcx fc Ac fc Jcy fc Ac fc Jcx fc Jcy fc uby
159
160
161
162
163 149 Table 5-13 Shear Stress at Critical Section for Specimen SB3 under a 1/2 Gravity Shear Ratio Peak Lateral Load Gravity Unbalanced Moment Drift V u 4. Mubx c V 4. M uby c u V 4 u 4. Mubx c. Muby c Point (kips) Shear (kips-in) (%) ' ' ' ' ' ' ' A x y kips Ratio M ubx M c fc Jcx fc Ac fc Jcy fc Ac fc Jcx fc Jcy fc uby
164
165
166 Table 5-14 Summary of Results from Eccentric Shear Model (a) Peak Value Normalized Shear Stress in x-direction Normalized Shear Stress in y-direction xy Shear Stress Specimen Drift Drift Drift Value Point Value Point Value Point (%) (%) (%) SB SB SB (b) Ultimate Value Specimen Drift (%) Gravity Shear Ratio Point Normalized Shear Stress in x-direction Normalized Shear Stress in y-direction xy Shear Stress SB SB SB
 One-Way Shear Failure (b) Two-Way")
167 (nisee.berkeley.edu/elibrary/image/goddenf79) Fig. 1-1 Slab-Column Framed System Column Slab Failure Surface (a) One-Way Shear Failure (b) Two-Way Shear Failure Fig. 1-2 Shear Failure of Slabs 153
168 154 Fig. 1-3 Perimeter of Critical Section
169 (a) Shear Capital (b) Drop Panel Plan View Side View (adapted from Nilson et al., 24) (c) Bent-Up Bars (adapted from Nilson et al., 24) (d) Closed Stirrups Fig. 1-4 Common Alternatives for Increasing Shear Resistance in Slab-Column Connections 155
 (e) Shearheads (http://www.vsl.")
 (f) Headed Shear Studs Fig.")
170 (adapted from Nilson et al., 24) (e) Shearheads ( (f) Headed Shear Studs Fig. 1-4 Common Alternatives for Increasing Shear Resistance in Slab-Column Connections 156


171 (Courtesy of Eduardo Miranda) Fig. 1-5 Arrangement of Shear Studs θ ε stud w h crack stud Fig. 1-6 Mechanism of Headed Shear Studs 157
172 Fig. 2-1 Critical Section for Diagonal Tensile Stress of 192 ACI Standard Specification Fig. 2-2 Slab Effective Width for Unbalanced Moment Transferred by Flexure 5 5 Design Story Drift Ratio (%) Vg / f Vc Fig. 2-3 Drift versus Gravity Shear Ratios Interaction Diagram in ACI Building Code (28) 158
173 A A A A Section A-A (a) Section A-A (b) Fig. 2-4 Experimental Setup for Tests of Slabs under Monotonically Increased Concentrated Load 159
174 Distributed Line Load Point Load A A A A Section A-A (a) Section A-A (b) Fig. 2-5 Experimental Setup for Tests of Slabs under Monotonically Increased Distributed or Multi-Point Load 16
175 (a) (b) (c) (d) (a) Gravity Load Applied through Column Jacking (b) Gravity Load Applied through Uniform Distributed Weights on Slab (c) Unbalanced Moment Induced by Column Lateral Load (d) Unbalanced Moment Induced by Opposite Forces at Slab Edges 161 Fig. 2-6 Experimental Setup for Tests of Slab-Column Connections under Combined Gravity Load and Unbalanced Moment
176 A A Points of Application of Gravity Load Points of Application of Forces to Induce Unbalanced Moment Load for Unbalanced Moment Gravity Load Gravity Load Load for Unbalanced Moment Section A-A Fig. 2-7 Experimental Setup used by Hawkins et al. (1974) 162
177 Fig. 2-8 Sequence of Application of Gravity Load in Tests by Dovich and Wight (1994) 163
178 Drift Ratio (%) Vg/Vc Fig. 2-9 Drift versus Gravity Shear Ratio Model by Hueste and Wight (1999) 164
179 Drift Ratio at Peak Load (%) Hawkins et al. (1974) Islam and Park (1976) Symonds et al. (1976) Ghali et al. (1976) Morrison and Sozen (1981) Zee and Moehle (1984) Pan and Moehle (1989) Robertson and Durrani (199) Wey and Durrani (1992) Durrani and Du (1992) Farhey et al. (1993) Robertson et al. (22) Robertson and Johnson (26) Target Gravity Shear Ratio Fig. 2-1 Test Results of Interior Slab-Column Connections without Shear Reinforcement (Using Target Gravity Shear Ratio) 165
180 Drift Ratio at Peak Load (%) Hawkins et al. (1974) Islam and Park (1976) Symonds et al. (1976) Zee and Moehle (1984) Pan and Moehle (1989) Robertson and Durrani (199) Wey and Durrani (1992) Durrani and Du (1992) Robertson et al. (22) Robertson and Johnson (26) Gravity Shear Ratio at Peak Load Fig Test Results of Interior Slab-Column Connections without Shear Reinforcements (Using Gravity Shear Ratio at Peak Load) 166
181 Fig Bent-Up Bars as Shear Reinforcement (Specimen 4S Tested by Islam and Park, 1976) 167
182 in. 3/16 in. Shear Reinforcement No.3 Bars Longitudinal Flexural Reifnorcement Plan View Side View Dimensions in Inches Fig Hoop Reinforcement in Specimen 6CS Tested by Islam and Park,
183 .5 Steel Tube Rubber Pad A Potentiometer Plan View A W24X117 Beam Actuator Load Cell Potentiometer Section A-A Dimensions in Inches Fig. 3-1 Test Setup and Location of Potentiometers 169
184 A A 15 #4 4 in. 9 #4 6 in. N1 N2 N3 N1 N2 N3 6 in. N4 N5 N6 W3 W6 W2 W5 W1 W4 d/2 = 2.5 in. Col. 1.5d = 7.5 in. N4 W3 W6 W2 W5 W1 W4 d/2 = 2.5 in. N5 Col. N61.5d = 7.5 in. A 1 in. Spacing (All Sides) 6 in. PLAN VIEW 6x6x6 in. Column Stub A 1 in. Spacing (All Sides) 6 in. PLAN VIEW 6x6x6 in. Column Stub 6 in. d = 5 in. d = 5 in. Section A-A.5 in. Section A-A.5 in. (Left) Specimens S1, S3, S5, S7 and S9; (Right) Specimens S2, S4, S6, S8 and S1 17 Fig. 3-2 Reinforcement Layout and Strain Gauge Arrangement
185 (Left) Plan view for specimens with FRC in central region; (Right) Photo of Specimen S9 before concrete casting Fig. 3-3 Fiber Reinforced Concrete in 3 x 3 in. Central Region for Specimens S5, S6 S9, and S1 171

")


186 (a) 5 Cubic Feet Mixer (b) 1.5 Cubic Feet Mixer Fig. 3-4 Laboratory Concrete Mixers 172


187 (a) Specimen S1 (b) Specimen S2 Fig. 3-5 Crack Pattern on Slab Tension Side 173


188 (c) Specimen S3 (d) Specimen S4 Fig. 3-5 Crack Pattern on Slab Tension Side 174


189 (e) Specimen S5 (f) Specimen S6 Fig. 3-5 Crack Pattern on Slab Tension Side 175


190 (g) Specimen S7 (h) Specimen S8 Fig. 3-5 Crack Pattern on Slab Tension Side 176


191 (i) Specimen S9 (j) Specimen S1 Fig. 3-5 Crack Pattern on Slab Tension Side 177
192 Fig. 3-6 Measurement of Deflection Associated with Deformations in the Test Setup 178
193 12 S S9 1 Load (kips) 8 6 S S1 4 2 S Deflection (in.) (a) S1 1 Load (kips) 8 6 S4 S8 S S Deflection (in.) (b) (a) Slabs with 4 in. rebar spacing; (b) Slabs with 6 in. rebar spacing Fig. 3-7 Load versus Deflection Response 179
194 8 8 7 S7 S Load bd fc' S S1 S Deflection (in.) (a) S4 S8 7 6 Load b d f c ' S S6 2 1 S Deflection (in.) (b) (a) Slabs with 4 in. rebar spacing; (b) Slabs with 6 in. rebar spacing Fig. 3-8 Normalized Shear Stress versus Deflection Response 18
195 6 in. m m 6 in. m a x a Fig. 3-9 Assumed Yield-Line Pattern for Test Specimens with Corners Free to Lift (Elstner and Hognestad, 1956) 181
196 Load Yield-Line Load S7 S5 S S1.4.2 S Deflection (in.) (a) S8 S1 1.4 Load Yield-Line Load S4 S S Deflection (in.) (b) (a) Slabs with 4 in. rebar spacing; (b) Slabs with 6 in. rebar spacing Fig. 3-1 Normalized Load versus Deflection Response 182
197 8 S7 8 S8 7 S3 S4 S9 7 Load b d f c ' 6 S5 S1 6 5 S1 S6 5 S Rotation (radians) Fig Normalized Shear Strength versus Average Rotation 183
198 Load (kips) 6 6 Load (kips) Specimen S1 2 Specimen S3 Specimen S5 2 Specimen S7 Specimen S N4 Strain Gauge Reading x Specimen S1 2 Specimen S3 Specimen S5 2 Specimen S7 Specimen S W4 Strain Gauge Reading x Load (kips) 6 6 Load (kips) Specimen S1 Specimen S3 2 Specimen S5 2 Specimen S7 Specimen S N5 Strain Gauge Reading x Specimen S1 Specimen S3 2 Specimen S5 2 Specimen S7 Specimen S W5 Strain Gauge Reading x Load (kips) 6 6 Load (kips) Specimen S1 Specimen S3 2 Specimen S5 2 Specimen S7 Specimen S N6 Strain Gauge Reading x Specimen S1 Specimen S3 2 Specimen S5 2 Specimen S7 Specimen S W6 Strain Gauge Reading x Fig Readings of Strain Gauges at d/2 Distance from Column Face (Specimens with 4 in. Rebar Spacing) 184
199 Load (kips) 6 6 Load (kips) Specimen S1 2 Specimen S3 2 Specimen S5 Specimen S N1 Strain Gauge Reading x Specimen S1 2 Specimen S3 Specimen S W1 Strain Gauge Reading x Load (kips) 6 6 Load (kips) Specimen S1 Specimen S3 2 Specimen S5 2 Specimen S7 Specimen S N2 Strain Gauge Reading x Specimen S1 2 Specimen S3 2 Specimen S5 Specimen S W2 Strain Gauge Reading x Load (kips) 6 6 Load (kips) Specimen S3 2 Specimen S7 Specimen S N3 Strain Gauge Reading x Specimen S1 2 Specimen S3 Specimen S W3 Strain Gauge Reading x 1-6 Fig Readings of Strain Gauges at 1.5d Distance from Column Face (Specimens with 4 in. Rebar Spacing) 185
200 Load (kips) 6 6 Load (kips) Specimen S2 Specimen S4 2 Specimen S6 2 Specimen S8 Specimen S N4 Strain Gauge Reading x Specimen S2 Specimen S4 2 Specimen S6 2 Specimen S8 Specimen S W4 Strain Gauge Reading x Load (kips) 6 6 Load (kips) Specimen S2 Specimen S4 2 Specimen S6 2 Specimen S8 Specimen S N5 Strain Gauge Reading x Specimen S4 2 Specimen S6 Specimen S W5 Strain Gauge Reading x Load (kips) 6 6 Load (kips) Specimen S2 Specimen S4 2 Specimen S6 2 Specimen S8 Specimen S N6 Strain Gauges Reading x Specimen S2 Specimen S4 2 Specimen S6 2 Specimen S8 Specimen S W6 Strain Gauges Reading x Fig Readings of Strain Gauges at d/2 Distance from Column Face (Specimens with 6 in. Rebar Spacing) 186
201 Load (kips) 6 6 Load (kips) Specimen S2 Specimen S4 2 Specimen S6 2 Specimen S8 Specimen S N1 Strain Gauge Reading x Specimen S2 Specimen S4 2 Specimen S6 2 Specimen S8 Specimen S W1 Strain Gauge Reading x Load (kips) 6 6 Load (kips) Specimen S2 Specimen S4 2 Specimen S6 2 Specimen S8 Specimen S N2 Strain Gauge Reading x Specimen S2 Specimen S4 2 Specimen S6 2 Specimen S8 Specimen S W2 Strain Gauge Reading x Load (kips) Specimen S2 Specimen S4 2 Specimen S6 2 Specimen S8 Specimen S N3 Strain Gauge Reading x Load (kips) Specimen S2 2 Specimen S4 2 Specimen S6 Specimen S8 1 Specimen S W3 Strain Gauges Reading x Fig Readings of Strain Gauges at 1.5d Distance from Column Face (Specimens with 6 in. Rebar Spacing) 187
202 Load bd f o ' c Fig Definition of Energy Absorption 188
203 Fig. 4-1 Specimens SU1 and SU2 189
204 Connector for Actuator 7 in. RC Column 35 in. Strand for simulating gravity load 12 in. FRC Slab Steel Channel C 1 X 2 21 in. 4 in. 4 in. 72 in. 5 in. 8 in. Load Cell Pin 7 in. 8 ft (a) Specimen Setup (b) Detail of Bottom Column Connection Fig. 4-2 Test Setup for Specimens SU1 and SU2 19
205 9'-" Holes for Vertical Support and Steel Double Channel Connection 8" 8" 12" 12" 12" 12" 6" 12" 6" Column Strip 48" Effective Width 24" 12" 12" 5" 5" 6" 4" Top Reinforcement Layout All Bars = No. 3 Bars (3/8 in. Diameter) Bottom Reinforcement Layout All Bars = No. 3 Bars (3/8 in. Diameter) Fig. 4-3 Slab Reinforcement Layout for Specimens SU1 and SU2 191
206 2.25" 4" d=3 1/4" Ø 2.25" 2.875" 1" Loading Direction Fig. 4-4 Anchorage of Slab Flexural Reinforcement in Specimens SU1 and SU2 (Dimensions in inches) Fig. 4-5 Column Reinforcement for Specimens SU1 and SU2 192
207 TV1 TV2 TV3 TV4 TV5 TV6 TV7 TV8 TV13 TV19 6.5" TV9 TV14 TV2 TV15 6.5" TV1 TV16 TV21 TV22 TV " TH1 TH2 TH3 TH4 TV11 TV12 TV17 TV in. 6.5" 3.25" 12" 3.25" 1.675" Fig. 4-6 Strain Gauge Labels and Locations for Specimens SU1 and SU2 (Top Reinforcement) 193
208 BV1 BV16 6.5" BV1 BV4 BV7 BV11 BV17 BV12 6.5" BV2 BV5 BV8 BV13 BV " BV2 BV3 BH1 BH2 BH3 BH4 3.25" 3.25" BV6 BV9 BV14 BV19 12" 1.675" BV15 Fig. 4-7 Strain Gauge Labels and Locations for Specimens SU1 and SU2 (Bottom Reinforcement) 194
209 Loading Direction West East * * * 6.5 *Specimen SU2 (Dimensions in inches) Fig. 4-8 Potentiometer Arrangement for Specimens SU1 and SU2 195
210 (a) Anchorage of Strands in Steel Base RC Column 12 FRC 16 1/2 in. strand for simulating gravity load 96 (b) Top of Slab (Dimensions in inches) Fig. 4-9 Locations of Strands for Simulations of Gravity Load in Specimens SU1 and SU2 196
211 Drift (%) Cycle Number (a) 1/2 Gravity Shear Ratio Drift (%) Cycle Number (b) 5/8 Gravity Shear Ratio Fig. 4-1 Lateral Displacement History for Specimen SU
212 Drift (%) Cycle Number (a) 1/2 Gravity Shear Ratio Drift (%) Cycle Number (b) 5/8 Gravity Shear Ratio -6 Fig Lateral Displacement History for Specimen SU2 198
 8 Beam 1 Beam 2 8 4")
 (a) Specimen SU1.3.6.9.12 Deflection (in.")

213 Beam 2 Load (kips) 8 Beam 3 Beam 1 8 Load (kips) 8 Beam 1 Beam Deflection (in.) (a) Specimen SU Deflection (in.) (b) Specimen SU2 Fig Load versus Deflection Response for Beam Specimens Fig Specimen SU2 at 1.5% Drift 199


214 Fig Diagonal Cracks on Top of Slab Fig Connection Damage in Specimen SU1 at 5% Drift (5/8 Gravity Shear Ratio) 2


215 Fig Connection Damage in Specimen SU2 after Test (5/8 Gravity Shear Ratio) Fig Specimen SU1 after Saw-Cutting of Slab 21
216 Lateral Load (kips) Drift (%) -8 Fig Lateral Force versus Drift Response for Specimen SU1 (1/2 Gravity Shear Ratio) 22
217 Reading From Bottom Load Cell (kips) Target Connection Shear Drift (%) -35 Fig Connection Shear versus Drift History for Specimen SU1 (1/2 Gravity Shear Ratio) 23
218 Lateral Load (kips) Drift (%) -8 Fig. 4-2 Lateral Force versus Drift Response for Specimen SU1 (5/8 Gravity Shear Ratio) 24
219 Reading From Bottom Load Cell (kips) Target Connection Shear Drift (%) Fig Connection Shear versus Drift History for Specimen SU1 (5/8 Gravity Shear Ratio) 25
220 Fig Steel Plate Effect on Specimen SU2 Lateral Load (kips) Drift (%) Fig Lateral Force versus Drift Response for Specimen SU2 with Plate Effect (1/2 Gravity Shear Ratio)
221 Lateral Load (kips) Drift (%) -8 Fig Adjusted Lateral Force versus Drift Response for Specimen SU2 (1/2 Gravity Shear Ratio) 27
222 -5-5 Reading from Bottom Load Cell (kips) Drift (%) -4 Fig Connection Shear versus Drift History for Specimen SU2 (1/2 Gravity Shear Ratio) 28
223 Lateral Load (kips) Drift (%) -8 Fig Adjusted Lateral Force versus Drift Response for Specimen SU2 (5/8 Gravity Shear Ratio) 29
224 -5-5 Reading from Bottom Load Cell (kips) End of 5% Drift Cycle Drift (%) -45 Fig Connection Shear versus Drift History for Specimen SU2 (5/8 Gravity Shear Ratio) 21
225 8 6 4 SU1 (1/2 Gravity Shear) SU1 (5/8 Gravity Shear) SU2 (1/2 Gravity Shear) SU2 (5/8 Gravity Shear) Lateral Load (kips) Drift (%) -8 Fig Peak Load versus Drift Envelope Response Comparison for Specimens SU1 and SU2 211
226 Lateral Load (kips) East Rotation at 1d (rad) Lateral Load (kips) West Rotation at 1d (rad) Fig Lateral Load versus Connection Rotation Response of Specimen SU1 at Distance 1d from Column Face (Gravity Shear Ratio of 1/2) 212
227 Lateral Load (kips) East Rotation at 2d (rad) Lateral Load (kips) West Rotation at 2d (rad) Fig. 4-3 Lateral Load versus Connection Rotation Response of Specimen SU1 at Distance 2d from Column Face (Gravity Shear Ratio of 1/2) 213
228 Lateral Load (kips) East Rotation at 1d (rad) Lateral Load (kips) West Rotaiton at 1d (rad) Fig Lateral Load versus Connection Rotation Response of Specimen SU2 at Distance 1d from Column Face (Gravity Shear Ratio of 1/2) 214
229 Lateral Load (kips) East Rotation at 2d (rad) Lateral Load (kips) West Rotation at 2d (rad) Fig Lateral Load versus Connection Rotation Response of Specimen SU2 at Distance 2d from Column Face (Gravity Shear Ratio of 1/2) 215
230 Unbalanced Moment (kips-in) Rotation at 1d (1/2 Gravity Shear Ratio) Rotation at 2d (1/2 Gravity Shear Ratio) Rotation at 1d (5/8 Gravity Shear Ratio) Rotation at 2d (5/8 Gravity Shear Ratio) East Rotation (rad) Fig Unbalanced Moment versus East Rotation Response Envelope for Specimen SU1
231 Unbalanced Moment (kips-in) Rotation at 1d (1/2 Gravity Shear Ratio) Rotation at 2d (1/2 Gravity Shear Ratio) Rotation at 1d (5/8 Gravity Shear Ratio) Rotation at 2d (5/8 Gravity Shear Ratio) West Rotation (rad) 217 Fig Unbalanced Moment versus West Rotation Response Envelope for Specimen SU1
232 Unbalanced Moment (kips-in) Rotation at 1d (1/2 Gravity Shear Ratio) Rotation at 2d (1/2 Gravity Shear Ratio) Rotation at 1d (5/8 Gravity Shear Ratio) Rotation at 2d (5/8 Gravity Shear Ratio) East Rotations (rad) 218 Fig Unbalanced Moment versus East Rotation Response Envelope for Specimen SU2
233 Unbalanced Moment (kips-in) Rotation at 1d (1/2 Gravity Shear Ratio) Rotation at 2d (1/2 Gravity Shear Ratio) Rotation at 1d (5/8 Gravity Shear Ratio) Rotation at 2d (5/8 Gravity Shear Ratio) West Rotations (rad) Fig Unbalanced Moment versus West Rotation Response Envelope for Specimen SU2
234 M ub γ f M ub (Adapted from MacGregor and Wight, 25 ) Fig Eccentric Shear Model for Interior Slab-Column Connection 22
235 Normalized Shear Stress S9 Shear Stress 4 f ' c S1 Shear Stress ' 4 f 5. 2ρ SU1 4% with 5/8 Gravity Shear Ratio 5% with 5/8 Gravity Shear Ratio Rotation (rad) c ( + ) tenision Fig Shear Stress versus Rotation Capacity Relationship for Connections with High-Strength Hooked Steel Fibers (Dramix RC-8/3-BP) 2 2 Normalized Shear Stress S7 S8 Shear Stress 4 ' c f ' c Shear Stress ( + ) 4 f 5. 2ρ SU2 tenision % with 1/2 Gravity Shear Ratio 5% with 5/8 Gravity Shear Ratio Rotation (rad) Fig Shear Stress versus Rotation Capacity Relationship for Connections with Regular Strength Hooked Steel Fibers (Dramix ZP35) 221
236 TV2 TV6 TV1 TV13 TV14 TV15 TV16 Theoretical Yield Strain 4.% 3.% 2.% 1.% Distance from Column Face (in.) Loading Direction.2 Strain.1. Strain Theoretical Yield Strain 3.% 4.% 2.5% 2.% 1.75% 1.5% 1.25% 1.%.75%.5%.25% Location (in.) Lateral Load (kips) Lateral Load (kips) TV1 Strain TV 16 Strain Fig. 4-4 Top Reinforcement Strain Distribution at Distance.5d from Column Face in Specimen SU1 (West Side, 1/2 Gravity Shear Ratio) 222
237 .15 4.%.12 3.% % 2.% Theoretical Yield Strain % 1.5% 1.25% 1.%.75%.5%.25% Location (in.) TV3 TV8 TV12 TV17 TV Strain Lateral Load (kips) Lateral Load (kips) TV12 Strain TV17 Strain Fig Top Reinforcement Strain Distribution at Distance.5d from Column Face in Specimen SU1 (East Side, 1/2 Gravity Shear Ratio) 223
238 Lateral Load (kips) -4-4 TV14 TV Strain Lateral Load (kips) -4-4 TV5 TV Strain Fig Top Reinforcement Strains at Distance 2.5d from Column Face in Specimen SU1 (1/2 Gravity Shear Ratio) 224
239 .5 TV2 TV6 TV1 TV16 Loading Direction.4 5.% 4.% Strain.3 Theoretical Yield Strain 3.%.2 2.5% 2.%.1 1.5% 1.% Location (in.) Lateral Load (kips) Lateral Load (kips) TV 1 Strain TV 16 Strain Fig Top Reinforcement Strain Distribution at Distance.5d from Column Face in Specimen SU1 (West Side, 5/8 Gravity Shear Ratio) 225
240 Strain Location (in.) Loading Direction Lateral Load (kips) Lateral Load (kips) TV12 Strain TV17 Strain Fig Top Reinforcement Strain Distribution at Distance.5d from Column Face in Specimen SU1 (East Side, 5/8 Gravity Shear Ratio) 226
241 Lateral Load (kips) -4-4 BV13 BV Strain Lateral Load (kips) -4-4 BV5 BV Strain Fig Bottom Reinforcement Strains at Distance.5d from Column Face in Specimen SU1 (West Side, 1/2 Gravity Shear Ratio) 227
242 Lateral Load (kips) -4-4 BV14 BV Strain Lateral Load (kips) -4-4 BV6 BV Strain Fig Bottom Reinforcement Strains at Distance.5d from Column Face in Specimen SU1 (East Side, 1/2 Gravity Shear Ratio) 228
243 Lateral Load (kips) -4 BV13-4 BV8 BV5 BV Strain 8 4 BV14 BV9 BV6 BV3 8 4 Lateral Load (kips) Strain Fig Bottom Reinforcement Strains at Distance.5d from Column Face in Specimen SU1 (5/8 Gravity Shear Ratio) 229
244 Strain TV13 TV14 TV15 TV2 TV6 TV1 TV % % 2.5% 2.% 1.75% 1.5%.5. 8 Theoretical Yield Strain Location (in.) % 1.%.75%.5%.25% Lateral Load (kips) Lateral Load (kips) TV1 Strain TV16 Strain Fig Top Reinforcement Strain Distribution at Distance.5d from Column Face in Specimen SU2 (West Side, 1/2 Gravity Shear Ratio) 23
245 % Strain.1 2.5% 2.% 1.75% 1.5%.5 Theoretical Yield Strain Location (in.) TV3 TV8 TV12 TV % 1.%.75%.5%.25% Loading Direction TV Lateral Load (kips) Lateral Load (kips) TV12 Strain TV17 Strain Fig Top Reinforcement Strain Distribution at Distance.5d from Column Face in Specimen SU2 (East Side, 1/2 Gravity Shear Ratio) 231
246 Lateral Load (kips) -4-4 TV14 TV Strain Lateral Load (kips) -4-4 TV5 TV Strain Fig. 4-5 Top Reinforcement Strains at Distance 2.5d from Column Face in Specimen SU2 (1/2 Gravity Shear Ratio) 232
247 Lateral Load (kips) -4-4 BV13 BV Strain Lateral Load (kips) -4-4 BV5 BV Strain Fig Bottom Reinforcement Strains at Distance.5d from Column Face in Specimen SU2 (West Side, 1/2 Gravity Shear Ratio) 233
248 Lateral Load (kips) -4-4 BV14 BV Strain Lateral Load (kips) -4-4 BV6 BV Strain Fig Bottom Reinforcement Strains at Distance.5d from Column Face in Specimen SU2 (East Side, 1/2 Gravity Shear Ratio) 234
249 Latreal Load (kips) Lateral Load (kips) Potentiometers -6 Strain Gauge TV Strain -6 Potentiometers -6 Strain Gauge BV Strain 8 6 Potentiometers Strain Gauge TV Potentiometers Strain Gauge BV Latreal Load (kips) Lateral Load (kips) Strain Strain Fig Strain Comparison for Specimen SU1 (1/2 Gravity Shear Ratio) 235
250 8 6 Potentiometers Strain Gauge TV Potentiometers Strain Gauge BV Lateral Load (kips) Lateral Load (kips) Strain Strain Lateral Load (kips) Lateral Load (kips) Potentiometers -6 Strain Gauge TV Strain -6 Potentiometers -6 Strain Gauge BV Strain Fig Strain Comparison for Specimen SU2 (1/2 Gravity Shear Ratio) 236
251 Curvature (rad/in.) %.5%.75% 1.% 1.25% 1.5% 1.75% 2.% 2.5% 3.% 4.% Location (in.) Fig East Side Curvature for Specimen SU1 (West Loading; 1/2 Gravity Shear Ratio) 237
252 Curvature (rad/in.) % -.5% -.75% -1.% -1.25% -1.5% -1.75% -2.% -2.5% -3.% -4.% Location (in.) Fig West Side Curvature for Specimen SU1 (East Loading; 1/2 Gravity Shear Ratio) 238
253 Curvature (rad/in.) %.5%.75% 1.% 1.25% 1.5% 1.75% 2.% 2.5% 3.% 4.% Loacation (in.) Fig West Side Curvature for Specimen SU2 (East Loading; 1/2 Gravity Shear Ratio) 239
254 Curvature (rad/in.) % -.5% -.75% -1.% -1.25% -1.5% -1.75% -2.% -2.5% -3.% Loacation (in.) Fig East Side Curvature of Specimen SU2 (West Loading; 1/2 Gravity Shear Ratio) 24
255 2.35 Gravity Shear Ratio.25 Gravity Shear Ratio <.35 Gravity Shear Ratio <.25 Specimen SU1 at Peak Lateral Load Specimen SU1 at Peak Shear Stress Specimen SU2 at Peak Lateral Load and Shear Stress V + g M c v ub Ac J c 4 f c ' ρ 3 + tension r tension (%) Fig Combined Shear Stress versus Slab Tensile Reinforcement Ratio 241
256 2.35 Gravity Shear Ratio.25 Gravity Shear Ratio <.35 Gravity Shear Ratio <.25 Specimen SU1 at Peak Latreal Load Specimen SU1 at Peak Shear Stress Specimen SU2 at Peak Lateral Load and Shear Stress 2 V + g M c v ub Ac J c 2 r tension 4 fc'(.5+ 3 ) r tension (%) Fig. 4-6 Combined Shear Stress versus Slab Tensile Reinforcement Ratio (Accounting for Slab Reinforcement Ratio) 242
257 2.35 Gravity Shear Ratio.25 Gravity Shear Ratio <.35 Gravity Shear Ratio <.25 Specimen SU1 at Peak Lateral Load Specimen SU1 at Peak Shear Stress Specimen SU2 at Peak Lateral Load and Shear Stress V + g M c v ub Ac J c 4 f c ' Drift at Punching Shear Failure (%) Fig Combined Shear Stress versus Lateral Drift Ratio 243
258 2.35 Gravity Shear Ratio.25 Gravity Shear Ratio <.35 Gravity Shear Ratio <.25 Specimen SU1 at Peak Lateral Load Specimen SU1 at Peak Shear Stress Specimen SU2 at Peak Lateral Load and Shear Stress 2 V g γ v M ub c + ub Ac c J c c ' 2 r ρ tension 4 4 f f c c '(.5+ 3 ) Drift at Punching Shear Failure (%) Fig Combined Shear Stress versus Lateral Drift Ratio (Accounting for Slab Reinforcement Ratio) 244
259 1 Specimen SU1 at Peak Lateral Load Specimen SU1 at Peak Shear Stress Specimen SU2 at Peak Lateral Load and Shear Stress Drift at Punching Failure (%) Gravity Shear Ratio Fig Lateral Drift Ratio versus Gravity Shear Ratio 245
260 1 Specimen SU1 at Peak Lateral Load Specimen SU1 at Peak Shear Stress Specimen SU2 at Peak Lateral Load and Shear Stress Drift at Punching Failure (%) V ' 2ρtension 4 fc 5. + A 3 g c Fig Lateral Drift Ratio versus Gravity Shear Ratio (Accounting for Slab Reinforcement Ratio) 246
261 Fig. 5-1 Geometry of Specimens SB1, SB2 and SB3 247
262 North Strong Wall X Y 24 A A Y-Direction Actuator 24 Steel Cross Head Section A-A (Dimensions in inches) Fig. 5-2 Test Setup for Specimens SB1, SB2 and SB3 248
263 249 Fig. 5-3 Slab Reinforcement Layout for Specimens SB1 and SB2
264 25 Fig. 5-4 Slab Reinforcement Layout for Specimen SB3
265 Fig. 5-5 Shear Stud Reinforcement and Slab Critical Perimeter beyond Shear Reinforcement (Specimen SB3) Fig. 5-6 Stud Rail Geometry for Specimen SB3 251
266 A A d avg = (Dimensions in inches) 2.5 Fig. 5-7 Column Reinforcement for Specimens SB1, SB2 and SB3 252
267 B 9 B All No.4 Grade 6 Bars A 42 A Section A-A Section B-B Reinforcement for Top Block B 7 No. 6 in. C B Flexural Reinforcement No. 5 Grade 6 Bars Transverse Reinforcement No. 4 Grade 6 Bars A 6 C A Section A-A Section B-B Reinforcement Layout for Base Block (Dimensions in inches) Section C-C Fig. 5-8 Top and Base Block Reinforcement for Specimens SB1, SB2 and SB3 253
268 254 Fig. 5-9 Slab Strain Gauges for Specimens SB1, SB2 and SB3
269 Fig. 5-1 Column Strain Gauges for Specimens SB1, SB2 and SB3 255
270 Fig Slab and Column LVDTs for Specimens SB1, SB2 and SB3 256
271 4. 3. N-S or E-W Drift Maximum Drift Drift (%) Cycle Number Fig Drift versus Cycle Number for Specimens SB1, SB2 and SB3 Fig Clover-Leaf Bi-Axial Lateral Displacement Pattern for Each Loading Cycle 257
272 Fig Casting of Fiber Reinforced Concrete Fig Casting of Regular Concrete 258
 6 6 4 4 4 4 2 2 2 2.2.4.6.8.1.")


273 Load (kips) 6 6 Load (kips) Deflection (in.) (a) Specimen SB Deflection (in.) (b) Specimen SB2 Fig Load versus Deflection Response for Beam Specimens Crack Drawn for Clarity Fig Diagonal Cracks in Specimen SB1 259


 26")
274 Fig Initiation of Punching Shear Failure in Specimen SB1 Fig Perimeter of Punching Shear Failure in Specimens SB1 (After Test) 26


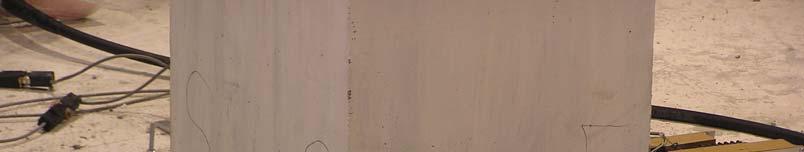

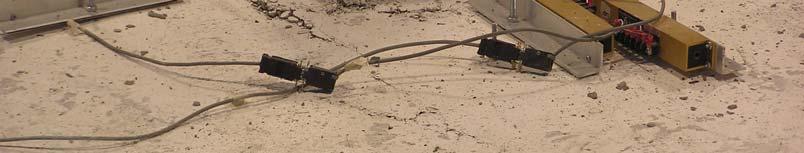

275 (a) South-West Corners (b) South-East Corners Fig. 5-2 Initiation of Punching Shear Failure in Specimen SB2 261


")


276 Fig Perimeter of Punching Shear Failure in Specimens SB2 (After Test) Fig Half-inch Vertical Settlement of Slab in Specimen SB2 after Punching Shear Failure 262


277 Fig Initiation of Punching Shear Failure in Specimen SB3 Fig Connection Damage after Test and Perimeter of Headed Shear Stud Reinforcement in Specimen SB3 263


278 Fig Punching Shear Failure of Specimens SB3 Fig Damage in Shear Stud Reinforcement of Specimen SB3 after Removal of Connection Concrete (Notice Tunnel of Concrete Left by Second Shear Stud) 264