Gazing at Grass: Estimating surface deformation over fast decorrelating pasture using InSAR
|
|
|
- Christal Campbell
- 5 years ago
- Views:
Transcription

1 Gazing at Grass: Estimating surface deformation over fast decorrelating pasture using InSAR Yu Morishita and Ramon Hanssen 1

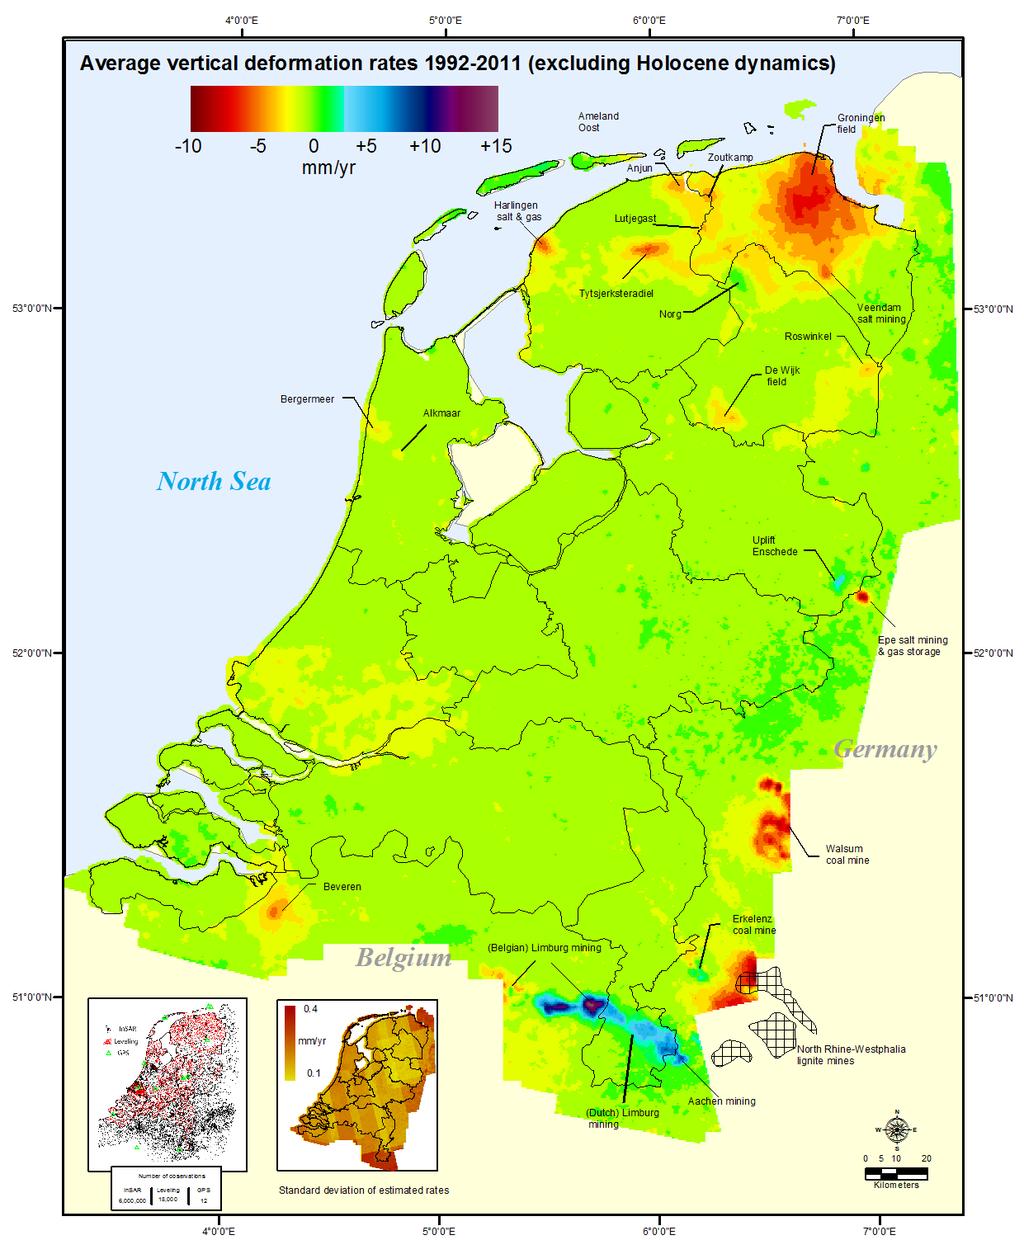
2 60% below the highwater levels of the sea, river, and lakes: Flood risk is the main natural hazard 2
3 3
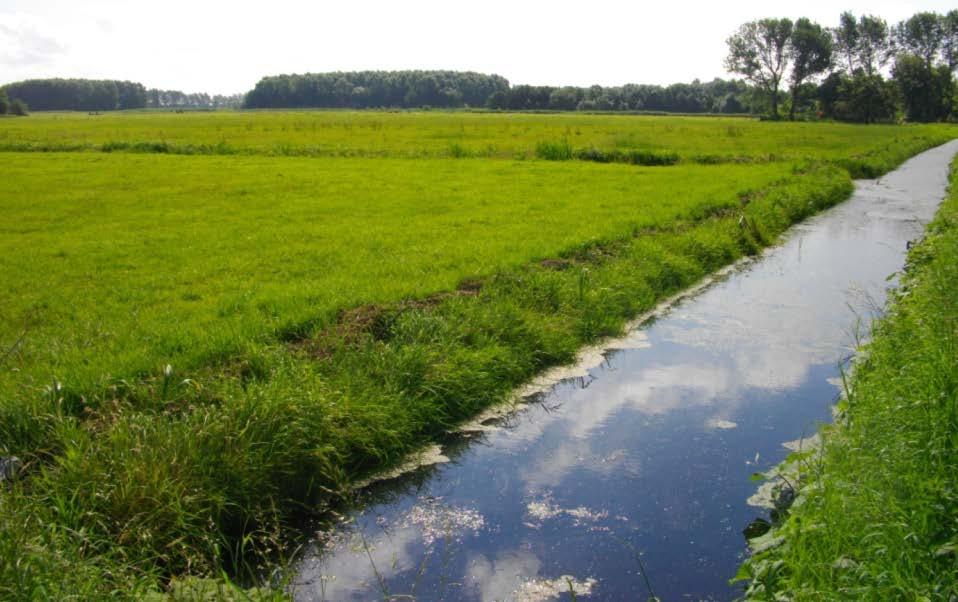
4 Pasture on drained peat soils 4
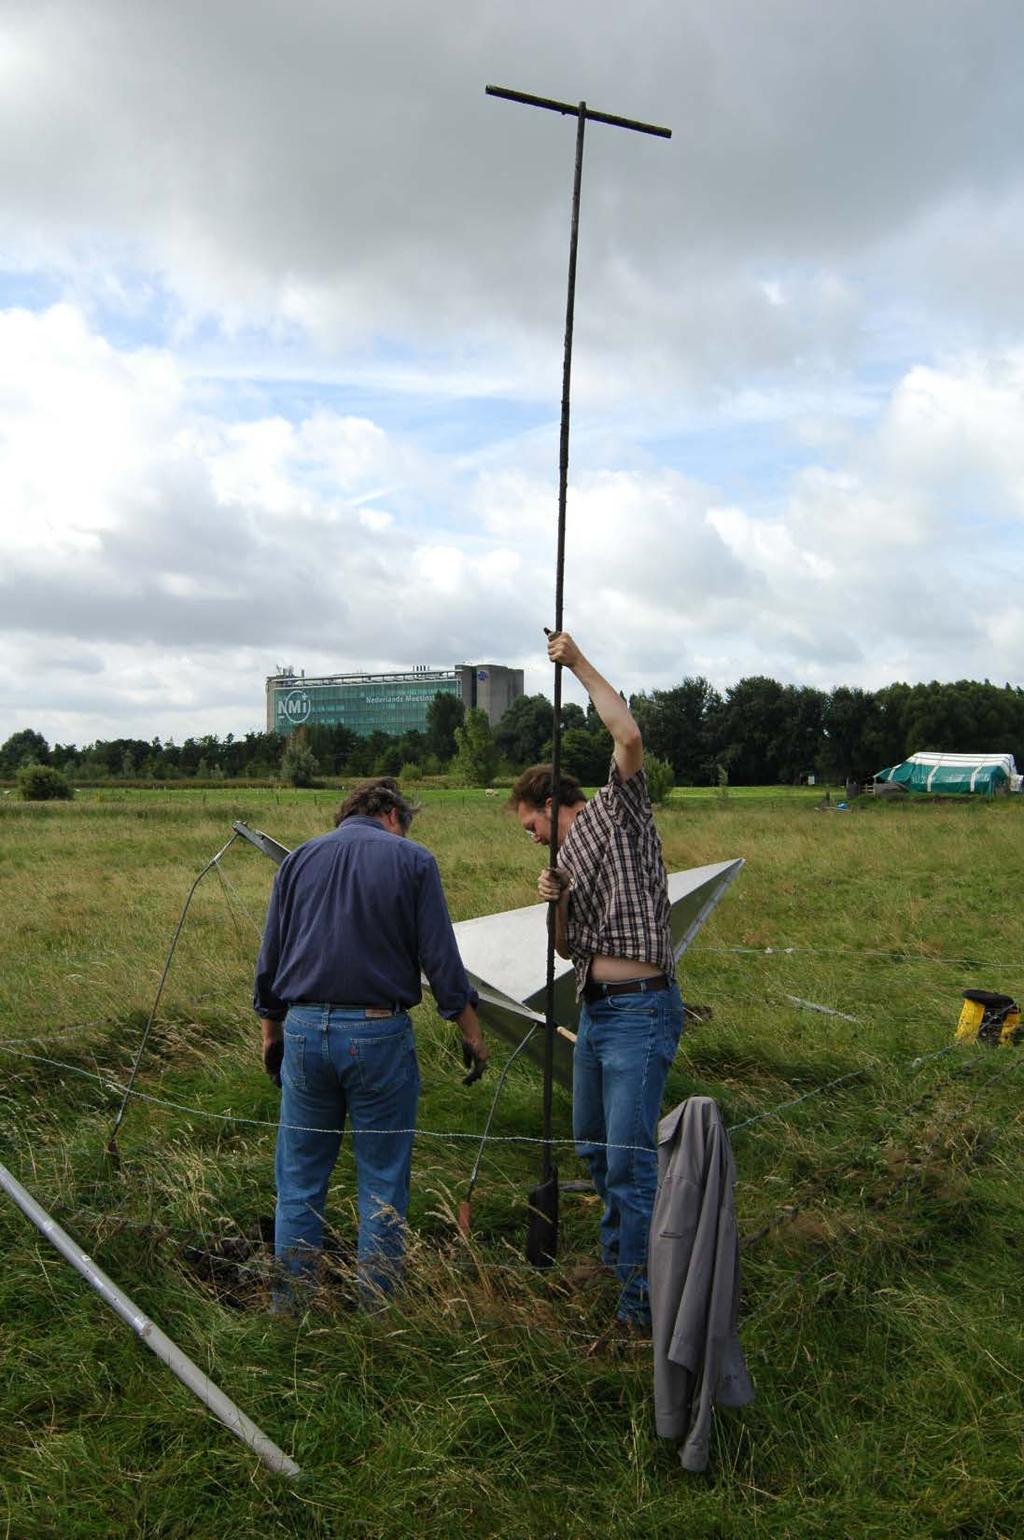
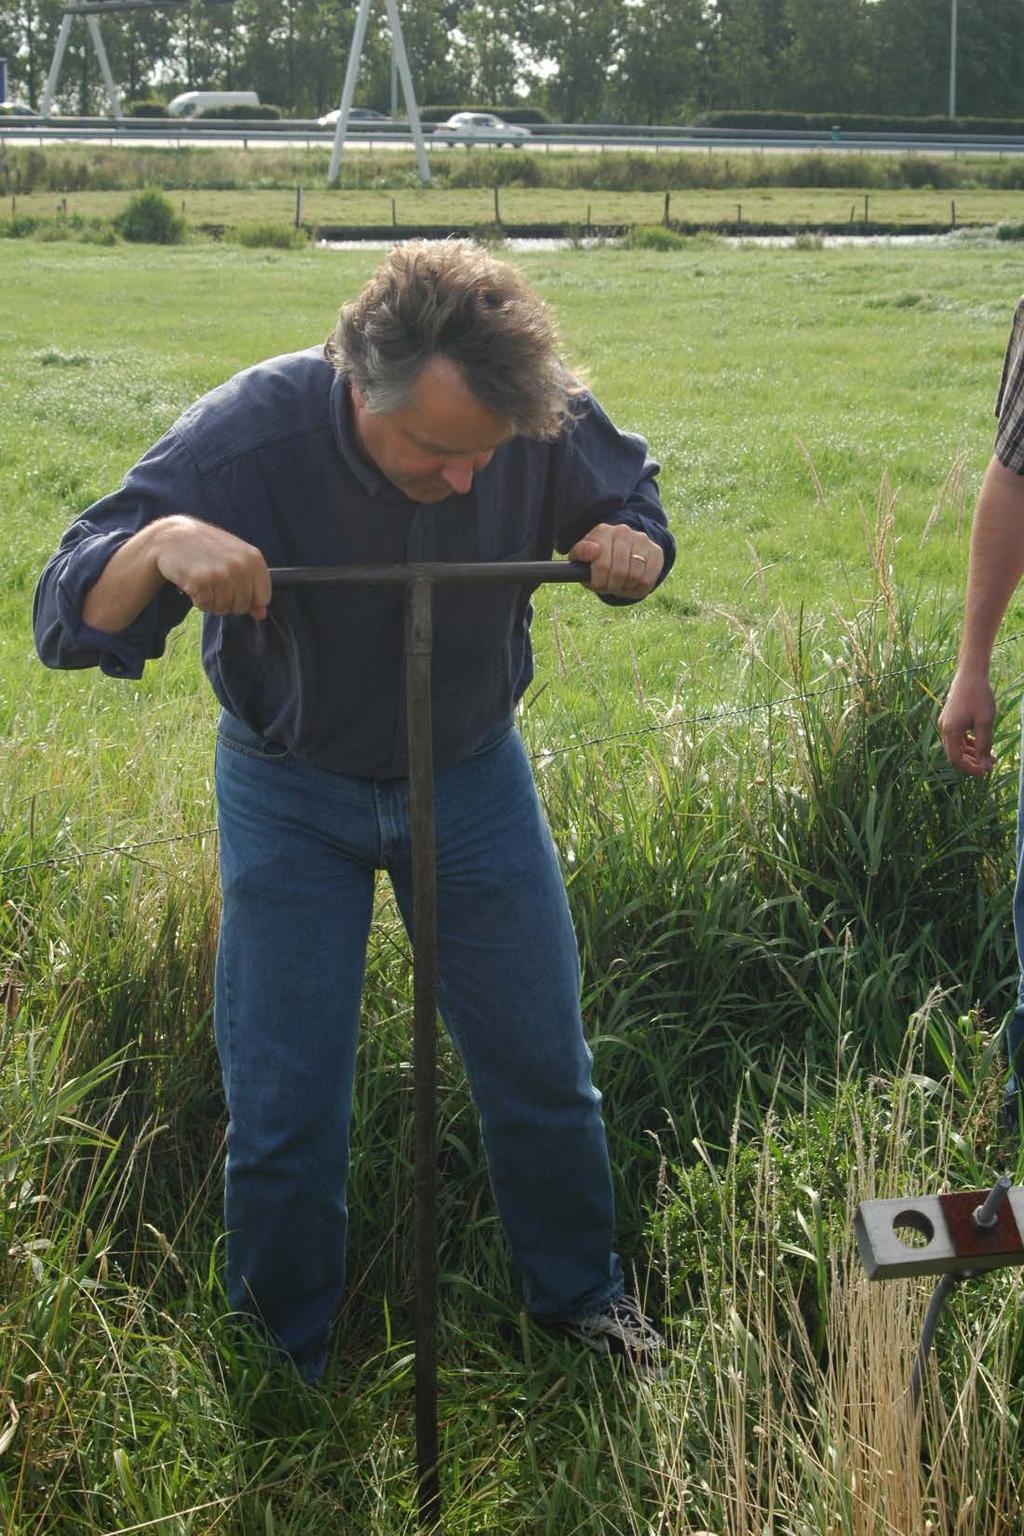
5 Penetrating the landscape 5

6 THIS IS PEAT 6

7 MORE PEAT! 7

8 Yuk! Clay Peat 8

9 Peat Clay 9

10 Different core drillings Surface Water table -40 cm Water table -80 cm Legend Sand Peat No subsidence No subsidence if water>-40 cm Subsidence Clay 10
")

11 Estimation of expected subsidence based on interpolated drillings Peat compaction (=subsidence) for a water table of -40 cm b.s. 250 m grid cell [MM/Y] No subsidence Reclaimed lakes: peat removed: No subsidence 11

 Increased flood risk")
12 Pasture on drained peat soils Typical Dutch landscape Drainage (to keep the land dry) results in subsidence Below sea level (1~7m) Increased flood risk 12
13 Drainage and subsidence Decomposition CO 2, CH 4, N 2 O sea peat ditch peat 13
14 Problems due to peat oxidation Holland is sinking even further (flood risk) Land use has to change (no more cattle swamp) Damage to cities Greenhouse gas emission Wet feet 14

15 Horizontal variability Land subsidence Legend < 0.10 m m m m m m m > 0.70 m Van den Akker,
16 16
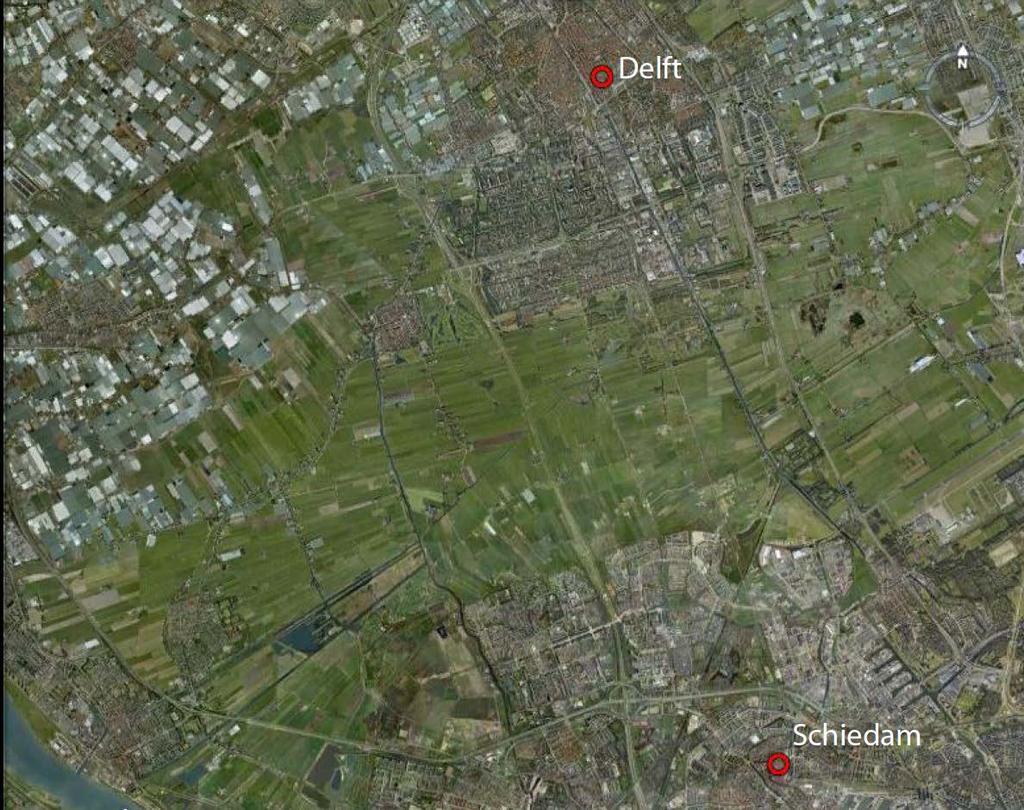
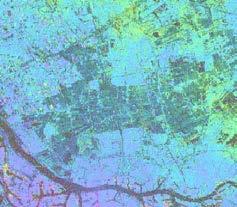
17 Target area Pasture on drained peat soils NDVI (Normalized Difference Vegetation Index) NDVI>0.7 : pasture area 17

18 Data sets 18
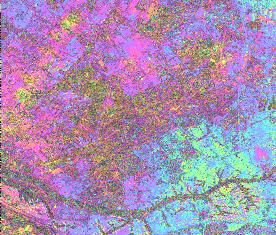
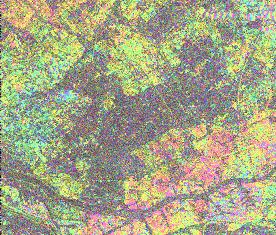
19 Temporal decorrelation in DInSAR ALOS 46days t=1 t=2 t=3 Envisat 35days pasture TSX 11days Urban: keeps coherence Pasture: loses coherence 19
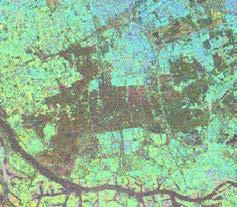
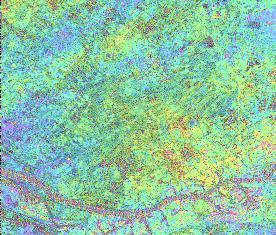
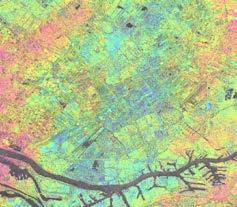
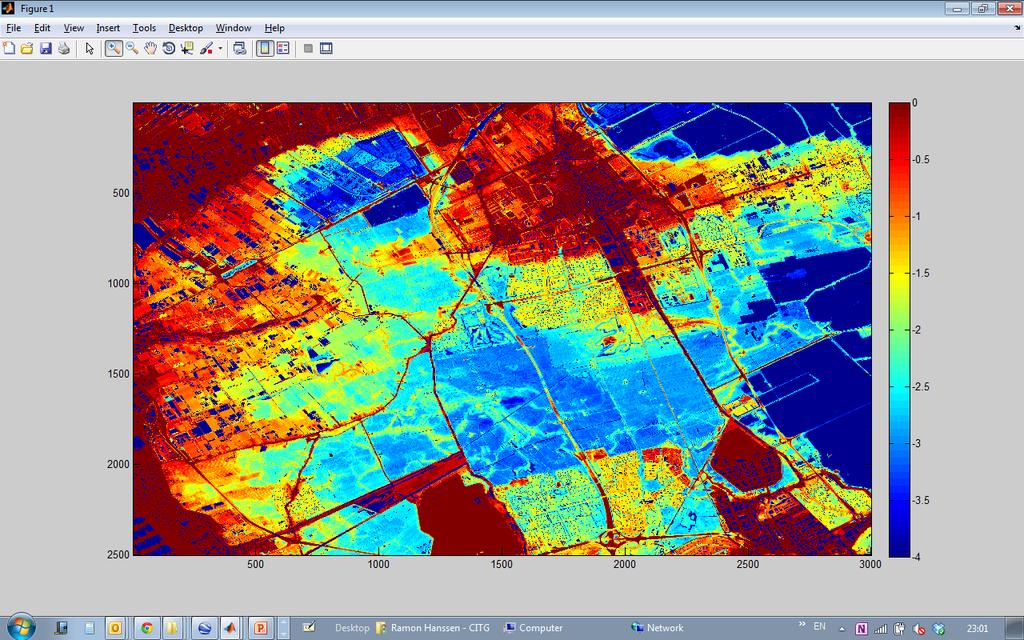
20 PSI results ALOS Asc pasture 5km Envisat Desc TSX Asc 20

21 SBAS results ALOS Asc pasture 5km Envisat Desc TSX Asc 21
22 SqueeSAR test PSI before inversion -2 [cm/y]
23 SqueeSAR test PSI after inversion -2 [cm/y]


24 SqueeSAR test PSI after inversion Coherence matrix -2 [cm/y]

25 Coherence average in pasture area L-band: All year Coherence decrease with time interval C-, X-band: Only winter 25

26 Temporal decorrelation model Coherence estimator is biased, never reaches zero. A. Parizzi, X. Cong, and M. Eineder, First results from multifrequency interferometry. A comparison of different decorrelation time constants at L, C and X band, in Proc. Fringe, Frascati, Italy,
 (B) (C) NDVI Morishita, Y.")


27 Estimated model parameters for ERS (A) (B) (C) NDVI Morishita, Y. and R. F. Hanssen (2015). "Temporal Decorrelation in L-, C-, and X-band Satellite Radar Interferometry for Pasture on Drained Peat Soils." Geoscience and Remote Sensing, IEEE Transactions on 53(2):
28 New approach, combine all possible SAR data 1. Use all available satellites and data 2. Average to 230 x 230 m grid 3. Estimate linear plus sinusoidal signal 29
29 Coherence estimation Coregistration to single master Spectral filter in order to mitigate spatial decorrelation Compute topographic phase Geocoding Adjacent coherence windows (230m x 230m) based on geographical coordinates of pixels to estimate coherence in the same area between all data sets Desc Coherence window Asc 30

30 Find statistically homogeneous pixels A. Ferretti, A. Fumagalli, F. Novali, C. Prati, F. Rocca, and A. Rucci, A new algorithm for processing interferometric data-stacks: SqueeSAR, IEEE Trans. Geosci. Remote Sens., vol. 49, no. 9, pp ,
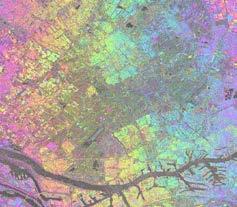
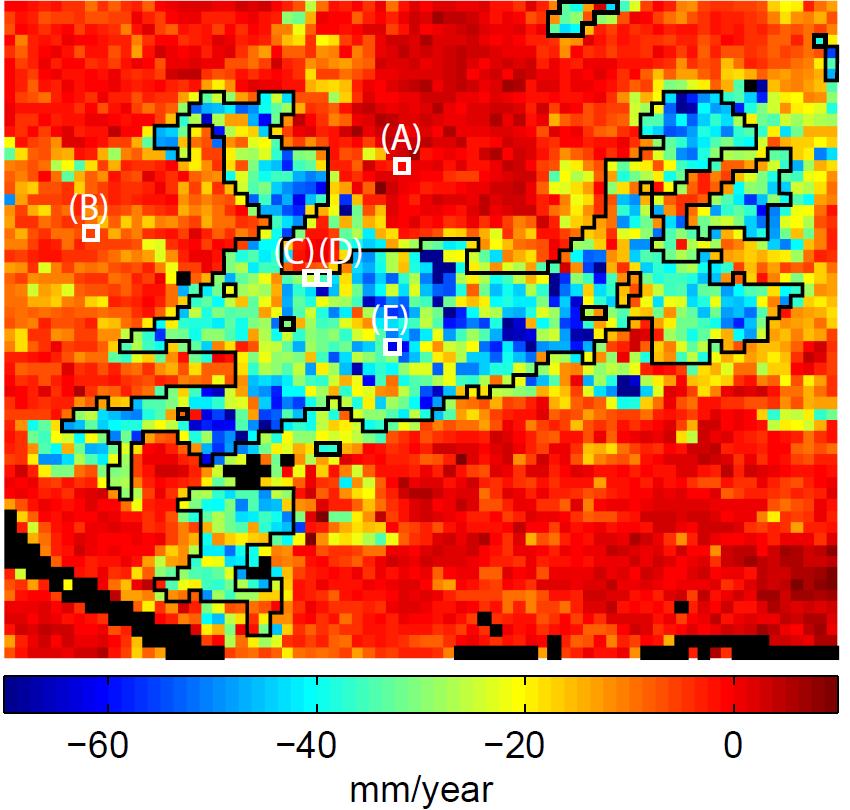
31 Estimated parameters Subsidence rate Amplitude of seasonal component Time offset of seasonal component DEM correction 32

32 Estimated parameters 33
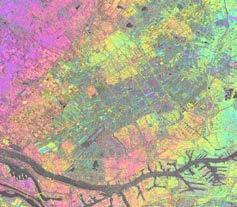
33 Interpretation 34
34 35
35 36

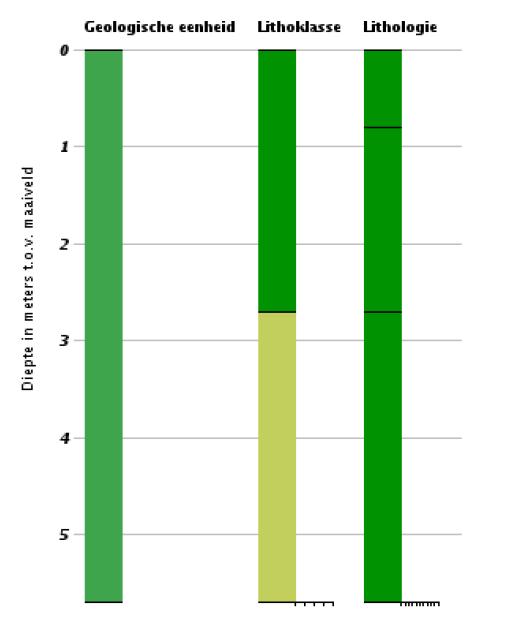
36 Lithology 37
37 Conclusions Over pastures, single sensor techniques did not work Good results were obtained by: 1. Combining all available sensors 2. Reducing spatial resolution 3. Estimating parameters in a least-squares sense 38