Project Delivery Symposium: Delivering the future
|
|
|
- Cordelia Douglas
- 5 years ago
- Views:
Transcription
1 2018 Project Delivery Symposium: Delivering the future Ari Pennanen Adjunct Professor, TTY Haahtela Group, Partner
2 Large variety of building costs The Literature on cost: At stage prior design, almost nothing is likely to be known about the building except its general size, and therefore it is pointless to go into detail about cost before any designing has been done. The accuracy is %. However, Estimates Prior Design (conceptual estimates) accuracy are proved to be within a standard deviation of +- 4%
3 Target Value Delivery in Haahtela Production Estimate accuracy might be in some degree a misleading conceptualization. Goal and steering to the goal. Information Modeling.
4 Nature of a construction project A construction project can be studied as value for the owner s/user s business (as valued) as designing a building object (as designed) and as processes in the building site (as built). Since business value, an object and construction processes are quite unequal viewpoints, steering should be considered from each perspectives and, in addition, steering should cover all the perspectives as whole.

5 Language transformations


 At the start of design")


6 Complexity Programming is a result of decisions of multiple stakeholders. Spatial needs competing for the same money than daily operations (salaries ) At the start of design building as an object is unknown (massing, locations of the activities, number of floors ) Wicked or inductive problem. For simple questions there are no right answers.
7 Complexity Complexity that cannot be avoided; essential complexity. Essential complexity raises from the problem itself. In programming there are multiple decision makers, wishes and wants. Eliminating complexity would lead loosing value. Complexity that should be avoided If we ask do we need to invest in an activity? simultaneously with a question where would it be located in a plan?, there are limitless possible alternatives. If we answer no to a first question, there is no alternatives left. Mixing programming and design causes unnecessary complexity. Need should be stated in a solution neutral environment.
8 Axiomatic Design (Nam Suh) Reducing complexity
9 C-K Theory (Hatchuel) Bearing Complexity
10 Programming. Wicked Problem. Commitment. Wicked problem does mot have a stopping rule. When is it ready? Commitment making is a crucial part of production Project management also require purpose (Simon 1996). Steering the complex systems can be understood as complexity management added with goal and purposeful behavior. Goal can normally be derived from customer s strategy (Pennanen 2004). The result of business is a satisfied customer, conceptualization of production must incorporate the customer. Goal(s) should be specific, realistic and measurable.
11 Programming. Wicked Problem. Commitment. Affective commitment making Support and stimulate strategic and operative managers to participate in decision making Decentralize the decision making to the levels where responsibilities are met Be transparent in terms of information handling. Decisions made by one affect to others possibility to make decisions Tread all information equitably, regardless of its origin
12 Target Costing Target cost Outline the product s concept and mission Generate specifications for the product s performance Define product target cost Design Design to the targets (mission, performance, cost) Project management also require purpose (Simon 1996). Steering the complex systems can be understood as complexity management added with goal and purposeful behavior. Goal can normally be derived from customer s strategy (Pennanen 2004). The result of business is a satisfied customer, conceptualization of production must incorporate the customer. Goal(s) should be specific, realistic and measurable.
13 Dialogue, business vs. construction Allowable cost a cost that the customer is willing to pay to get facility with defined performance Defined by customer (business plan, ROI, maximum funding) Expected cost a cost if the facility were provided at the current best practices Defined by the project team (Project/ construction managers, designers, facility planners )
14 In the literature there are two types of target cost (Tanaka 1989). They should be defined before start of design Project Level Target Cost - Handles customer demands Component Level Target Cost - Assigns target cost to the systems - Enables rapid estimation Rapid Estimates
15 Dialogue, Bim prior desig vs. Bim Present BIMs do not support strategic decision making (fast feedback) As CAD BIMs start from 0% content of quantities, BIM prior design starts from 100% content of quantities BIM prior design simulates design process.
16 Project Level Target Costing Measurable Quality can be expressed in project definition Modeling (TAKU in Haahtela) Target Cost (steering range) has to be defined within the probable area Otherwise the system collapses Steering area can be decided within probable area
17 Project Level Target Costing Measurable Quality of the Project can be expressed in project definition Good Basis of Steering the Customer Iteration Complexity management Poor Complex social systems Cheap Expensive Probable range Steering range
18 Component level target costing
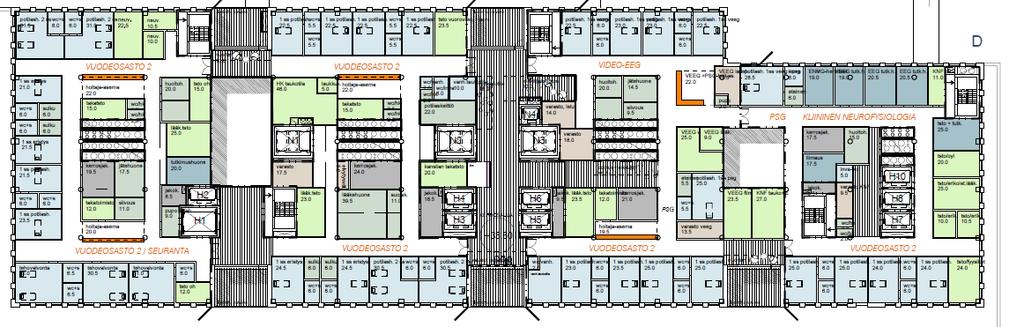
19 Flow concept; Activity Modeling Present State of Commitment Bill of Activities Social environment teaching Psychotherapy teaching Ergotherapy teaching Acuteward teaching Human ageing teaching Nursery teaching Proposed temporal and geometric loads to the spaces Size Size Size Alternatives for Value Generation - is the activity really needed? - are other activities needed? - combine activities to the same environment Space: Clinical treatment, 22 % utilization Activity 1 Time not in use Space: Polyclinic treatment, 8 % utilization Activity 2 Time not in use Space: Maternity ward, 15 % utilization Act 3 Time not in use Value Evaluation against Strategy
20 Activity Modeling Present State of Commitment Bill of Activities Social environment teaching Psychotherapy teaching Ergotherapy teaching Acuteward teaching Human ageing teaching Nursery teaching Proposed temporal and geometric loads to the spaces Size Alternatives for Value Generation - is the activity really needed? - are other activities needed? - combine activities to the same environment Space: Combined lab for ward-type activities utilization degree 45 % Actions 1 Time Actions 2 Act 3 not in use Value Evaluation against Strategy
21 Transformation concept
22 Project Level Target Cost, Feedback
23 Transparency, Dialogue, Flow
24 Transparency, Dialogue
25 Component Level Target Cost
26 Component Level Target Cost
27 Decomposition of Design Design starts with solving connections of customer s activities and massing the building in its urban environment Components, like cooling beams, cooling units, switchboards and suspended ceilings are not under design. Designing for the customer.

28 Dialogue, business vs. construction Designing for production and contractors


29 What is real or right? Defending Champion Defending Champion is right until it is proved to be wrong. Diversity of design and control.
30
31 The new Childrens s Hospital in Helsinki

32

33

34

35

36


37 Project and construction management Haahtela- Group Architecture JKMM Architects OP- headquarters rehabilitation and extension 1 / Construction is completed - In Target Cost (250 million euros) and time schedule - Nominaded Tekla Total BIM Qlobal winner Finalist in Finlandia Prize for Architecture 2015

38

39
40 2018 Project Delivery Symposium: Delivering the future


41 Maximizing Success on Integrated Projects: An Owner s Guide An Overview of the Research and Owner s Guide
42 Maximizing Success on Integrated Projects: An Owner s Guide Greg Gidez (co-chair), Hensel Phelps Construction Co. Mark Konchar (co-chair), Balfour Beatty Construction Howard W. Ashcraft, Esq., Hanson Bridgett LLP Spencer Brott, Trammell Crow Real Estate Services Bill Dean, M.C. Dean, Inc. Tom Dyze, Walbridge Matthew Ellis, US Army Corps of Engineers Behzad Esmaeili, University of Nebraska-Lincoln Bryan Franz, University of Florida Diana Hoag, Xcelsi Group, LLC Mike Kenig, Holder Construction Robert Leicht, Penn State University Russell Manning, Department of Defense John Messner, Penn State University John Miller, Barchan Foundation, Inc. Keith Molenaar, Univ. of Colorado Brendan Robinson, U.S. Architect of the Capitol Victor Sanvido, Southland Industries Ronald Smith, Kaiser Permanente David P. Thorman, Former California State Architect
43 Research Motivation To improve owner delivery decisions by providing practical guidance based upon empirical evidence 1998 CII/Penn State Study of 351 projects Metric D-B vs. D-B-B D-B vs. Unit Cost 6.1% lower 4.5% lower Construction Speed 12.0% faster 7.0% faster Delivery Speed 33.5% faster 23.5% faster Cost Growth 5.2% less 12.6% less Schedule Growth 11.4% less 2.2% less
44 Research Motivation To improve owner delivery decisions by providing practical guidance based upon empirical evidence 1998 CII 2015 CPF-CII Question How do project delivery methods impact performance? How does the level of integration impact project delivery success? Scope Delivery DBB, CMR and DB Delivery, procurement, contracting, behaviors and environment Findings DB was faster than DBB and CMR Cost and schedule growth were highest for DBB Combined contracts were faster than split contracts Cost and quality were driven by procurement and contracting
 49 100,000-199,000 ft 2 (44%) 90 0-99,000 ft 2 Number of Projects 1 32 Educational 204 Projects Public: 127 (62%) Private: 77 (38%) Completed: 2008-2013 Facility Types")
45 Project Data Characteristics Facility Sizes (4%) (3%) 8 7 > 700,000 ft 2 600, ,000 ft 2 (2%) 3 500, ,000 ft 2 (3%) 6 400, ,000 ft 2 (7%) , ,000 ft 2 (13%) , ,000 ft 2 (24%) , ,000 ft 2 (44%) ,000 ft 2 Number of Projects 1 32 Educational 204 Projects Public: 127 (62%) Private: 77 (38%) Completed: Facility Types Office Health Care Lodging Commercial Sports & Recreation Manufacturing Correctional Transportation 56 (27%) 41 (20%) 32 (16%) 27 (13%) 20 (10%) 11 (5%) 11 (5%) 4 (2%) 2 (1%)
46 Framework Group Cohesion Development into an effective unit Delivery Method Delivery Strategy Payment Plan for structuring Terms design and construction services Project Performance Cost Schedule Quality Procurement Process Team Integration Bringing together In high-quality interactions Goal: Determine if team processes and behaviors have an impact on project performance
47 Team Integration Group Cohesion Integration Group Cohesion Development into an effective unit Team Integration Bringing together In high-quality interactions


48 Team Integration Integration Group Cohesion Participation in Joint Goal Setting Team Cross Disciplinary design charrettes BIM Execution Planning Integratio Increased sharing of information and analysis through n BIM Increased Cohesive team interaction through colocation ness Higher levels of integration led to: Reduced schedule growth Enabled more intense schedules Led to more cohesive teams


49 Team Integration Group Cohesion Group Cohesion Commitment to shared goals High levels of team chemistry Communication is timely and effective Higher group cohesiveness led to: Reduced cost growth Higher system quality Improved turnover experience
50 Group Cohesion Team Team Integration
51 Group Cohesion 70% of projects delivered late had below average levels of Team Integration Team Team Integration
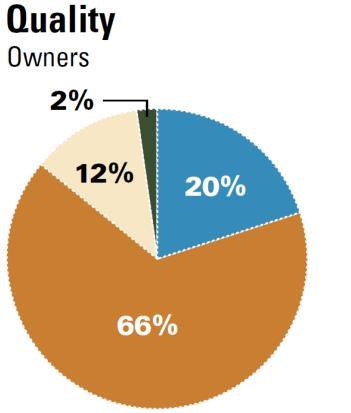
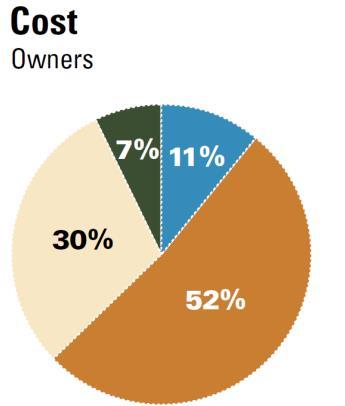
52 Group Cohesion 60% of on budget projects had above average levels of Group Cohesion Team Team Integration
53 Group Cohesion Team Team Integration
54 Group Cohesion Group Cohesion DBB Team Team Integration
55 Group Cohesion Team Team Integration
56 Group Group Cohesion DB Team Team Integration
57 Group Cohesion IPD Team Team Integration
58 Group Cohesion IPD DBB DB We need to consider more than just delivery method Large variance within each delivery method Team Team Integration
59 Group Cohesion Development into an effective unit Delivery Strategy Plan for structuring design and construction services Project Performance Cost Schedule Quality Team Integration Bringing together In high-quality interactions
60 Delivery Method Payment Terms Delivery Strategy Plan for structuring design and construction services Procurement Process Single contract for design and construction Builder was hired at SD or earlier Trades were hired at SD or earlier Builder had an open book contract Builder was prequalified Trades were prequalified Builder was selected based on cost of work Trades were selected based on cost of work Class I Class II Class III Class IV Class V Measurements of the project organization that reflect the owner s delivery strategy
61 ber of Cases ntage of Cases Number Number of Cases of Cases Percentage of Cases Number of Number Cases Number of Cases of Cases Percentage of Cases Percentage of Projects Number of Number Cases o Timing of Involvement Class I (n=19) 50% 75% 25% 50% Early Involvement of the Builder and/or Trades Project Delivery Strategy Class I Class II Class III Class IV Class V Traditional PRE CONC (n=19) SD DD CD BID PRE Closed CONC Book CM SD (n=39) DD CD BID Class III (n=54) Open Book CM (n=54) PRE CONC SD DD CD BID Closed PRE CONC Book CM SD (n=39) DD CD BID Class V (n=36) Open Book CM (n=54) PRE CONC SD DD CD BID Timing of Involvement 100% 0% 25% 75% 100% 0% 50% 75% 100% 25% 50% 75% 0% 25% 50% 100% 0% 25% 75% 100% 0% 50% 75% Clos PRE PRE Ope PRE 400 Ope PRE Notes: Tim 30 design co Conceptu DD = Desi 20 documen Primary Contractor / CM Trade Contractors PRE = Pre-Design CONC = Conceptual Design SD = Schematic Design DD = Design Development CD = Construction Documents BID = Bidding PRE CONC SD DD CD BID Phase of Design Open PRE Book CONC CM SD(n=54) DD CD BID Timing of Involvement 25% 50% 0% 25% 100% 0% 75% 10 0 PRE Notes: Tim design co Conceptu DD = Des documen 20 50%
62 Underlying Themes Open Book Payment Terms Project Delivery Strategy Class I Class II Class III Class IV Class V Early Involvement of the Builder and Trades Qualification Based Selection
63 Group Cohesion V III II IV I Team Team Integration
64 Group Cohesion Reduced cost growth Improved turnover experience Higher system quality V The Owner s Guide Pulling it all together III II IV Reduced schedule growth Enabled more intense schedules Led to more group cohesion I Team Team Integration


65 Sponsored by the Charles Pankow Foundation and the Construction Industry Institute Website:


66 C A P T U R E A N D L E V E R A G E T H E L E A N A D V A N T A G E LCI CONGRESS PRESENTATION STYLE GUIDE Why Projects Excel? Great Design Enabled by Lean 3/19/2018 LEAN CONSTRUCTION INSTITUTE


67 Stakeholder Satisfaction
68 Business Case for Lean! ( Owners) % of BEST Projects Achieving Outcome 3X

69 Common Project Myths 1. Delivery matters less than choosing the right people behaviors can t be dictated by a contract 2. IPD contracts are too complicated, Lean tools are too rigid 3. IPD only works on large complex healthcare projects Teams new to IPD and lean are at a disadvantage 4. Owners aren t getting best value or Owners are getting value but the team is not making profit 5. IPD and IPD-lite are essentially the same; financial incentives and release of liability are no big deal
70 Research Overview ( Designers) Sample Size (n): 310 Designers/ 620 projects Respondents Portfolio Size of Firm Familiarity with Lean Office Public buildings Education (Higher Retail Hospitals/Other Education (K-12) Apartments and 81% 66% 63% 57% 55% 53% 50% % % % % % % % No 36% Yes 64%

71 What is most important to Designers?
72 Great Design Enabled by Lean. (2017 Designers) % of BEST Projects Achieving Outcome
73 Organization Structure Choices (Owners)
74 Commercial System Choices

75 Operating System Choices (Designers)

76 How do we speed industry transformation?

77


78 Learn More Order publications to assist you and your team on your Lean Journey: Connect with your local LCI Community of Practice: Access tools: