THERMAL INTEGRITY PROFILING AS A DRILLED SHAFT QUALITY ASSURANCE TOOL
|
|
|
- Ross Barber
- 5 years ago
- Views:
Transcription


1 THERMAL INTEGRITY PROFILING AS A DRILLED SHAFT QUALITY ASSURANCE TOOL Mark Gaines, PE State Bridge Construction Engineer Washington State Department of Transportation September 10th, 2015
2 PRESENTATION OVERVIEW WSDOT s drilled shaft construction program Traditional shaft quality assurance at WSDOT Thermal Integrity Profiling Basics Implementation on Construction Contracts What we learned The way forward
3 WSDOT S DRILLED SHAFT CONSTRUCTION PROGRAM WSDOT s started drilled shaft construction in late 70 s. For past 10 years, average exceeds 100 shafts per year. Range from 4-12 feet in diameter and feet in length. Vast majority (95%) constructed as wet shafts.
4 TRADITIONAL SHAFT QUALITY ASSURANCE AT WSDOT Primary QA has been cross-hole sonic log (CSL) testing 100% of the wet shafts are CSL tested Backed up by: Inspector observations Monitoring of concrete and slurry levels Concrete yield plots
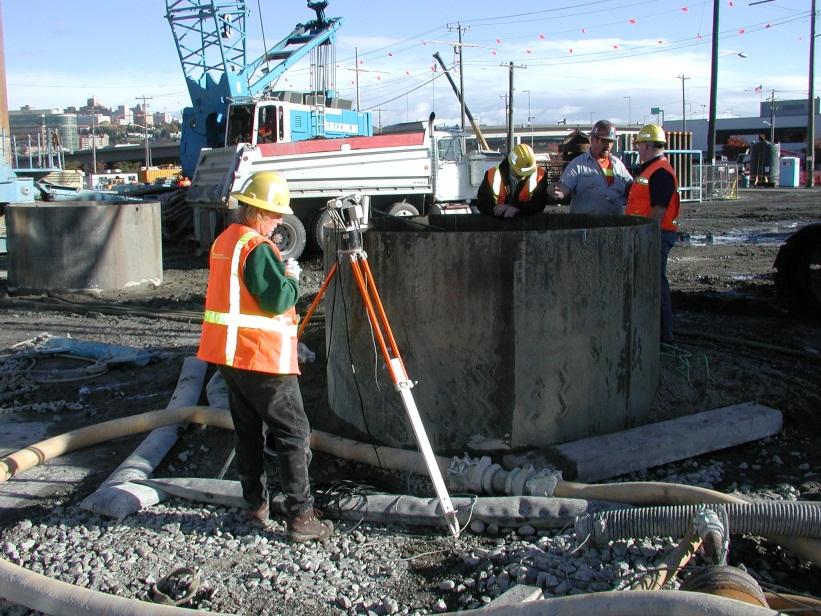


5 TRADITIONAL SHAFT QUALITY ASSURANCE AT WSDOT


6 TRADITIONAL SHAFT QUALITY ASSURANCE AT WSDOT

7 TRADITIONAL SHAFT QUALITY ASSURANCE AT WSDOT Limitations on CSL Testing: Can be a sensitive test. False anomalies aren t uncommon. Only validates core of shaft. WSDOT has used Thermal Integrity Profiling on two recent projects.
8 THERMAL INTEGRITY PROFILING BASICS Uses heat generated by hydrating concrete to determine quality. Measurements taken near shaft perimeter and uniformly around and along shaft. Adjustments for shaft geometry, concrete properties, water table, type of soils, presence of casing, etc. ASTM D7949 Standard Test Methods for Thermal Integrity Profiling of Concrete Deep Foundations

9 THERMAL INTEGRITY PROFILING BASICS THERMAL WIRE METHOD One wire per foot diameter of shaft Sensors located every foot
10 THERMAL INTEGRITY PROFILING BASICS THERMAL PROBE METHOD One access duct per foot diameter of shaft Reusable thermal probe to get temperatures


11 THERMAL INTEGRITY PROFILING BASICS Basic output is temps at each node Data is further postprocessed (discussed later)
12 IMPLEMENTATION AT WSDOT Participated in research testing in 2010 Used the thermal probe method WSDOT purchased testing equipment and used for QA testing and shaft acceptance on two contracts Selected the thermal wire method


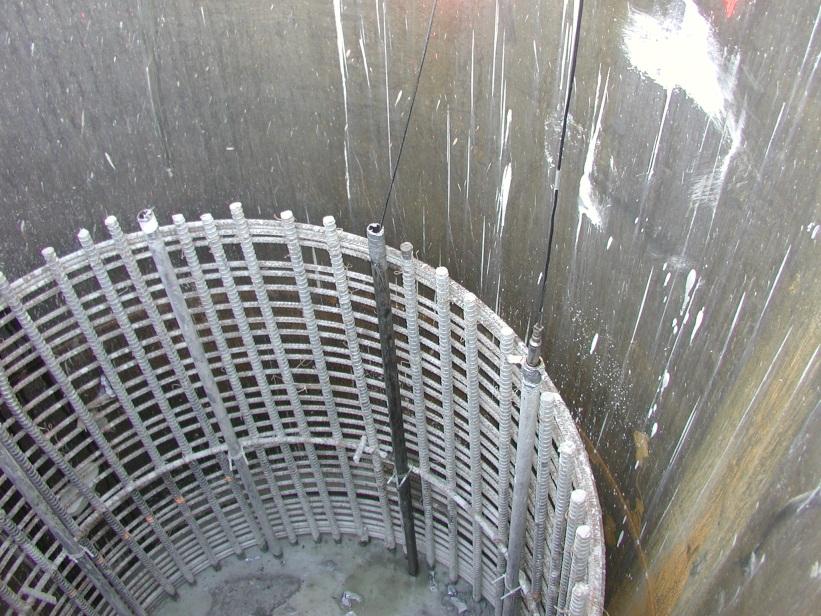
13 IMPLEMENTATION AT WSDOT INSTALLING THE THERMAL WIRES


14 IMPLEMENTATION AT WSDOT PROTECTING THE TAPS

15 IMPLEMENTATION AT WSDOT OBTAINING DATA READINGS

16 IMPLEMENTATION AT WSDOT COLLECTING THE TAPS TAP s obtained: Once slurry pumped down, and Once sufficient time has elapsed If needed, TAP s can be reconnected.


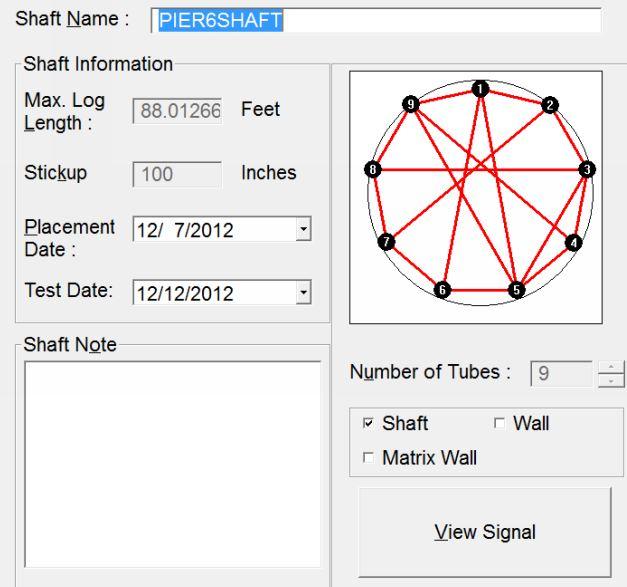
17 IMPLEMENTATION AT WSDOT DOWNLOADING THE THERMAL DATA

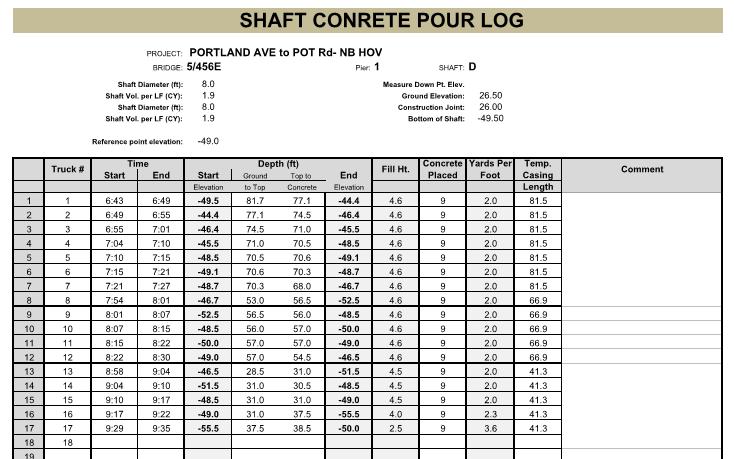
18 IMPLEMENTATION AT WSDOT DATA SUPPLIED BY THE FIELD

19 IMPLEMENTATION AT WSDOT POST-PROCESSING AND RESULTS LEVEL 1 Performed in the field using TIP Main Unit Verify shaft length Identify top and bottom Locate immediate areas of concern LEVEL 2 Added Element Field Records Find relationship between concrete volume and measured temperature Predict as-built shaft radius, shape, and cover Information and graphics courtesy of Pile Dynamics Inc. Level 1 Analysis

20 IMPLEMENTATION AT WSDOT POST-PROCESSING AND RESULTS LEVEL 3 Thermal Modeling using TIP Reporter Completed with desktop software Top & Bottom Roll Off Corrections Analyze Radius vs. Depth Information and graphics courtesy of Pile Dynamics Inc. Level 3 Analysis
21 WHAT WE LEARNED SOME EXAMPLES FROM WSDOT PROJECTS


22 WHAT WE LEARNED MANETTE BRIDGE SOIL CAVING After placing cage, 40 CY of material sluffed into shaft Cage was extracted and soils removed Used TIP to evaluate actual shaft geometry
23 WHAT WE LEARNED MANETTE BRIDGE SOIL CAVING C-7926 Manette Bridge Pier 2 South Shaft Effective Shaft Radius (ft) C-7926 Manette Bridge Pier 2 South Shaft Temperature (deg F) Results showed as-built geometry Limits of voiding Effective radius at all shaft locations T T T Avg Avg T1 T2 T3 T4 BOS T5 T6 Elevation (ft) TOS Depth (ft) Model Elevation (ft) Good correlation with concrete yield plot Depth (ft) 0 T7 T8 T TOS BOS BOC Actual vs. Modeled Temps. BOC Predicted Shaft Radius


24 WHAT WE LEARNED I-5 M-STREET TO PORTLAND BULGE Bulge of concrete identified. Potential for affecting seismic design. Allowed Engineer to review for structural acceptance. Flat view of Temps. Estimated concrete cover


25 WHAT WE LEARNED I-5 M-STREET TO PORTLAND CAGE RACKING Detailed for 6 cover Testing identified cage racking near shaft tip Min. cover approx. 3.5 Due to low corrosion potential at shaft tip, shaft was accepted. Section near shaft tip Estimated concrete cover
26 THE WAY FORWARD PROS AND CONS OF THERMAL INTEGRITY PROFILING Pros Cons Indicates quality of shaft core and cover A bit of a black box Testing as early as 24 hours after placement Builds a 3D model of shaft geometry Thermal wires prone to damage/failure Thermal wires are a proprietary product

27 THE WAY FORWARD OTHER OBSERVATIONS Cost-wise, comparable to CSL testing. CSL tubes and thermal wires have similar costs Equivalent labor for each method TIP methods/materials are improving! New wire just released to reduce failures TIP data often leads to more acceptance evaluation This is a good thing.
28 THE WAY FORWARD FUTURE USE AT WSDOT WSDOT is generally pleased with the TIP methods Provides deeper review than CSL testing Currently reviewing/updating specifications Likely expand use to additional projects Still want to keep CSL testing May reserve TIP for larger, deeper shafts
29 THERMAL INTEGRITY PROFILING AS A DRILLED SHAFT QUALITY ASSURANCE TOOL Comments/Thoughts? Mark Gaines, PE (360) gainesm@wsdot.wa.gov