Long-Term Settlement Performance Monitoring, I-15 Reconstruction Project, Salt Lake City, UT. Steven Bartlett, University of Utah
|
|
|
- Donald Welch
- 5 years ago
- Views:
Transcription
1 1 Long-Term Settlement Performance Monitoring, I-15 Reconstruction Project, Salt Lake City, UT Steven Bartlett, University of Utah
 Salt Lake City")
2 Roadway Widening (I-15 Project) Salt Lake City Utah, USA


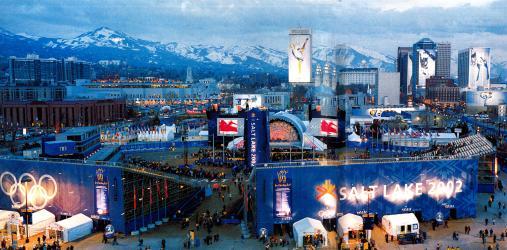

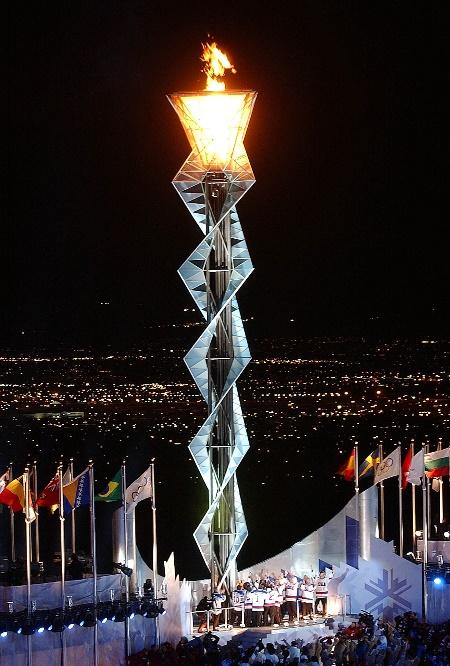
3 2002 Host of Winter Olympics
4 I-15 Reconstruction - Quick Facts Single Largest Design-Build Highway Contract in U.S. Kiewit (Prime Contractor) Woodward Clyde Consultants (Geotechnical Consultant) 17 Miles of Urban Interstate Widen from 6 lanes to 10 lanes $1.5 Billion U.S. Largest Design-Build Contract at that time 4 Year duration ( ) before 2002 Winter Olympics 144 Bridges/Overpass Structures 160 Retaining Walls (mostly MSE Walls) 100,000 m3 of EPS Geofoam (World s Largest Geofoam Project) Approximate $6 M Research Program (4 years)
5 Project Requirements 1. Widen interstate from 6 lanes to 10 lanes 2. Complete project in 4 years (prior to 2002 Olympics) 3. Maintain at least 2 lanes of traffic each way during entire project 4. Minimize amount of property that needs to be purchased (i.e., stay with current right-of-way) 5. Minimize construction settlement impacts to adjacent structures and utilities 6. Reduce post-construction settlement to 75 mm in 10 years 7. Complete project within budget ($1.5 B)


6 Interstate System in Salt Lake Valley Begin Project End Project
7 Cone Penetrometer (CPT) Profile in Salt Lake Valley Soft Sediments in Salt Lake Valley Upper Bonneville Clay Interbeds Soft Lake Bed deposits Lower Bonneville Clay

8 Settlement During Construction in 1960s 37 ft 27 ft Primary Consolidatin Settlement 2.5 year duration 4.5 ft


9 Consequences of Settlement Conventional Embankment Settlement of Approach Area
10 Typical I-15 Embankment Construction Temporary Wire Wall Surcharge 2-Stage MSE Wall Geotextile New embankment Existing embankment Alluvium Prefabricated Vertical Drains Lake Bonneville Silts and Clays Pleistocene Sands and Gravels


11 Prefabricated Vertical Drains Installed drain PV Drain Spacing 1.5 to 2.5 m triangular spacing Placement of anchor bar PV drain pushed into ground

12 Pre-drilling of PV Drains Required through Existing Embankment Approximate 3 drill rigs req d for one PV drain rig
13 PV Drain Summary 1. PVDs reduced primary consolidation settlement to 3 to 6 months and were q key component to I-15 success and on-time completion of project. 2. PVDs performed as expected. 3. Size and geometry of installation mandrel and anchor plate should be controlled by specification. 4. PVDs should not be spaced closer than 1.5 m triangular spacing for Lake Bonneville Deposits 5. Predrilling was required for installation of PVD s through large (8 m high) preexisting embankments.


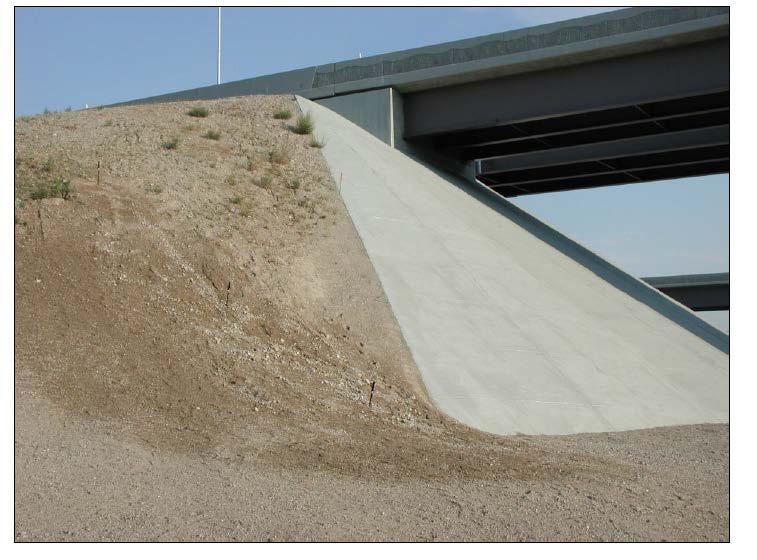
14 Geotextile Installation in Reinforced Slopes Geotextile Installed on 3H:1V slope Geotextile placement on sloped, pre-existing embankment Geotextile lapped into MSE wall


15 2-Stage MSE Walls Right-of-way constraints required many slopes to be built vertically. Beginning of 2-stage MSE Wall


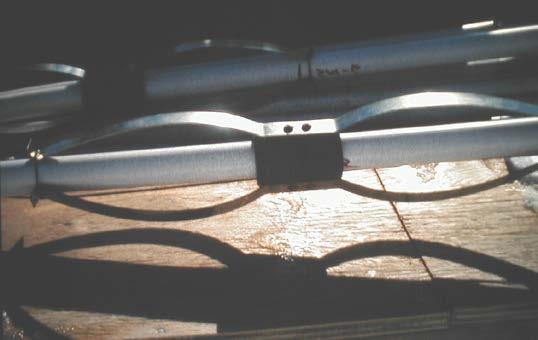
16 2-Stage MSE Wall Connections Female threaded rod coupler Attachment of Panels with threaded rod Concrete Fascia


17 MSE Wall Settlement and Deformation Issues Settlement Impacts to Adjacent Structures Deformation of Welded Wire Face at Toe of Wall


18 Surcharging to Reduce Settlement 5 million cubic meters of embankment placed on project
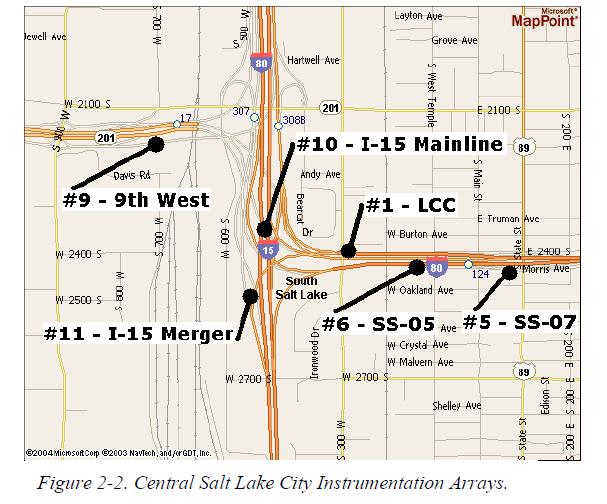
19 Long-Term Array Locations Location Type 300 W. MSE Wall on Lime Cement Columns 3300 S. Geofoam Wall (Creep & Load) 3500 S. MSE Wall (Deformation & Settlement) 200 S. MSE Wall (Settlement) S. Univ. Embankment (Settlement) W. Temple MSE Wall (Lt. Weight Backfill) 800 S. Geofoam (Lateral Earth Pressure) 100 S. Geofoam (Differential Icing) 2100 S. Embankment (Settlement) 400 S. Embankment (Settlement)

20 Typical MSE Wall Instrumentation Settlement Impacts to Adjacent Structures

21 200 South Street MSE Wall Instrumentation

22 200 South Street MSE Wall Instrumentation

23 200 South Street MSE Wall Instrumentation
24 200 South Street MSE Wall Instrumentation
25 MSE Wall Summary 1. Large primary consolidation settlement req d use of two stage MSE wall with flexible wire face. 2. Flexible faces can deform during construction and post-construction. 3. Increasing the horizontal reinforcement in the bottom half of the wall can reduce the deformation, but not completely eliminate it (horizontal bulge reduce by a factor of 2.) 4. Material type, compaction and construction procedures can also help in reducing face deformation. 5. Specifications should be written to define allowable face deformation and it should be measured and controlled 6. Zone of significant settlement influence is extends a distance of about 1.5 times wall height as measured from the face of the all.
26 900 West Embankment
27 Post-Construction (Secondary) Consolidation Settlement at Other Embankment Arrays
28 Sloped Earthen Embankment Settlement Performance Summary 1. Surcharges of 30 to 40 percent of the final embankment height were used in the downtown area of the project. 2. Large surcharged fills introduced slope stability concerns in at some locations, but no failures occurred in on the project. 3. Surcharge were to remain in place until 98 percent EOP consolidation was reached. 4. Design goal was to reduce secondary settlement to 3 inches or less in 10 years. 5. Post construction monitoring has shown that surcharging has been generally successful in achieving this goal, except at 900 W and 400 South embankment. However, the 900 W embankment was not surcharged and has undergone 6.5 inches of secondary settlement in 10 years.


29 Lime Cement Treatment Area (2400 S. 300 W.

; Su 300 to")
30 Lime Cement Stabilized Soil Auger / Mixer for Lime and Cement Lime Cement Column Rig 125 kg/m 3 15% lime 85% cement M = 30 Mpa (design); Su 300 to 400 kpa
31 Lime Cement Column Installation X-Section


32 1-Stage MSE Wall Construction Finished MSE wall 1-stage MSE placed over columns


33 Lime Cement Column Array
34 Objectives of Lime Cement Column Array 1. Determine the Primary Consolidation 2. Measure the Primary Settlement in the Treated Area and at adjacent structure 3. Measure the Secondary Settlement over 10 yr. Period 4. Measure the Shear Strength of the Treated Ground 5. Model the Construction and Long-Term Deformation Behavior

35 Pressure and Settlement Cells at Lime Cement Column Array Pressure and Settlement Cells Atop Column
 Date 7/24/98 11/1/98 2/9/99 5/20/99 8/28/99 12/6/99 3/15/00 6/23/00 10/1/00 1/9/01 4/19/01 7/28/01")
36 Fill Height vs. Load on Lime Cement Columns Fill Height (m) Date 7/24/98 11/1/98 2/9/99 5/20/99 8/28/99 12/6/99 3/15/00 6/23/00 10/1/00 1/9/01 4/19/01 7/28/01 11/5/ Stress ratio = 10:1 Fill 2 Fill 1 Pressure (kpa) PC1 (off column) PC2 (on column)

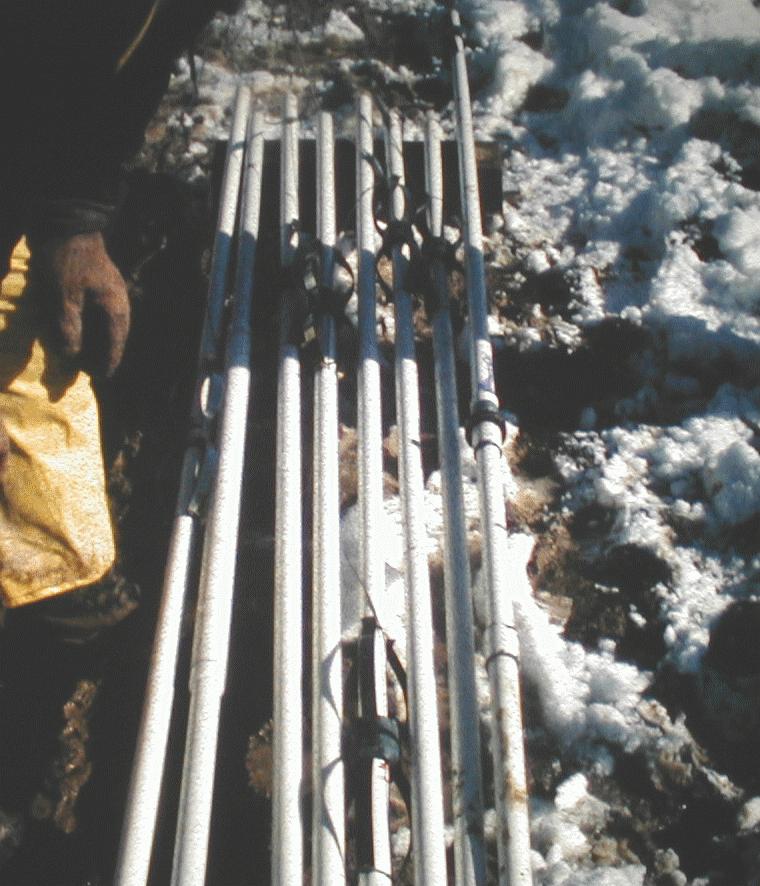
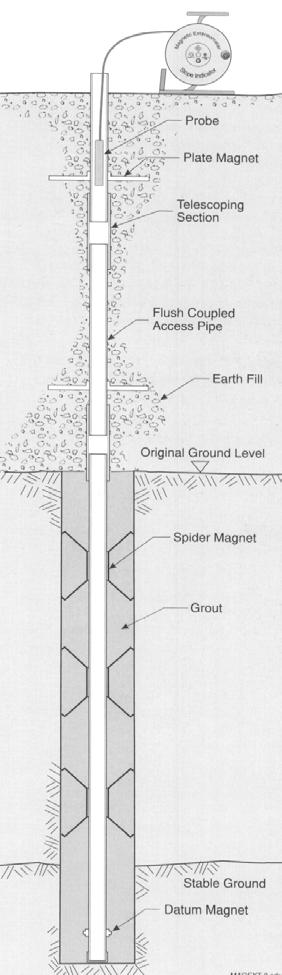
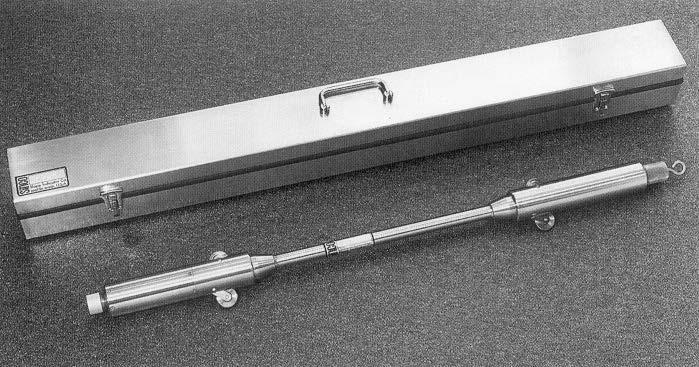
37 Borehole Magnetic Extensometer
38 Magnetic Extensometer Construction Settlement Measurements 23 cm of settlement at magnet extensometer location w/ 12 cm of settlement below column installation depth
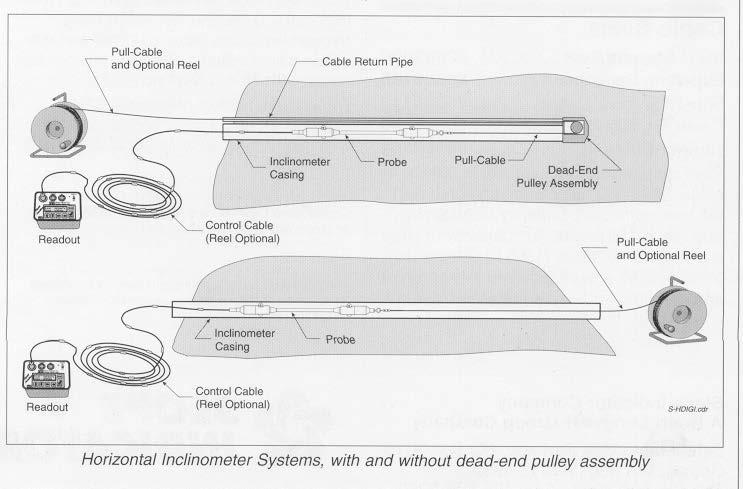
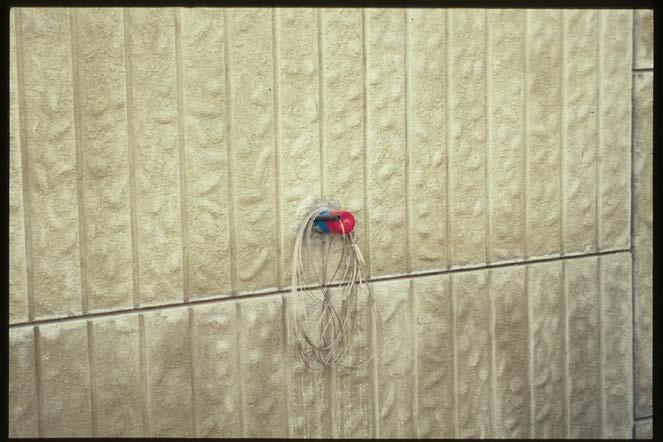
39 Horizontal Inclinometers
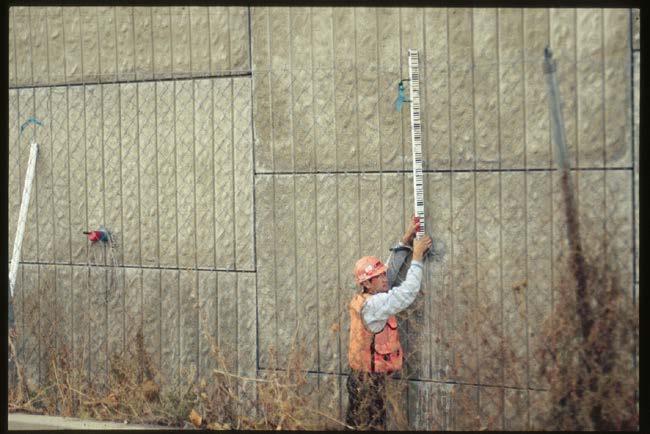
40 Horizontal Inclinometer Measurements at LCC Array Wall face

41 Ground Settlements at LCC Array (August 99 to June 2010)
42 Post-Construction Ground Settlements at LCC Array (August 99 to June 2010)
43 LCC Construction Performance 1. Primary Consolidation Settlement was reduced from about 1.0m to 0.2 m at LCC array. 2. Construction Settlement of about 18 cm occurred at MSE wall face. 3. Construction Settlement of about 3 to 4 cm occurred at south wall of nearby bldg. 4. Secondary consolidation settlement of 6.2 cm (2.5 inches) has occurred at the wall face in 11 years. 5. Lateral Displacement of about 4 cm occurred at wall face. 6. Column is carrying about 10 times the stress as the adjacent untreated ground.

44 Geofoam Embankment For Settlement Reduction Buried Utilities Geofoam Embankment from State St. to 200 W. Along Interstate I-80, Salt Lake City, Utah

45 Geofoam (Finished Cross Section)


46 Geofoam Embankment Construction Geofoam cut and placed around piling at bridge abutment Nearly Completed Geofoam Embankment with Vertical Face Transition Zone with MSE Wall


47 Load Distribution Slab Atop Geofoam Completed Load Distribution Slab Reinforced Concrete Load Distribution Slab atop Geofoam
48 Typical Geofoam Monitoring Array ROW OF SURVEY POINTS AT FACE OF WALL 25 MM - PVC STAND PIPE ROW OF SURVEY POINTS ALONG INSIDE EDGE OF MOMENT SLAB ROW OF SURVEY POINTS ALONG OUTSIDE EDGE OF EMERGENCY LAN CONCRETE PAVEMENT ROAD BASE LOAD DISTRIBUTION SLAB LEVEL 6 SQUARE PLATE WITH MAGNET RING 6.5 TO 7.3 m HEIGHT VARIES LEVEL 4 GEOFOAM BLOCKS LEVEL 2 GRANULAR BACKFILL LEVEL m BEDDING SAND VIBRATING WIRE TOTAL PRESSURE CELL


49 3300 South Geofoam Array Installation Magnet Extensometer and Pressure Cell Installation Pressure Cell in Base Sand Pressure Cell Cast in Bridge Abutment First Method of Placing Pressure Cell


50 Improved Method of Placing Pressure Cell Hot Wire Cut Pressure Cell Placed in Cut
51 Objectives of Geofoam Arrays Measure Creep Settlement of Geofoam Mass (10 yr.) Measure the Pressure Distribution within Mass Measure Differential Settlement in Transition Zones Measure Lateral Earth Pressure at Abutments Monitor for Differential Icing at Geofoam / Embankment Transition Zones Model Stress / Strain Behavior
52 100 South Magnet Extensometer Data Post-Construction Settlement
53 3300 South Array (VW Pressure Cells) LEVEL 6 LEVEL 4 LEVEL 2 LEVEL 0

54 Geofoam Transition Zones Post-Construction Settlement Transition slope 3.5 H : 1 V Transition zone face of wall 5/30/00 Post-Construction Settlement (mm) face of wall 3/18/01 inside edge of moment slab 5/30/00 inside edge of moment slab 3/18/01 outside edge of emergency lane 5/30/00 outside edge of emergency lane 3/18/ Mainline Stationing (m) baseline survey completed on 11/10/99.
55 Geofoam Conclusions 1. Geofoam fills are performing as expected with no major issues. 2. Approximately 1 percent vertical strain occurred during construction. a. Strain due to seating and compression of geofoam. b. This strain can damage rigid connections. 3. Approximately 0.3 to 0.4 percent creep strain has occurred in a 10-year post construction period. 4. The vertical stress distribution that develops in a geofoam wedge fill is complex, but generally diminishes with depth. 5. Pressure cell measurements suggest that approximately 30 kpa of vertical stress has developed in the center of the geofoam mass. This is slightly below the allowable dead load for the embankment.

56 Comparison of Overall Settlement Performance of Arrays


57 Questions