Texas Transportation Institute The Texas A&M University System College Station, Texas
|
|
|
- Damian Scott
- 5 years ago
- Views:
Transcription
1 1. Report No. FHWA/TX-05/ Title and Subtitle TESTING AND EVALUATION OF THE FLORIDA F SHAPE RIDGE RAILWITH REDUCED DECK THICKNESS 2. Government Accession No. 3. Recipient's Catalog No. 5. Report Date March 2005 Technical Report Documentation Page B 6. Performing Organization Code 7. Author(s) Dean C. Alberson, William F. Williams, and Wanda L. Menges 9. Performing Organization Name and Address Texas Transportation Institute The Texas A&M University System College Station, Texas Sponsoring Agency Name and Address Texas Department of Transportation Research and Technology Implementation Office P.O. Box 5080 Austin, Texas Performing Organization Report No. Report Work Unit No. (TRAIS) 11. Contract or Grant No. Project Type of Report and Period Covered Technical Report: September 2002 January Sponsoring Agency Code 15. Supplementary Notes Project performed in cooperation with the Texas Department of Transportation, Florida Department of Transportation and the Federal Highway Administration. Project Title: FDOT Bridge Rails 16. Abstract Ultimately, a bridge rail should contain and redirect errant vehicles with minimal damage to the bridge structure. A number of different types of concrete safety-shaped bridge rails are used by most states. Over the years, a number of different reinforcement schemes have been used and most have withstood the rigors of the highway environment. Obviously, reinforcement schemes may vary significantly and still achieve the objective to contain and redirect errant design vehicles. As experience is gained with bridge rails, designs change. The geometry, such as height, shape, and openness, may change due to vehicle mix, vehicle design changes, or public opinion. However, a move to a new design does not necessarily negate the usefulness of older systems. Or, an upgrade in performance requirements does not automatically indicate the older system will not perform acceptably when impacted under new performance requirement conditions. The safety performance of bridge rails is ultimately evaluated by a performance-based test, i.e. a full-scale crash test. Safety-shapes have been shown to perform acceptably in field applications. Many different types, shapes, and differently reinforced bridge parapets are used throughout the United States. Typical failure patterns of the safety-shaped bridge parapets follow the multiple hinge/pattern shown in the AASHTO LRFD Specification Section 13 Figure CA , however, the yield lines are usually confined to the upper portion of the safety-shape. This report investigates the required deck thicknesses associated with safetyshapes and more specifically the F-shape as adopted by Florida Department of Transportation. 17. Key Words Bridge Rail, F Shape, LRFD Bridge Deck Requirement, Roadside Safety 19. Security Classif.(of this report) Unclassified Form DOT F (8-72) 20. Security Classif.(of this page) Unclassified Reproduction of completed page authorized 18. Distribution Statement No restrictions. This document is available to the public through NTIS: National Technical Information Service Springfield, Virginia No. of Pages 22. Price
2
3 TESTING AND EVALUATION OF THE FLORIDA F SHAPE BRIDGE RAIL WITH REDUCE DECK THICKNESS by Dean C. Alberson, P.E. Associate Research Engineer Texas Transportation Institute William F. Williams, P.E. Assistant Research Engineer Texas Transportation Institute and Wanda L. Menges Associate Research Specialist Texas Transportation Institute Report Project Project Title: FDOT Bridge Rails Sponsored by the Florida Department of Transportation In Cooperation with the Texas Department of Transportation and and the Federal Highway Administration March 2005 TEXAS TRANSPORTATION INSTITUTE The Texas A&M University System College Station, Texas
4
5 DISCLAIMER The contents of this report reflect the views of the authors, who are responsible for the facts and the accuracy of the data, and the opinions, findings, and conclusions presented herein. The contents do not necessarily reflect the official view or policies of the Texas Department of Transportation (TxDOT), Federal Highway Administration (FHWA), Florida Department of Transportation, the Texas A&M University System, or the Texas Transportation Institute. This report does not constitute a standard, specification, or regulation, and its contents are not intended for construction, bidding, or permit purposes. In addition, the above listed agencies assume no liability for its contents or use thereof. The names of specific products or manufacturers listed herein do not imply endorsement of those products or manufacturers. The engineer in charge was Dean C. Alberson, P.E., (State of Texas, #74891). v
6 ACKNOWLEDGMENTS This project was conducted under a cooperative program between the Texas Transportation Institute, the Texas Department of Transportation, the Florida Department of Transportation, and the U.S. Department of Transportation, Federal Highway Administration. The authors acknowledge and appreciate the guidance of the TxDOT project director for this project, Mark Bloschock, and the Florida DOT project coordinator, Charles Boyd. vi
7 TABLE OF CONTENTS LIST OF FIGURES...viii CHAPTER 1. INTRODUCTION... 1 Page PROBLEM... 1 BACKGROUND... 1 CHAPTER 2. STUDY APPROACH... 3 TEST FACILITY... 3 TEST ARTICLE... 3 Design and Construction...3 Analysis of Bridge Railing...4 CHAPTER 3. STATIC LOAD TESTS STATIC LOAD TESTS ON SAFETY SHAPED TEST INSTALLATION Test A Test B Test C CHAPTER 4. ANALYSIS OF STATIC TEST RESULTS SUMMARY OF STATIC TEST RESULTS Test A Results ~ Load Applied to F-Shape Barrier End Case with #5 (16) Transverse Reinforcement in Deck on 4 1/2-inch (114 mm) Centers Test B Results ~ Load Applied to F-Shape Barrier Mid-Span Case with #5 (16) Transverse Reinforcement in Deck on 4 1/2-inch (114 mm) Centers Test C Results ~ Load Applied to F-Shape Barrier Mid-Span Case with #5 (16) Transverse Reinforcement in Deck on 8-inch (203 mm) Centers CHAPTER 5. CONCLUSIONS, IMPLEMENTATION AND FUTURE RESEARCH CONCLUSIONS IMPLEMENTATION STATEMENT FUTURE RESEARCH REFERENCES APPENDIX A. YIELD LINE ANALYSIS OF fdot BRIDGE RAIL APPENDIX B. BARRIER AND DECK STRENGTH CALCULATIONS vii
8 LIST OF FIGURES Figure Page 1 Strain Gage Layout for Florida F-Shape Bridge Railing Cross Section for Tests A and B Cross Section for Test C Section C-C of Florida F-shape Bridge Rail Load Frame Setup Test Setup for Static Load Testing Strain Gauge Details for Test A Strain Data for Reinforcing Steel in Traffic Face of Parapet for Test A Strain Data for Reinforcing Steel in Top of Deck for Test A Failure mode for Test A Stain Gauge Details for Test B Strain Data for Reinforcing Steel in Traffic Face of Parapet for Test B Strain Data for Reinforceing Steel in top of Deck for Test B Failure mode for Test B Stain Gauge Details for Test C Strain Data for Reinforcing Steel in Traffic Face of Parapet for Test C Strain Data for Reinforcing Steel in Top of Deck for Test C Failure mode for Test C viii
9 CHAPTER 1. INTRODUCTION PROBLEM The provisions of Section 13 of the American Association of State Highway and Transportation Official s (AASHTO) Load Resistance Factor Design Bridge Specifications are based on the assumption that the yield line failure pattern is confined to the concrete parapet and does not extend into the bridge deck (1). In the event that the yield line pattern extends into the deck, the equations for strength of the system will not be correct. There is argument for the philosophy that structural failure, in the event that such occurs from excessive load caused by an excessively severe collision, should be restricted to the parapet and not be allowed to extend into the bridge deck. Presumably, a structural failure that extends into the deck would be much more catastrophic and costly to repair than one that would be confined to the parapet only. On the other hand, one could argue that in an extremely severe collision, structural failure of the deck could be acceptable. A further argument can be made based on the philosophy that the parapet and the deck should each be designed to carry the design load without undue conservatism, and without regard to the manner in which the structure would fail, in the event that an excessive overload would occur. The question to be addressed in this task is the magnitude of bending moment for which the bridge deck should be designed. Should the deck be designed for the moment capacity of the barrier at its base? Or, should the deck be designed for the average bending moment over the height of the barrier (The bending moment value used to calculate the strength of the barrier)? Or, should the deck be designed to resist some other value of bending moment? BACKGROUND The AASHTO LRFD Specification Section 13 sets forth test levels and the required test conditions for demonstrating a bridge rail meets a certain test level. The Appendix to Section 13 gives engineering guidelines for designing bridge rails that will perform satisfactorily in fullscale crash tests. The Appendix to Section 13 was originally written as an aid to designers and not intended to be a mandatory design requirement. It is now interpreted by some individuals as a mandatory design requirement. Bridge rails may be designed by other methods and would be considered acceptable if the rail performed acceptably in full-scale crash tests. Ultimately, a bridge rail should contain and redirect errant vehicles with minimal damage to the bridge structure. A number of different types of concrete safety-shaped bridge rails are used by most states. Over the years, a number of different reinforcement schemes have been used and most have withstood the rigors of the highway environment. One end of the spectrum for steel reinforcement in concrete barriers is the Ontario Tall Wall (2). The Ontario Tall Wall is a safety shaped median barrier that was successfully crash tested with an 80,000-lb 1
10 ( kg) tractor/trailer, and no steel reinforcement was used in the system. A common safetyshaped bridge rail used extensively in Texas is the T501. The T501 uses a moderate amount of steel reinforcement. Other barriers use extensive reinforcement. Obviously, reinforcement schemes may vary significantly and still achieve the objective to contain and redirect errant design vehicles. As experience is gained with bridge rails, designs change. The geometry, such as height, shape, and openness, may change due to vehicle mix, vehicle design changes, or public opinion. However, a move to a new design does not necessarily negate the usefulness of older systems. Or, an upgrade in performance requirements does not automatically indicate the older system will not perform acceptably when impacted under new design requirement conditions. The safety performance of bridge rails is ultimately evaluated by a performance-based test, i.e. a fullscale crash test. Safety-shapes have been shown to perform acceptably in field applications. Many different types, shapes, and differently reinforced bridge parapets are used throughout the United States. For non-uniform thickness bridge parapets (such as safety shape) yieldline failure patterns, as shown in the AASHTO LRFD Specification Section 13, Figure CA , may not extend to the deck. Failure patterns sometimes tend toward punching type failures. This report investigates the required deck thicknesses (bending moment capacity) associated with safety-shapes and more specifically the F-shape as adopted by Florida Department of Transportation (FDOT). 2
11 CHAPTER 2. STUDY APPROACH TEST FACILITY The test facilities at the Texas Transportation Institute s Proving Ground consist of a 2000-acre (809 hectare) complex of research and training facilities situated 10 mi (16 km) northwest of the main campus of Texas A&M University. The site, formerly an Air Force Base, has large expanses of concrete runways and parking aprons well suited for experimental research and testing in the areas of vehicle performance and handling, vehicle-roadway interaction, durability and efficacy of highway pavements, and safety evaluation of roadside safety hardware. The site selected for placing of the Florida F-shape bridge rail is along a wide concrete apron/runway. The apron/runway consists of an unreinforced jointed concrete pavement in 12.5 ft by 15 ft (3.8 m by 4.6 m) blocks nominally 8-12 in ( mm) thick. The aprons and runways are about 50 years old and the joints have some displacement, but are otherwise flat and level. TEST ARTICLE Design and Construction Texas Transportation Institute (TTI) received drawings from Florida Department of Transportation entitled Traffic Railing Barrier (32-inch [813 mm] F-Shape) Index No. 700 (Drawing 2 of 2), and dated June 30, These drawings provided details for the concrete F- shape barrier constructed for his project. For this project, TTI constructed three different test installations using the Florida 32-inch (813 mm) F-shape barrier. Each test installation incorporated a different cantilever deck design supporting the concrete F-shape barrier. The concrete F-shape barrier was 32 inches (813 mm) in height and 10-3/4 inches (273 mm)wide at the top and 1 ft 6 inches (457 mm) wide at the base. Vertical reinforcement in the barrier consisted of #5 (#16) bars designated 5V and 5P spaced 8 inches (203 mm) on centers. The 5V bars extended 6 inches (152 mm) into the 8 inch (203 mm) thick cantilever decks supporting the barrier. Longitudinal reinforcement in the barrier consisted of eight #5 (#16) bars designated 5S with four bars moderately spaced on each side of the barrier cross-section. Two of the 5S bars were located outside of the vertical reinforcement with the remaining bars located within the vertical reinforcement. All exposed corners on the barriers and decks received 3/4-inch (19 mm) chamfer. Three different concrete cantilever deck designs were constructed and used to support the F-shape barrier. All three designs were constructed identically, with the exception of the spacing of the transverse reinforcement in the top and bottom layers. The three decks were 8 inches (203 mm) thick and were cantilevered 3 ft 6 inches (1.1 m) from the edge of an existing rigid concrete structure at the testing facility. This cantilever distance was representative of typical concrete deck cantilevers used on typical bridge structures in Florida. Longitudinal reinforcement in the deck consisted of two layers of #4 (#13) bars spaced 12 inches (305 mm) on 3
12 centers with two additional #4 (#13) bars located within the 5V bars in the bottom layer of longitudinal reinforcement. Transverse reinforcement in the top and bottom layers in the three deck designs consisted of #5 (#16) bars spaced at 4.5 inches, 6.0 inches and 8.0 inches (114 mm, 152 mm, and 203 mm) on centers. The lengths of the of the three test installations were 30 ft, 36 ft, and 44 ft (9.1 m, 11.0 m, and 13.4 m), respectively. Strain gages were placed on six transverse #5 (#16) bars in the top layer of reinforcement in the deck and six 5V bars at three different locations to measure the strain during applied static loading on the barrier. The location of the strain gages are shown on Figure 1. Static loading was applied to the barrier section using a hydraulic ram with a pressure transducer as shown in Figure 5. The load was uniformly distributed over a length of 3.5 ft (1.1 m) using a segment of W24x84 (W610x125) structural steel shape. Loading readings were measured and recorded from the pressure transducer until failure occurred in the concrete barrier. Compressive strength tests performed on representative samples of concrete taken from concrete used in the bridge railings and decks revealed an average compressive strength of approximately 4500 psi (31 MPa). Additional details are provided on Figures 1 through 5. Analysis of Bridge Railing The AASHTO LRFD Specification Section 13 sets forth test levels and the required test conditions for demonstrating a bridge rail meets a certain test level. The Appendix to Section 13 gives guidelines for designing bridge rails that will perform satisfactorily in full-scale crash tests. The yield line procedure in Section A was used to evaluate the Florida F-shape bridge rail. Both the mid-span and end span conditions were evaluated. Results of the yield line analysis for both conditions are included with this report in Appendix A. 4
13 5 Figure 1. Strain Gage Layout for Florida F-Shape Bridge Railing. FDOT BRIDGE RAIL TASK 3
14 6 FDOT BRIDGE RAILS -- TASK 3 Figure 2. Cross Section for Tests A and B.
15 7 FDOT BRIDGE RAILS -- TASK 3 Figure 3. Cross Section for Test C.
16 8 FDOT BRIDGE RAILS -- TASK 3 Figure 4. Section C-C of Florida F-shape Bridge Rail. (No static load tests on this section.)
17 9 FDOT BRIDGE RAIL -- TASK 3 Figure 5. Load Frame Setup.
18


, 42 inches (1067 mm) long.")

19 CHAPTER 3. STATIC LOAD TESTS STATIC LOAD TESTS ON SAFETY SHAPED TEST INSTALLATION The AASHTO LRFD Bridge Design Specifications design method analysis indicated the potential for poor performance in the full-scale crash test. Static tests replicating the loads used in the design procedure in AASHTO LRFD Bridge Design Specifications were performed to verify actual capacities of the bridge parapet. The static load tests were performed with a hydraulic ram attached to a braced load frame, pushing on a load cell, and placed against a spreader beam, W12 50 (W310 74), 42 inches (1067 mm) long. A wood bearing surface, tapered to match the slope of the traffic face of the parapet, was placed on the spreader beams. It also minimized stress concentrations due to surface imperfections in the parapet. The test setup is shown in Figure 6. Test A Test C Figure 6. Test Setup for Static Load Testing. 11
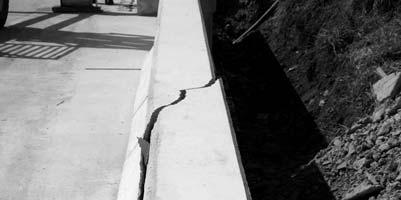
20 Test A Test A was performed on the end of an F-shape barrier segment to determine the actual strain in the 5V bars located at the end of the parapet. Strain data was obtained in six top transverse bars in the deck and in six vertical bars in the traffic face of the barrier. The application of loading on the end of the barrier was intended to represent the loading at a construction joint (see Figures 1 and 7 for details of strain gauge locations). The maximum load attained was approximately 64 kips (285 kn). The anticipated load from the yield line analysis was approximately 73 kips (325 kn). The results of the static test A are shown in Figures 8 and 9. The failure mode is shown in Figure 10. Highest values of strain were recorded at locations A3 and A4 of the vertical bars and A7 of the horizontal deck bars where cracking propagated through the parapet and end of the deck. Maximum recorded micro-strain was 2355 giving a computed stress (assuming elastic behavior) of 68.3 ksi (471 MPa) in the rebar. Data from location A2 was not obtained. Figure 7. Strain Gauge Details for Test A. 12
21 Strain (µε) Force (kips) Location A1 Location A2 Location A3 Location A4 Location A5 Location A6 Force Time (sec) Figure 8. Strain Data for Reinforcing Steel in Traffic Face of Parapet for Test A.
22 Strain (µε) Force (kips) Location A7 Location A8 Location A9 Location A10 Location A11 Location A12 Force Time (sec) Figure 9. Strain Data for Reinforcing Steel in Top of Deck for Test A.


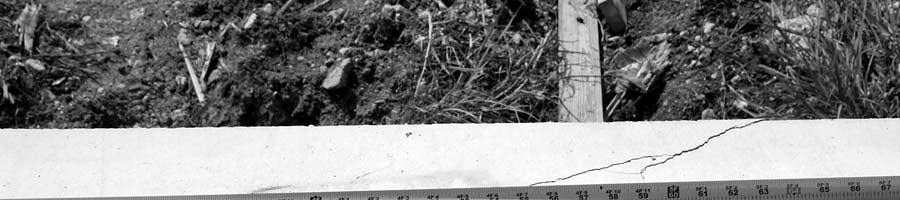


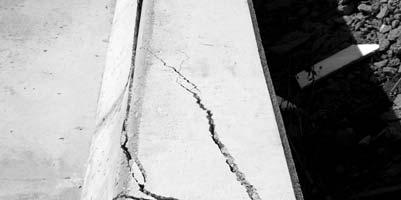
23 Figure 10. Failure mode for Test A. 15
24 Test B Test B was performed at the mid-span location of the F-shape barrier segment tested in Test A. At this location, the transverse reinforcement in the top of the deck was spaced 4 1/2 inches (114 mm) on center. Strain data was obtained in six top transverse bars in the deck and in six vertical bars in the traffic face of the barrier. The application of loading on the barrier was intended to represent the loading in the middle of a barrier section away from the influence of a joint or end conditions (see Figures 1 and 11 for details of strain gauge locations). The maximum load attained was approximately 104 kips (462 kn). The anticipated load from the yield line analysis was approximately 104 kips (462 kn). The results of the static test B are shown in Figures 12 and 13 below. The failure mode is shown in Figure 14. Maximum recorded micro-strain was 1778 giving a computed stress of 51.6 ksi (356 MPa) in the rebar. None of the cracking occurred near any of the strain gages. Figure 11. Stain Gauge Details for Test B. 16
25 Strain (µε) Force (kips) Location B1 Location B2 Location B3 Location B4 Location B5 Location B6 Force Time (sec) Figure 12. Strain Data for Reinforcing Steel in Traffic Face of Parapet for Test B.
26 Strain (µε) Force (kips) Location B7 Location B8 Location B9 Location B10 Location B11 Location B12 Force Time (sec) Figure 13. Strain Data for Reinforceing Steel in top of Deck for Test B.


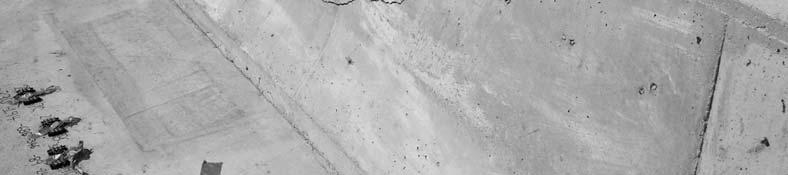
27 Figure 14. Failure mode for Test B. 19
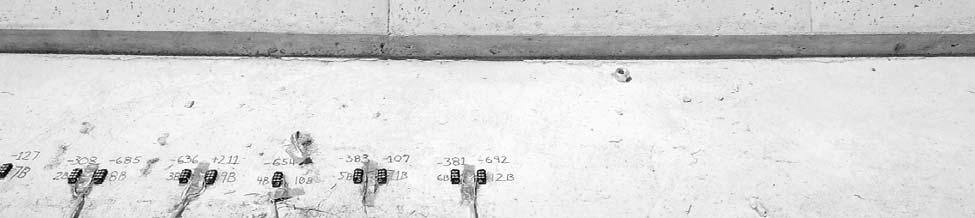
28 Test C Test C was performed at the mid-span location of the F-shape barrier segment supported by the 8-inch (203 mm) thick deck with the transverse reinforcement spaced on 8-inch (203 mm) centers. Like the previous tests, strain data was obtained in six top transverse bars in the deck and in six vertical bars in the traffic face of the barrier. The application of loading on the barrier was intended to represent the loading in the middle of a barrier section away from the influence of a joint or end conditions (see Figures 1 and 15 for details of strain gauge locations). The maximum load attained was approximately 104 kips (462 kn). The anticipated load from the yield line analysis was approximately 104 kips (462 kn). Maximum micro-strain in the parapet reinforcement was 1688 giving a computed stress of 49.0 ksi (338 MPa) in the rebar while a maximum micro-strain in the deck reinforcement was 2364 for a computed stress of 68.6 ksi (473 MPa). The results of the static test C are shown in Figures 16 and 17 below. The failure mode is shown in Figure 18. Data at location C9 was corrupted. Figure 15. Stain Gauge Details for Test C. 20
29 Strain (µε) Force (kips) Location C1 Location C2 Location C3 Location C4 Location C5 Location C6 Force Time (sec) Figure 16. Strain Data for Reinforcing Steel in Traffic Face of Parapet for Test C.
30 Strain (µε) Force (kips) Location C7 Location C8 Location C9 Location C10 Location C11 Location C12 Force Time (sec) Figure 17. Strain Data for Reinforcing Steel in Top of Deck for Test C.


31 Figure 18. Failure mode for Test C. 23
32
33 CHAPTER 4. ANALYSIS OF STATIC TEST RESULTS TEST RESULTS FOR DECK OVERHANG DESIGN ACCORDING TO AASHTO LRFD BRIDGE SPECIFICATIONS Information obtained from the strain gage testing program has been reviewed and analyzed as part of this project. This information is also provided in graphical form in Chapter 3. As previously stated, strain gages were located on bars in the parapet and top layer of tension reinforcement in the deck to determine the actual generated force transferred to the structural elements during loading of the barrier. The static loading applied to the barriers was performed in accordance with the information provided in Table A13.2-1, Section 13, AASHTO LRFD Bridge Design Specifications, 2000 Interim. The load was applied to the barrier systems via a hydraulic ram. The loading from the hydraulic ram was increased at a slow rate until failure of the barrier and deck supporting system occurred. Based on previous research, to develop the yield line failure mechanism as shown in AASHTO LRFD Bridge Design Specifications, Section A13.3.1, the flexural resistance of the deck per unit length should meet or exceed the flexural resistance of the concrete parapet at its base. SUMMARY OF STATIC TEST RESULTS Test A Results ~ Load Applied to F-Shape Barrier End Case with #5 (16) Transverse Reinforcement in Deck on 4 1/2-inch (114 mm) Centers The ultimate load applied to the barrier was approximately 64 kips (284 kn) just prior to failure of the barrier concrete. When the maximum load on the barrier was initially reached, the recorded strain in the vertical 5V bars varied from approximately 1020 micro-strain to approximately 2060 micro-strain. At the same time, the recorded strain in the transverse deck reinforcement varied from 934 micro-strain to 2014 micro-strain. Cracking of the concrete barrier was observed and this cracking extended down into the concrete deck at the joint. Considering the cross-sectional area of the reinforcement and the modulus of elasticity of the steel material of 29,000,000 psi (200,000 MPa), the calculated force in the 5V bars varied from approximately 9 kips (40 kn) to 18 kips (80 kn). Based on the yield strength of the steel material equal to 60,000 psi (414 MPa), the calculated force to yield a single 5V bar in tension is 18.6 kips (82.7 kn). Highest values of strain were recorded at locations A3 and A4 of the vertical bars and A7 of the horizontal deck bars where cracking propagated through the parapet and deck end. Maximum recorded micro-strain in the top transverse deck reinforcement was 2355 giving a computed stress of 68.3 ksi (471 MPa) in the rebar. In the static testing performed on the F-shape barrier with the transverse reinforcement closely spaced at 4 1/2 inches (114 mm) on centers (Test A), cracking did propagate into the deck from the testing performed on the end of the barrier segment and deck. However, the ultimate load applied to the barrier greatly exceeded the required load specifications for Test Level 4 loading conditions as stated in AASHTO LRFD Bridge Design Specifications. The nominal moment strength of the deck was 21.3 kip-ft per ft (94.8 kn-m per meter) and the 25
34 nominal moment strength at the base of the barrier was 28.8 kip-ft per ft (128.1 kn-m per meter). The area of reinforcement per foot of deck width used in Test A was 0.8 square inches per foot of deck width (1693 square mm per meter). This amount of top and bottom transverse reinforcement is currently used by Florida DOT for new 8-inch (203 mm) thick decks supporting the F-shape barrier. Using this area of reinforcement, the nominal flexural strength of the deck is approximately 74 percent of the nominal flexural strength at the base of the F-shape barrier. As observed in Test A, the yield line failure mechanism in the barrier did extend down into the concrete deck when excessive loads are applied at an end or joint. However, the parapet and deck will provide adequate containment at the 54 kip (240 kn) design load conditions for TL-3 and TL-4. Test B Results ~ Load Applied to F-Shape Barrier Mid-Span Case with #5 (16) Transverse Reinforcement in Deck on 4 1/2-inch (114 mm) Centers The ultimate load applied to the barrier was approximately 104 kips (462 kn) just prior to failure of the barrier concrete. When the maximum load on the barrier was initially reached, the recorded strain in the vertical 5V bars varied from approximately 700 micro-strain to approximately 1200 micro-strain. At the same time, the recorded strain in the transverse deck reinforcement varied from approximately 1200 micro-strain to approximately 1400 micro-strain. Cracking of the concrete barrier was observed at the maximum recorded load applied to the barrier. Cracking was not observed in the concrete deck at the ultimate load applied to the barrier. Considering the cross-sectional area of the reinforcement and the modulus of elasticity of the steel material of 29,000,000 psi (200,000 MPa), the calculated force in the 5V bars varied from approximately 7 kips (31 kn) to 10 kips (45 kn). Based on the yield strength of the steel material equal to 60,000 psi (414 MPs), the calculated force to yield a single 5V bar in tension is 18.6 kips (82.7 kn). Maximum recorded micro-strain in the top transverse deck reinforcement was 1778 giving a computed stress of 51.6 ksi (356 MPa) in the rebar. Test B was conducted on the same parapet and deck as used in Test A but the testing was done at the mid-span of the parapet. The recorded load at failure of the parapet was 104 kips (462 kn) and concrete failure was found only in the parapet. Using the associated strain values at the time of parapet failure, the computed moment at the base of the parapet was 18.1 kip-ft per ft (80.5 kn-m per meter). The computed nominal strength of the deck, as previously indicated, was 21.3 kip-ft per ft (94.8 kn-m per meter) and the computed nominal strength of the parapet at the base was 28.8 kip-ft per ft (128.1 kn-m per meter). When the parapet moment value obtained from the strain gages is compared to the design moment capacity of the cantilever deck, the parapet moment produces 85 percent of the deck moment capacity. Additionally, these load conditions are associated with a significant overload situation, 104 kips (462 kn). This load is almost twice the design load of 54 kips (240 kn) typically used in TL-3 and TL-4 parapet designs. Therefore, the current deck design used by FDOT is adequate from both a strength standpoint and a maintenance standpoint when overload situations are encountered at mid-spans. Furthermore, the moment at the base of the parapet obtained from strain data at parapet failure is only 63 percent of the nominal design moment capacity at the base of the FDOT F-shape parapet. 26
35 Test C Results ~ Load Applied to F-Shape Barrier Mid-Span Case with #5 (16) Transverse Reinforcement in Deck on 8-inch (203 mm) Centers The ultimate load applied to the barrier was approximately 104 kips (462 kn) just prior to failure of the barrier concrete. When the maximum load on the barrier was initially reached, the recorded strain in the vertical 5V bars varied from approximately 700 micro-strain to approximately 1000 micro-strain. At the same time, the recorded strain in the transverse deck reinforcement varied from approximately 1200 micro-strain to approximately 1900 micro-strain. Cracking of the concrete barrier was observed at the maximum recorded load applied to the barrier. Cracking was also observed in the concrete deck at the ultimate load applied to the barrier. Considering the cross-sectional area of the reinforcement and the modulus of elasticity of the steel material of 29,000,000 psi (200,000 MPa), the calculated force in the 5V bars varied from approximately 6 kips (26.6 kn) to 9 kips (40 kn). Based on the yield strength of the steel material equal to 60,000 psi (414 MPa), the calculated force to yield a single 5V bar in tension is 18.6 kips (82.7 kn). Maximum micro-strain in the parapet was 1688 giving a computed stress of 49.0 ksi (338 MPa) in the rebar while a maximum micro-strain in the top transverse deck was 2364 for a computed stress of 68.6 ksi (473 MPa). Based on the results from Test C, the F-shape barrier supported by the concrete deck using 0.47 square inches per ft (995 square mm per meter) of top and bottom transverse steel reinforcement per foot of deck width (significantly less than the 0.8 square inches per ft (1693 square mm per meter) used in Tests A & B) also met the Test Level 4 strength requirements in the AASHTO LRFD Bridge Design Specifications. However, concrete cracking in the barrier extended into the deck. Since the ultimate strength of the barrier supported by the deck with 0.47 square inches per ft (995 square mm per m) transverse steel met the strength requirements of TL-4, strength testing of the barrier supported by the decke with 0.62 square inches per ft (1312 square mm per m) transverse steel was not performed. Therefore, based on the results from this study, the Florida F-shape barrier can be supported by a concrete deck with significantly less flexural capacity than the base strength of the barrier and still satisfy the strength requirements of the AASHTO Test Level Four (TL-4) impact conditions. The deck strength in Test C, with the loading applied within the wall segment (mid-span case) the deck flexural resistance was approximately 45 percent of the flexural resistance of the F-shape barrier at the base. Based on the results from this study, the flexural resistance can be at least one-half the capacity of the flexural resistance of the F-shape barrier at the base and still meet the requirements of TL-4 loading conditions. However, cracking in the deck will likely occur if extreme loading conditions are applied to the barrier that greatly exceed the design force of 54 kips (240 kn) as stated in Table A During Test C, cracking in the barrier and deck was not observed when the applied force on the barrier was 54 kips (240 kn). Therefore, based on this study, deck flexural resistance of the concrete deck within a wall segment (mid-span case) can be limited to 45 percent of the flexural resistance at the base of the F-shape barrier and still meet the strength requirements of AASHTO TL-4. For additional information please refer to the calculations contained in Appendix B. 27
36
37 CHAPTER 5. CONCLUSIONS, IMPLEMENTATION AND FUTURE RESEARCH CONCLUSIONS The results of this project clearly indicate that the flexural strength of deck, as designed by FDOT and currently used by FDOT in conjunction with the F Shaped Bridge Parapet, is appropriate. The Florida bridge rail and deck designs tested for this project performed acceptably according to the AASHTO LRFD Bridge Design Specifications for TL-4 loading conditions. This research indicates that, for safety shaped bridge parapets, the design moment capacity of the deck can be less than the design moment capacity at the base of the safety shape. This research is contrary to the statement found in A in AASHTO LRFD Bridge Design Specification, that states.m s.exceeds M c of the parapet at its base. At end of parapet or expansion joints in the bridge, the deck flexural capacity should be increased and designed to minimize potential deck damage in overload conditions. IMPLEMENTATION STATEMENT Based on the results from this study, the flexural resistance of the concrete deck need not meet or exceed the flexural resistance of the concrete barrier at its base as stated in A in AASHTO LRFD Bridge Design Specification to meet the design forces for traffic railings as stated in Table A To achieve a crashworthy design, the flexural strength of the deck could be reduced below the flexural strength at the base of the barrier by as much as 45 percent depending flexural resistance of the barrier used in conjunction with flexural strength of the supporting slab. It is recommended that the flexural resistance of the deck meet or exceed the flexural resistance of the barrier base at all joints in the deck for a minimum distance of six feet from the ends of the joint. FUTURE RESEARCH Failure modes of the parapets witnessed in this research suggest that the yield line analysis/design procedures used in the AASHTO LRFD Bridge Design Specifications should be revisited. At center span load applications to failure in the parapet, the center vertical yield line was never produced. Further review of the damaged zones showed 45 degree shear planes from the load application region. This suggests punching shear may be a more appropriate method of analysis for center span failure of strong concrete parapets. 29
38
39 REFERENCES 1. American Association of State Highway and Transportation Officials, LRFD Bridge Design Specification, AASHTO Subcommittee on Bridges and Structures, Washington, D.C., May K. K. Mak and W. L. Campise, Test and Evaluation of Ontario Tall Wall Barrier with an 80,000-Pound Tractor-Trailer, Texas Transportation Institute, Contract No for Ontario Ministry of Transportation, Texas Transportation Institute, College Station, TX,
40
41 APPENDIX A. YIELD LINE ANALYSIS OF FDOT BRIDGE RAIL 33
42 34
43 35
44 36
45 37
46 38
47 39
48 40
49 APPENDIX B. BARRIER AND DECK STRENGTH CALCULATIONS FDOT 41
50 FDOT 42
51 FDOT 43
52 FDOT 44
53 FDOT 45
54 FDOT 46
55 FDOT 47
56 FDOT 48
57 FDOT 49