PROTECTIVE EFFECT OF CLAY PLASTER FOR THE FIRE DESIGN OF TIMBER CONSTRUCTIONS
|
|
|
- Benedict Bridges
- 5 years ago
- Views:
Transcription
1 EHITUSTEADUSKOND Ehitiste projekteerimise instituut PROTECTIVE EFFECT OF CLAY PLASTER FOR THE FIRE DESIGN OF TIMBER CONSTRUCTIONS SAVIKROHVI KAITSVA MÕJU ARVESTAMINE PUITKONSTRUKTSIOONIDE TULEPÜSIVUSE PROJEKTEERIMISEL EEK60LT Üliõpilane: Johanna Liblik (allkiri) Juhendaja: Dots. Alar Just (allkiri) Tallinn, 2015.a.
2 Olen koostanud lõputöö iseseisvalt. Kõik töö koostamisel kasutatud teiste autorite tööd, olulised seisukohad, kirjandusallikatest ja mujalt pärinevad andmed on viidatud... (töö autori allkiri ja kuupäev) Üliõpilase kood: Töö vastab magistritööle esitatud nõuetele (juhendaja allkiri ja kuupäev) Kaitsmisele lubatud.. (kuupäev) Kaitsmiskomisjoni esimees.. (allkiri) 1
3 LÕPUTÖÖ ÜLESANNE Üliõpilase kood Ehitustehnika õppesuuna üliõpilasele Lõputöö kood: Lõputöö juhendaja: Lõputöö teema: EAEI JOHANNA LIBLIK EEK 60LT ALAR JUST PROTECTIVE EFFECT OF CLAY PLASTER FOR THE FIRE DESIGN OF TIMBER CONSTRUCTIONS Savikrohvi kaitsva mõju arvestamine puitkonstruktsioonide tulepüsivuse projekteerimisel Lõputöö teema kehtivusaeg: Lõputöö ülesanne: Uurida savikrohvi kaitsvat môju puitkonstruktsioonidele tulekahjuolukorras. Katsete ja teoreetiliste uuringute tulemusena esitada ettepanekud krohvi kaitsva môju arvestamiseks EN arvutusmeetodite jaoks. Lõputöö sisu: Üldine kirjeldus puitkonstruktsioonide tulepüsivuse projekteerimise üldaluste (EN ) ja savikrohvi kohta. Eksperimentaalne osa koonkalorimeetri katsed erinevate savikrohvi koostiste ja paksustega. Katseandmete analüüs ja järeldused. Kokkuvõttena esitada ettepanekud EN arvutusmeetodites savikrohvi kaitsva mõju arvestamiseks. Töö kirjutada inglise keeles. Resümee eesti keeles Lõputöö väljaandmise kuupäev: Juhendaja: Alar Just.. Ülesande vastu võtnud: Johanna Liblik... 2
4 Contents 1 INTRODUCTION FIRE DESIGN OF TIMBER STRUCTURES Design of fire safety according to European system Two stages in building fires Standard temperature-time curve Behaviour of timber in fire Design of timber structures according to EN Design principles Charring of timber General One-dimensional charring Surfaces initially protected from fire exposure General Determination of start time of charring and charring rates CLAY PLASTER Introductory remarks History and background Properties of clay plaster Composition Clay Sand Fibres Water Behaviour in fire Substrate for plastering Preparation and application of clay plaster
5 4 EXPERIMENTAL STUDY Limitations Previous studies investigated in small-scale tests Charring of protected wood studs Charring behaviour of cross laminated timber The estimation of the fire protection ability of plaster Tests of the present study General Test method Cone Calorimeter Test specimens Timber members Installation of thermocouples Substrate for plastering Clay plaster Prepared specimens Test set-up and procedure Preparation of specimens for the test Calibration of cone calorimeter Testing procedure Test results Temperature measurements Observations Documentation of specimens Analysis and discussion Temperature measurements Analysis of the residual cross-section Recording of the plaster species Start time of charring Influence of the density of plaster Recommendation for calculations Charring rate Recommendation for calculations
6 4.5.6 Comparison to gypsum plasterboard Temperature measurements Start time of charring Charring rate RECOMMENDATIONS FOR THE FIRE DESIGN FURTHER NEEDS SUMMARY RESÜMEE APPENDIX A APPENDIX B REFERENCES
7 1 Introduction Nowadays one of the major challenges is to use resource-efficient materials and technology that cause minimal impact to the environment during production, construction, usage and recycling. Therefore, sustainable and energy conscious buildings with healthy and recyclable materials are becoming highly valuable. With growing interest and urgency within the building sector to use low carbon materials and renewable energy technologies, timber is gradually gaining greater recognition to be used in buildings. If properly harvested and economically responsibly transported, timber is a renewable resource. Since timber is a versatile material, it is seen to be well adapted to the use of the latest digital design and manufacturing methods. Innovative new technologies and building systems enable a wider range of timber construction solutions and building opportunities. Along with the development towards sustainable structural design of buildings, the demand for a healthy living environment is also increasing. Since in moderate to cold climates people spend a lot of their time indoors, more attention is increasingly paid on the building materials which have the direct effect on the room climate. Traditional building materials have been recognized to be perfect for utilizing sustainable and healthier design principles. The historical benefits of using natural materials are being rediscovered. It has been scientifically explained that clay plaster as a pure toxic free natural material has excellent properties to regulate indoor humidity [20]. It is understood that the use of clay plaster on more conventional buildings could radically change the nature of these buildings without needing a radical change in building design. The moisture buffering capacity of clay plaster has recently made the material a very popular solution to be used in low energy passive houses. Moreover, clay plasters have a long history of use in various timber construction techniques. Today, there are clear needs and demands for appropriate materials for the repair and conservation of historical buildings where it is vital for both the technical performance and the integrity and character of the buildings that authentic materials are used. [30] 6
8 However, nowadays the restrictions of the fire design of timber structures is one of the main reasons for limiting the use of traditional materials. The structural fire design of timber structures is given in Eurocode 5 Part 1-2 [4]. It has no information concerning plasters. Therefore, clay plaster has not been considered as a fire protection material. This is most probably because of the minimal amount of knowledge about the fire technical properties of clay plaster in conjunction with timber structures. Clay plaster as a protection layer for timber members has not been widely tested. Therefore, this present study should be a first step to determine the main properties which influence the fire behaviour of timber members protected with clay plaster the most. Aim of the thesis The aim of this thesis is to designate the protective effect of clay plaster for the fire design of timber structures and to give recommendations according to the safety philosophy of Eurocode 5 Part 1-2 [4]. 7
9 Acknowledgements I would like to express my deep gratitude to my supervisor Alar Just for his professional guidance and contribution to this research work. His dedication and constructive recommendations throughout this process have been an invaluable support to the author in order to achieve the outcome of this experimental research. My gratitude also extends to SP Technical Research Institute of Sweden in Stockholm for the opportunity to conduct the studies in their facilities. I would like to express deep gratitude to Brigit Östman, Lazaros Tsantaridis, Mattia Tiso, Daniel Brandon, Joachim Schmid and Joakim Noren for their advice and guidance, especially regarding the learning process. Special thanks should be given to Magdalena Sterley and her family for their kindness of supporting my stay in Stockholm. Additionally, I would like to acknowledge and express gratitude to all the people who contributed to this work and are part of the manufacturers of clay plaster in Estonia, Saviukumaja and Safran, especially Tõnu Mauring. Their advice, assistance and valuable technical knowledge about clay plaster made it possible to accomplish the aim of this thesis. Finally, I wish to thank my parents and friends for their support and encouragement throughout my study. 8
10 2 Fire Design of Timber Structures 2.1 Design of fire safety according to European system All essential requirements for construction works are defined in the Construction Products Regulations [1]. Safety in case of fire is one of the particular requirements for construction works stated in the CPR. It is a substantial and critical aspect to be considered while designing timber structures. [1] The CPR defines the requirements on fire safety that a construction must be designed and built in a way that in case of fire, the load-bearing capacity of the construction can be assumed for a specific period of time. In addition, the generation and spread of fire and smoke must be limited. Therefore, many more regulations concerning the safety of occupants in case of fire must be followed. [1] The requirements in CPR are further specified in European standards. The structural Eurocodes are the European design standards of components and structures for buildings. Eurocodes give design rules and requirements for the calculation and verification of loadbearing capacity of components and structures for different materials. [11] In Europe there are two possibilities of proving the fire safe use of construction, see Figure 2.1. Full-scale testing of building constructions is regulated by testing and classification standards. The design of building structures by means of calculations is regulated by design standards. [1] The calculation models compared to the full-scale testing are less time consuming and much cheaper in order to evaluate the load-bearing resistance of timber members. Although, the full-scale testing is a good method for the optimisation of construction build-ups while the calculation models are always on the safe side in comparison to full-scale fire test results. [10] However, the full-scale tests are too complicated and expensive while the initial purpose is to verify the fire resistance of the large number of possible combinations of building products. This variety of different combinations results in a constant need to develop new design parameters. Therefore, the laboratory experiments in small-scale tests together with the numerical modelling are often a necessary alternative method to be used. [10] [16] 9
11 The small scale laboratory experiments are useful and simple in order to examine the fire technical properties of different materials and possible combinations of products. Calculation models and numerical modelling allow investigating various combinations of building components considering the properties of the specific materials. While sufficient investigation has been done, new calculation methods need to be verified in full-scale testing. This approach is followed by the author in this thesis. [10] Figure 2.1 Systems for European fire standards for building products. [7] The design of buildings and other civil engineering works in timber (solid timber, sawn, planed or in pole form, glued laminated timber or wood-based structural products) or wood-based panels jointed together with adhesives or mechanical fasteners is comprised in EN 1995 Eurocode 5. The structural fire design of timber structures is specified in EN [4]. [9] The experimental work at this study is following the safety philosophy of EN
12 2.1.1 Two stages in building fires There are two different stages of a fire scenario to be considered in the fire safety of buildings in relation to building materials and structures. These are the initial phase and the fully developed phase, see Figure 2.2. Performance of the building materials has to be categorised in respect of those two phases. Therefore, the building codes regulate two main areas called the reaction to fire and the resistance to fire. [7] The reaction to fire means the initial response of a material to fire exposure which is taking into account parameters like ignition, heat release, fire spread and growth and smoke production. A European classification system for the reaction to fire performance is based on a set of EN standards. The European reaction to fire classes for building products contain mainly classes A to F, of which classes A1 and A2 are non-combustible products. There are also sub-divided classes for smoke production as s1-s3 and burning droplets as d0-d2. [7] Figure 2.2 Two main stages of the fire scenario for the fire safety design of building materials and structures [11]. The resistance to fire concerns structural elements which must withstand a fully developed fire and also fulfil certain performance requirements. The fully developed fire is described by the standard temperature-time curve given in ISO 834 [8]. If the fire 11
13 exposure is in accordance with the standard temperature-time curve, the performance criteria for fire resistance are the load-bearing capacity (R), integrity (E) and insulation (I). Fire resistance classes of construction products and building elements are defined in the classification standard EN [5] and related to the standard time-temperature curve. [7] Standard temperature-time curve To describe the fire action with simplified models, several nominal fire curves have been proposed in codes for the use in the design process. Since the knowledge of the performance of timber structures in natural fires is still limited, the rules given in EN mainly refer to the standard fire exposure. For the fire design, mainly the standard temperature-time fire curve according to ISO 834 [8] is used, see Figure 2.3. [7] Figure 2.3 Standard temperature-time curve according to ISO 834.[7] Standard fire curve provides a simple relationship for the temperature of the gases in a compartment as a function of time. However, it represents the fully developed fire phase, which means that the significant amount of time that sometimes elapses from the beginning of a fire until the fully developed fire phase is not included in the curve. In addition, the cooling or decay phase of the fire is not explicitly taken into account. [7] 12
14 2.2 Behaviour of timber in fire Wood consists mainly of cellulose and lignin, which themselves are formed from carbon, hydrogen and oxygen. This makes wood combustible. When sufficient heat is applied to wood, chemical degradation takes place with the resultant formation of charcoal and combustible gases, accompanied by a loss in mass. [12] The characteristics of timber make the behaviour of timber structures highly predictable when exposed to fire. However, the behaviour of timber in fire is influenced by many factors such as the form, surface, shape and size of the cross-section of timber as well as its density and the moisture content. [12] While the temperature rises the timber is drying and a decrease of strength takes place. When a temperature of 100 C is reached water starts to evaporate. The temperature in timber does not increase until all of the water has evaporated, see Figure 2.4. The Figure shows the increase of temperature after all water has evaporated. [12] Figure 2.4 Temperature inside the heated timber [12]. Gases that consist of 70% incombustible carbon dioxide (CO 2 ) and 30% combustible carbonmonoxide (CO) are generated between 150 C and 200 C. Once the temperature reaches 200 C, more combustible gases form and the proportion of CO 2 decreases. The temperature on the timber surface increases rapidly when the gases ignite. As the temperature rises, the carbonization of timber continues. [12] When temperature increases, cellulose starts to pyrolyse. Between the charred and natural timber a pyrolysis layer is formed which is about 5-10 mm thick. It is a zone where 13

15 timber has been affected chemically by the fire but has not fully decomposed; see Figure 2.5 The transition between the charred layer and unaffected timber corresponds to a temperature of 300ºC. Figure 2.5 Changes in timber under the influence of fire [12]. While wood burns and the temperatures are above 500 C the production of gases is reduced and the production of charcoal increases. As wood is a poor conductor of heat there is very little transmission of heat into the remaining unaffected material. The thermal conductivity of charcoal is only about one sixth of pure solid timber. As a result the core section of solid timber remains cool just a short distance from the burning zone. As a consequence the construction does not have to accommodate damaging thermal expansions. [12] [13] Because the temperature of the residual section remains cool, all of the cold state physical properties of the timber are retained. There is no change concerning physical properties. Therefore, the loadbearing capacity of timber depends only on the resulting reduced cross-section. As a result, timber properties are highly predictable when exposed to the fully developed fire conditions. [12] 14
16 2.3 Design of timber structures according to EN EN [4] is the first European design code to provide new approach and rules for the structural fire design of timber structures. It describes the principles, requirements and rules for the structural design of timber buildings exposed to fire and is intended to be used in conjunction with EN [3] and EN :2002 [2]. EN is concerned with requirements for mechanical resistance, serviceability, durability and fire resistance of timber structures. Other requirements, e.g. concerning thermal or sound insulation, are not considered. [3] [4] [7] Design principles One of the main objectives of structural fire safety is to guarantee the load-bearing capacity of the structure for the required period of time. The required time is normally expressed in terms of fire resistance, using fire exposure of the standard temperature-time curve. The required time is specified by the building regulations. [13] Fire reduces the cross-section of a timber member and therefore, charring is generally the dominating effect influencing the mechanical resistance of timber members. [7] For timber surfaces unprotected throughout the time of fire exposure, the residual crosssection can be calculated by a constant charring rate. If timber structure is initially protected from fire, the start of charring is delayed and the charring behind the protection is slowed down in comparison with unprotected cross-sections. This is closely explained in Chapter 2.4. [7] Charring of timber General Charring shall be taken into account for all surfaces of timber directly exposed to fire, and, where relevant, for surfaces initially protected from fire exposure, but where charring of the timber occurs during the relevant time of fire exposure. [4] The charring depth is the distance between the outer surface of the original member and the position of the char-line and should be calculated from the time of fire exposure and the relevant charring rate. According to EN the position of the char-line should be taken as the position of the 300-degree isotherm. [4] 15

17 The charring of timber members is divided into: 1. One-dimensional charring 2. Two-dimensional charring As a basic value, one-dimensional charring rate is usually taken as the value observed for one-dimensional heat transfer under ISO-fire exposure in a semi-infinite timber slab without any fissures or gaps. There are minimum requirements applied regarding the width of the cross-section for the application of one-dimensional charring rates instead of two-dimensional charring rates. [13] Two-dimensional charring implicitly includes the effects of corner roundings and fissures. The charring rate including these effects is called the notional charring rate according to EN Design codes define a simplified calculation of cross-sectional properties by assuming an equivalent rectangular residual cross-section where the charring rates are greater than the one-dimensional charring rate. Figure 2.6 shows the definition of charring depth for one-dimensional charring and notional charring depth. [7] [13] a) One-dimensional charring b) Notional charring Figure 2.6 Charring depth for one-dimensional charring (a) and notional charring depth (b). [4] Key : 1- Border of the residual cross-section; 2 Border of equivalent rectangular residual cross-section. 16
18 EN gives the one-dimensional charring rate a value of = 0,65 mm/min for softwood. In order to take into account the effects of corner roundings and fissures the notional charring rate according to EN for solid timber is 0,80 mm/min. [4] The charring rates are applicable for any orientation of fire-exposed surfaces and direction of fire exposure. Thereby, no distinction between vertical and horizontal surfaces is made. [7] One-dimensional charring According to EN the charring rate for one-dimensional charring of timber should be taken as constant with time, see Figure 2.7. In this study one-dimensional charring is taken as the basis of testing and used in the analysis of the results. Figure 2.7 One-dimensional charring (fire exposure from one side) [7]. The design depth should be calculated as: where: is the design charring depth for one-dimensional charring; is the one-dimensional design charring rate under standard fire exposure; t is the time of fire exposure. 17
19 2.4 Surfaces initially protected from fire exposure General If the structure is initially protected from fire exposure, the start of charring is delayed and while the protection remains in place after the start of charring, the rate of charring is slowed down in comparison with the charring rate of unprotected cross-sections. The formation of a char layer may provide effective protection against heat flux, especially in large cross sections. [7] For protected timber surfaces different charring rates should be applied during different phases of fire exposure [14]. Figure 2.8 and Figure 2.9 give simplified models adopted by EN The code gives factors and for multiplication of the charring rates. [5] According to EN for surfaces protected by fire protective claddings or other protection materials it should be taken into account that: - the start of charring is delayed until time [4]. This is illustrated in Figure 2.8 and Figure 2.9. Figure 2.8 describes when the start of charring is equivalent with the failure time of cladding. - charring may commence prior to failure of the fire protection, but at a lower rate than the charring rates for initially unprotected timber until the failure time of the fire protection [4]. In Figure 2.9 Phase 2 illustrates the period in which the protection remains in place some time after the start of charring. Phase 2 describes the charring of timber until failure of the protective claddings and is characterised by a reduced charring rate ( < 1). For a factor is multiplied with the charring rates of the initially unprotected timber members according to EN There could be two reasons for the falling off of protection. It could be a thermal degradation of the protection or a pull-out failure of fasteners due to charring of the timber behind the protection. Phase 3 describes the reduced charring rate if the char depth is not greater than 25 mm. [4] [7] 18
20 Charring depth - after failure time of the fire protection, the charring rate exceeds the values of initially unprotected timber until the time [4]. For the stage after failure of the protection given by the charring rates of the initially unprotected timber members should be multiplied by a factor. At that time, the fire temperature is already at a high level while no protective char layer exists to reduce the effect of the temperature. This value of charring rate continues as long as the char depth is not greater than 25 mm. Beyond that char depth, charring continues with the decreased rate valid for initially unprotected timber. [4] [11]; - at the time when the charring depth equals either the charring depth of the same member without fire protection or 25 mm whichever is the lesser, the charring rate reverts to the value of initially unprotected surfaces. [4] t c t f t a Time Figure 2.8 Variation of charring depth with time when t c t f. 19
21 Charring depth charring depth char layer 25 mm start of charring failure cladding phase 3 phase 2 phase 1 t c t f t a Time time Figure 2.9 Charring of timber for delayed failure of protection layer Determination of start time of charring and charring rates EN provides limited information for claddings other than gypsum and wooden boards on determination of the start of charring behind applied protection (claddings, linings), reduced charring rates and on failure times of protective layers. Today, the expressions are given for the calculation for some specific materials as wood-based panels and wood panelling, regular gypsum plasterboard type A, H and F and wool insulation. [7] The most commonly used universal protection material is gypsum plasterboard. For claddings consisting of one layer of gypsum plasterboard of type A, F and H according to EN 520 [6], at internal locations or at the perimeter adjacent to filled joints, or unfilled gaps with a width of 2 mm or less, the start time of charring should be taken as: where: is the thickness of the panel, in mm. [7] For when the charring of timber has started but the protection layer is still in place, the expressions are given to calculate the reduced charring rate for some materials. A protection factor is multiplied to the charring rates of the unprotected timber members. Design charring rates are specified in EN [7] 20
22 Where the timber member is protected by a single layer of gypsum plasterboard type F, should be taken as: where is the thickness of the layer (mm). [4] The failure time of fire protective claddings is also given for some materials. For gypsum plasterboard Type A and H the failure time should taken as: where is calculated according to expressions given in EN In general, the standard states that, unless expressions are given to calculate the start of charring, failure times of protective layers and charring rates of wood behind the protection where relevant, these must be determined by testing. [7] So far there is no existing information concerning properties of plasters according to EN The results of this thesis are compared to the gypsum plasterboard in order to illustrate the comparison between the different protection materials. 21
23 3 Clay plaster 3.1 Introductory remarks Earth, when using as a building material, is often given different names. Several expressions as earth, mud, loam or clay plaster are being used while describing the plaster where the only binding agent is clay. The reason why multiple terms exist could probably be attributed to the long historical background of the usage in various regions in the world. According to the German professor G. Minke the scientific term as loam is most widely used [20]. However, G. Minke has also used the word clay plaster, explaining that in his particular research it was necessary to note the specific binding agent in plaster [27]. While addressing the following sections on plaster in this thesis, the word clay plaster is recommended and used by the author of this thesis. It seems to be an appropriate description compared to the alternatives since clay refers to the binder in plaster, just as lime, cement or gypsum refer to the binder in their respective plasters [24]. A product standard for clay plaster at European level is missing. A German standard DIN 18947: [39] about earth plasters was published in 2013 and a modification was published in March This standard specifies terms and definitions, requirements and test methods for earth plasters manufactured in factories for rendering walls and ceilings in indoor areas and weather-proofed outdoor areas [40]. Since there was no translation of the DIN standard into English, it is not investigated in this thesis. Considering the purpose of this thesis, clay plaster as a building material is examined only by the materials main components as a basecoat plaster and their influence to its properties. Therefore, the following chapters do not comprise any information about different additives (except natural fibres), stabilized plasters nor detailed material about various types of coatings and finishes. 22
24 3.2 History and background Earth materials have been used extensively in ancient cultures over the world for thousands of years. Earth was the most prevalent building material which was used for homes and religious buildings. Even today, one third of the human population resides in earthen houses mostly in the developing countries. This is due to the properties of earth as it is a versatile building material that requires no special preparation and is available in most regions of the world. [20] [30] Building with earth has a long history of use in various construction techniques as rammed earth, cob, half-timbered, wattle and daub etc. The techniques of half-timbering have been used in many parts of the world during various periods such as ancient Japan, medieval England and Europe. It was the most popular building technique in Germany from the twelfth to the nineteenth century and many cities are nowadays famed for their half-timbered buildings. [31] Independently of the historical use of various infill materials in half-timbered buildings, clay plasters were frequently used as interior plaster. It was mainly used to protect the walls of the buildings but as well as ceilings. Earthen plasters were also used to beautify walls in large part because of its variations in local soils. Due to the properties of plaster it is still performing well after many centuries. [30] [23] [22] Clay plasters were used extensively in historic buildings prior to the 19th century. Their disappearance was partly an effect of the separation of agriculture from construction as a result of the industrial revolution. This change brought new manufacturing and processing technologies that enable the development of new building materials like steel and concrete which largely displaced the natural materials. As a result the disappearance of clay was not because the material was considered primitive but because of the changing economic conditions. As a consequence of industrialisation, building standards or regulations for earth building materials were developed in very few countries. [24] [30] [42] At the end of the 20 th century a new way of thinking arose in some industrialised European countries after the oil crises and health scandals concerning modern building 23
25 materials. As a result, sustainable development is becoming increasingly significant. Today, the use of unlimited energy by the industry is no longer acceptable and research is seeking out new materials with lower manufacturing costs, higher energy efficiency and life-cycle sustainability. [42] The demand for energy- and cost-effective buildings that emphasise a healthy and balanced indoor climate is rising. The thermal capacity of earthen materials to absorb and re-radiate heat can be used to harmonise the degree of air temperature fluctuation in rooms within buildings made with lightweight construction. Due to the favourable ecological properties of clay plaster, they are becoming more attractive materials used in new buildings. [22] [20] [35] In addition to the concern of new buildings, there are clear needs for continuation of the traditional construction techniques in which clay has been a prominent material. It is vital for both the technical performance and the integrity and character of historic buildings that clay plasters and renders are respected, preserved appropriately and repaired where necessary with authentic materials. Nowadays, clay plasters are often ignored in the repair and conservation of historic buildings. It could be due to the complex qualities of clay plaster since clay plasters are not primitive materials, even if they are not synthetic or a result of high energy processes. Historically clay plaster has proved to be durable and has performed very effectively. The goal of restoration and conservation projects should include the preservation of the original structure of the building and the integration of traditional materials into modern materials systems. [20] [23] [24] [30] It is important to achieve a balance between the historical practice and current technology. Clay plaster, as a viable and high quality material, should be included in the preservation works of historical buildings as well as used within modern building contexts. Scientific research has shown that clay plaster provides a healthy and highly environmental alternative to conventional plasters. [24] 24
26 3.3 Properties of clay plaster Composition All plasters contain a structural component, a binding agent and some form of fibres. Clay plasters mainly consist of sand and silt with only as much clay as necessary (usually between 5 to 12%) for developing their adhesive and binding forces. Sand and silt provide structure and strength in plaster. [24] Engineering science defines the composition particles according to diameter: particles with diameters smaller than mm are termed clay, those between and 0.06 mm are called silt, and particles with a diameter between 0.06 and 2 mm are called sand. [20] It is difficult to state what the proportions of an ideal clay plaster should be, because not only does the proportion of clay, silt and sand influence the properties. But also the grain size distribution of the sand fraction itself, the water content, the type of clay, the method of preparation and the additives. However, depending on the composition of the material originally excavated, various natural fibres and sands can be added to create a clay plaster with the desired physical properties. [20] [30] Clay Clay is a fine-grained natural rock or soil material that mainly consists of clay minerals which belong chemically to the group of hydro aluminosilicate. There are various types of clay mineral formed from combinations of stacked crystalline sheets of silica and alumina. The general formula is given: m Al n SiO 2 p H 2 0. [21] The composition and varying properties of clay depend on local conditions. However, the most common minerals in clay are Kaolinite, Montmorillonite and Illite. These have very different qualities due to the different arrangement of the stacked sheets and the different strength of the bond between the sheets. Kaolinite has the strongest bonds of hydrogen and forms the most stable, least shrinkable clay, but it has weaker binding qualities and it is less hygroscopic. Montmorillonite forms weaker bonds between its sheets. These clays therefore have better binding qualities, exhibit considerable shrinkage and swelling and can absorb more water both through capillary and hygroscopic actions. The characteristics of Illite fall somewhere between these two. [24] 25
27 Clay minerals are also found mixed with other chemical compounds, particularly with hydrated iron oxide (Fe2O3 H2O) and other iron compounds, giving the clay a characteristic yellow or red colour. Manganese compounds impart a brown colour but lime and magnesium compounds give white colour. [20] In a plaster, clay is cohesive and develops the adhesive and binding forces to the sand and the straw, holding the mixture together. It also secures the mixture of plaster to the wall Sand Sand consists of tiny mineral granules of rock predominantly composed of silicone dioxide, usually in form of quartz. It is defined by size, being finer than gravel and coarser than silt. Sand is water insoluble and chemically non-reactive substance. It varies in colour and grain size. Grains of sand also vary in shape. They are formed either from eroding stones, in which case they have sharp corners, or by the movement of water, in which case they are rounded. In addition, sand varies in hardness. For example quartz sands are very hard. [20] [23] Sand in plaster should be sharp and angular. Particle size diversity is important to create good structure, and to reduce the amount of binder needed. Sand should have a continuous granulometric curve, with both thin and thick grains. Sand must be totally clean from organic materials, humus, clay and salts as it fills the voids in place of the binder, resulting in weak plasters. [36] In a clay plaster, sand provides structure, strength and bulk. Sand particles are bound together by clay. Clay is rather pliable when it is wet. Sand, on the other hand, is geometrically stable. Therefore, sand transfers this property to a clay plaster. Combined they make a strong and stable material. Sand provides other benefits as well. It does not expand or contract when it is wet, as clay does. This helps to prevent plaster from cracking. [23] Fibres When clay dries it shrinks and tends to crack. Therefore, the purpose of adding fibres in a plaster is to resist tensile stresses within the surface of the plaster. Fibres form a 26
28 reinforcing meshwork in plasters. Generally some fibres are added to the plaster in order to prevent cracking while the plaster is drying as well as in situations of minor and gradual movement. This is a significant quality concerning old buildings. [24] Both the integration of fibre particles into the mix and the crack resistance of the plaster are improved by including natural fibres with a large range of lengths. Variations in the length of fibres create a stronger material. As a result the reinforcement fabrics help to reduce the degree of cracking to a tolerable level. [20] [23] [30] However, reinforcement fabric does not help the plaster to adhere to the substrate. Therefore, too much of these additives reduce the ability of the plaster to adhere to the substrate. Also the resistance to abrasion decreases when more particles are added. [20] [23] There are various fibres which can be used in plasters. Dry straw, flax, hemp, cow dung, sawdust and wool are all suitable. Straw is the most commonly used fibre because it is widely available, easy to work with, effective and relatively inexpensive. [23] However, recent research has identified a promising connection between the reinforcement of clay for internal wall plastering with fibres from the wetland plant Typha latifolia (cattail). The cattail seed fibres build a strong network by interlacing themselves and it remains stable. Compared to alternative fibres the positive quality of cattail is its near-invisibility when mixed into clay plasters. [30] Water Water activates the binding forces of clay. Clay in a plastic state contains of three different types of water: free water, pore water and a water of crystallisation. [20] The free water contributes to the plasticity of clay plaster. If dry clay gets wet, the water creeps in between the structure of lamellas, surrounding the lamellas with a thin film of water. Swelling occurs if clay comes into direct contact with so much water that it loses its solid state and changes to a plastic state. The amount of free water in a formable mass is usually in range of % depending on the grain size the coarser is clay, the less water it binds. While plaster is set to dry the free water is released. This acquires 27
29 compressive and tensile strength but also causes shrinkage. A clay mass comprises also a pore water. The amount of water is ranging between 1-12% in clay. [20] [21] Water of crystallisation is chemically bond which appears theoretically in an amount of 14 %. This water is released while firing clay in temperature range of C. The release from the chemically bound water is determined as a process of dehydration. [21] Clay plasters distinguish themselves from other plasters as they harden by drying. For cement, gypsum and to some extent hydraulic limes, the process of curing is through a hydraulic reaction between the binders and water. Clay plasters become solid as the water added during mixing is lost and electrically charged surfaces of the clay particles move closer together. Thereby, it can be re-worked by the addition of water at any time since no chemical reaction takes place. [24] Behaviour in fire During the heating process the free water as well as the pore water of clay are released when the mixture is heated at around 100 C. This is the highest temperature for drying clay because in higher temperatures it will lose its plasticity. Under fire conditions a partial melting of clay minerals is taking place. As a result the particles of clay adhere to one another. [20] [21] Water of crystallisation is chemically bound and is only distinguishable if the clay is heated to temperatures between 450 C and 700 C. After all chemically bound water is distinguished; the material is not defined as clay anymore but ceramics. This is because clay has the ability to withstand high temperatures without a significant softening point and deformation. When exposed to fire, its structure does not disintegrate but actually becomes harder by forming ceramic structures. [20] [21] The reaction to fire of clays depends on the mineral composition of clays, particle disperses degree of chemical impurities and the relationships between the various components [33]. Clay plaster is usually classified to Euroclass A1. In the German standard DIN 4102 (Part1, 1977) loam, even with some straw content, is non-combustible if the density is not less than 1700 kg/m³ [20]. [7] 28
30 3.4 Substrate for plastering As clay plaster does not chemically react with the substrate, the surface has to be sufficiently rough in order to develop a good physical bond. If the surface is rough enough, then clay plasters stick well to surfaces made of brick, concrete, stone and timber. In order to ensure that the plaster adheres well, plaster supports are applied in the form of reed mat, reed board, a plastic or galvanised wire mesh. [20] Historically, timber lathing has been widely used. Nowadays, one of the most traditional and natural material to use for a lathing is a reed mat. Reed is a healthy and breathing material that can be processed with a low CO2 emission. It is made from natural reeds laid parallel and bound using zinc-plated narrow gauge wire to form a long sheet. Thin reed mat is installed under plaster both on walls and ceilings. It prevents plaster from cracking and is easy to install. Plaster dries well on it as the reed straw is hollow in the inside ensuring good ventilation. [34] In order to receive thermal and sound insulation, reed boards can be used. The reed straws are pressed together tightly and bound to a strong panel with a zinc wire. The thickness of boards is usually 25 or 50 mm. [34] 29
31 3.5 Preparation and application of clay plaster According to the manufacturer's instructions a specified amount of water is added to the dry plaster. This is done in order to sufficiently activate the adhesive forces of clay minerals. It is important not to over wet the plaster because too much water will increase the shrinkage on drying. [20] [24] The mixing of components is done by using a plasterer s wheel or drill attachment to ensure even mixing. The consistency should resemble conventional plasters. When the plaster sticks to a sliding metal trowel held vertically, yet is easily flicked away, the correct consistency has been achieved. [20] [43] Clay plasters can be applied in all locations internally and externally without protection except where they are subject to direct water. In case of occasional water, a coat of a reasonable vapour permeable material is usually sufficient. [24] Natural clay plaster can be applied using tools and techniques common to conventional plasters. Surfaces to be plastered should be stable, dust-free and lightly dampened before applying plaster. While a reed mat is used as a key, they should not be pre-wetted. [43] The plaster can be applied by hand or by spray application. The plaster should be thrown with heavy impact on the surface so that it permeates the outer layers of the ground and also achieves a higher binding force due to the impact. If the plaster has to be more than mm thick, it should be applied in two or even three layers in order to avoid shrinkage cracks. Subsequent layers can be applied as the previous layer is firm. [20] Drying times vary considerably with the ambient conditions, applied thickness and the suction of the background. In ideal conditions, a 15mm thick undercoat will be dry after 3-4 days. In order to encourage controlled drying, plastered areas need to be well ventilated. [43] [20] The working time for natural clay plaster is longer than for other plasters, which means the surface will not "set" before the suitable finish has achieved. Dry clay plaster surfaces can easily be repaired by smoothing the surface by wetting and can be worked with a brush or felt trowel. It is because of the reversibility of this material. [26] 30
32 4 Experimental study 4.1 Limitations There is no product standard at European level concerning clay plasters. Therefore, in order to receive a comprehensive overview about the protective effect of clay plaster, different clay and sand ratios of plaster with a constant percentage of straw fibres were used. This study concentrated only on the basecoat of clay plaster. The consistent of clay plaster was clay, coarse sand with a grain size of 0-4 mm and straw fibres. No fine coats or finishes were used. The different thicknesses of clay plaster were chosen in the range of practical use in buildings. A reed mat as a plaster support on the timber member was used. The layers of plaster were mechanically applied to the surface by a trowel according to the general requirements of plastering. No special investigations were made concerning the influence of density of the plaster. 31
33 4.2 Previous studies investigated in small-scale tests Charring of protected wood studs The charring of wood studs which were unprotected and protected with plasterboards on exposed sides was studied by L.D. Tsantaridis and B. Östman in 1998 [10]. The aim of this study was to develop a simple technique to measure temperature profiles for the charring of protected wood studs in the cone calorimeter that provides a simulation of full-scale furnace tests for fire resistance. This study was conducted because of a large number of combinations of building products included in wood frame structures make the full-scale tests too complicated, time-consuming and expensive as a tool for the verification of fire resistance of various combinations. [16] A cone calorimeter was used at constant heat flux 50 kw/m² to determine the start time of wood of charring and the charring rates. The heat flux 50 kw/m² was chosen since it causes about the same charring rates as those found in several earlier studies. [16] The main results and conclusions were that a small-scale technique forms a supplementary and simpler alternative to determine the duration of fire protection boards. Charring depths obtained in the cone calorimeter at 50 kw/ m² agreed well with those obtained in full-scale furnace during the first min. It was considered that this technique can also be used to verify heat transfer models. [16] Charring behaviour of cross laminated timber Nowadays, cross-laminated timber (CLT) panels are becoming widely used in timber buildings due to its various advantages as a massive construction system. The fire resistance of CLT panels depends upon several parameters resulting in a large number of possible combinations of CLT products. [19] EN [4] does not provide specific information about the fire design of CLT panels but the full-scale testing is an overly complex and expensive tool in order to examine different combinations and properties of CLT products. Therefore, a study was made by M. Tiso [19] to compare the charring behaviour of CLT specimens determined by different tests. The aim of the study was to verify that the results received from the cone calorimeter tests, the model scale furnace test and the large scale test agree. In 32
34 addition the purpose was to learn if it is possible to achieve reliable results regarding the fire safety design of timber elements only with the cone calorimeter tests. [19] The tests consisted of CLT specimens and massive timber exposed to constant heat fluxes of 50 kw/m and was raised to 75 kw/m² in order to simulate the higher temperatures of the standard fire curve. Some specimens were exposed with different types of protection materials (gypsum plasterboard Type F and plywood). [19] After comparing the results of charring between the cone calorimeter tests and the furnace tests it is concluded that the first 10 minutes from the start time of charring, the charring of timber occurs sooner in the cone calorimeter than in the furnace tests. While a protection layer of gypsum plasterboard was used, the charring obtained with a cone calorimeter was very close to the charring obtained with the furnace test around 60 minutes of fire exposure. [19] The obtained results about the start time of charring of timber from the cone calorimeter tests and the furnace tests as well as some analytical results made by M. Tiso agreed well. It was indicated that the results of charring from the cone calorimeter tests are overestimated compared to the furnace test results during the fire exposure around minutes. After examining the results, the cone calorimeter tests proved to show reliable results but due to the overestimated results of charring further investigations are necessary. [19] The estimation of the fire protection ability of plaster Since there is very limited information about the fire tests concerning plaster, a study by J. Schmid [18] was closely examined. The following study was made in 2014 at SP Technical Research Institute of Sweden in Stockholm. It concerned the estimation of the fire protection ability of plaster in a historic building. [18] The tested specimens were brought from the construction site and consisted of a top-layer of plaster with thickness varying from 21 to 25 mm. The specimens also included an unknown surface finish (web, filler, paint) and lathing [18]. Since the composition of the plaster was unknown it could only be assumed by visual observation that it was a lime plaster. 33
35 The experimental set-up was chosen according to the previous research performed at SP using the cone calorimeter [16]. The tested timber members had a width of 45 mm and were insulated from the sides while they were tested in the cone calorimeter. [18] Two separate tests were conducted. Three specimens were tested 60 minutes with the constant heat flux of 50 kw/m. During the second series of tests the heat flux was increased to 75 kw/m² in order to simulate the higher temperatures of a standard fire after about 30 minutes. [18] After analysing the test results some recommendations for calculations according to EN were given. Since it was difficult to estimate the plaster density, the determined linear equation was given for the start time of charring : where: is the start time of charring (min). is the thickness of the panel (mm). Due to the chosen cross-section of timber member with a width of 45 mm, the twodimensional charring was considered. The two-dimensional charring rate were estimates for the test series as 0,37 mm/min and 0,52 mm/min, respectively. The charring rate of the second series of tests was modified to one-dimensional charring rate considering a factor ks=1,3. As a result, a charring rate of 0,40 mm/min was recommended to use as long as the protection stays in place. [18] No general conclusion can be made from this study because the composition of plaster and its top layer were unknown. The top layer could probably have a significant influence on the fire protection properties. Thereby, the recommended equations by J. Schmid cannot be used for every plaster cladding and no generalizations can be made based on this study. This study by J. Schmid is not compared to the experimental study conducted by this thesis author because of the large amount of unknown properties of the tested historical plaster by J. Schmid. 34
36 4.3 Tests of the present study General The main purpose of this study was to determine the start time of charring and the charring rate of timber members under the protection layer of clay plaster. The testing was conducted with a small-scale instrument chosen according to the previous researches performed at SP Wood Technology [16] [18] [19]. Three different ratios of components of clay plaster were tested with plaster thicknesses of 10, 20, 30 and 40 mm. The testing comprised double-testing for each unique specimen. Additionally, a gypsum plasterboard with a thickness of 15 mm in order to compare the results and make more appropriate conclusions. A total of 24 specimens covered with clay plaster and 1 specimen with a gypsum plasterboard were tested. All the required materials used for the preparation of the specimens were manufactured in Southern Estonia. Components of clay plaster were carefully processed considering the required properties. Considering the characteristics, installation method and different ratios of components of clay plaster, the specimens were hand made by a professional craftsmen in Estonia. General rules of the process of application techniques were followed. Prepared specimens were transported to Sweden and conditioned minimum two weeks before the testing in a controlled climate chamber. Tests were performed at SP Technical Research Institute of Sweden in Stockholm during November The test results are given in Chapter 4.4 and analysis in Chapter 4.5. A comparison of test results is made between the timber specimens with clay plaster and the timber specimen with a gypsum plasterboard, Type F including equations given in EN
37 4.3.2 Test method In order to determine the temperature measurements and charring of timber specimens a cone calorimeter (ISO 5660) was used. Cone calorimeter is a small-scale instrument that was originally developed as a tool for measuring heat release from building materials in order to estimate their contribution to a room fire. Nowadays, cone calorimeter is also used to measure ignition time and smoke production of building products but these parameters are not tested in this study. Previous studies have shown that cone calorimeter is also a dependable instrument to determine the properties of charring of timber members [16] [17] [19]. [7] The duration of each test was 60 minutes. Heat flux according to the standard temperature-time fire exposure (ISO 834) was used during the most relevant time period to determine the start time of charring and the charring rate. The start of charring was measured by thermocouples which were inserted on top of the timber surface below clay plaster. The charring rate was analysed by removing the charcoal from the timber member and measuring the residual height Cone Calorimeter The equipment comprises a weighting system, a cone heater and a system for collecting the combustion products. The cone shaped heater is capable of providing heat fluxes to the specimen in the range of kw/m². The upper and lower diameters of the cone heater are 80 and 177 mm, respectively. Plan view of the cone calorimeter is shown in Figure 4.1. All combustion products are collected in a hood. The hood is formed as a square (with 400 mm in side and 140 mm height). The circular exhaust duct has an inner diameter of 110 mm and is connected to exhaust system. [15] In this study the combustion products are not measured. The species which are tested with the cone calorimeter should be no greater than a surface area of a square of 100x100 mm. The specimen is exposed to the radiant heat flux of an electric heater. The heater is in the horizontal orientation with the specimen 25 mm underneath the base plate. [15] 36
38 The power supply is controlled by an electronic temperature controller using a chromel - alumel thermocouple of type K. The data about the temperature measurements during the fire test are saved to the computer and later analyzed. [15] Figure 4.1 Schematic set-up of the cone calorimeter used at SP. The heat flux is measured 25 mm underneath the base plate of the cone heater.[15] 37
39 4.3.3 Test specimens Timber members The dimensions of each timber member were 100 mm x 100 mm x 100 mm. These specific measures were chosen by different considered aspects. In order to fit the exposed size in the cone calorimeter, the exposed surface area was required to be 100 mm x 100 mm. The depth of 100 mm of the specimen was considered to present more adequate results concerning one-dimensional charring of timber as well as the behaviour of protected timber was not foreseen during 60 minutes under the condition of fire exposure. Every timber member was weighted before the installation of other components as well as the density of timber members was calculated, see Table 4.1. Table 4.1 Weight and density values of the timber members. Test Number Test specimen Specimen Number Weight of timber member Timber Density of timber member [ g ] [kg/m³ ] A B A B A B A B A B A B A B A B A B A B A B A B

40 Installation of thermocouples After the timber members were sawn out, thermocouples were located on the exposed side in the centre and on the top surface of the timber members. Thermocouples type K with a diameter of 0,25 mm were used. The wire was produced by Pentronic AB, Sweden. It was calibrated by the producer and it showed at 300ºC a correction of +0,5ºC and a tolerance ±0,2 ºC. Thermocouples were fixed to the timber surface with metal staples to ensure that they remain at that position, see Figure 4.2. Figure 4.2 Positioning of the thermocouples in the centre and on top on the timber member Substrate for plastering After positioning of the thermocouples, a reed mat was fixed on top of the timber surface. At this study the lathing was laid parallel on the timber members and every single reed was fixed with staples, see Figure 4.3. This one by one fixing was necessary in order to ensure the positioning of reeds while plastering the substrate. The distance between the reeds was about 10 mm to simulate the original positioning of reeds in a reed mat unit. In practice, the reeds are not fixed one by one with staples but they are bound together with a stainless narrow gauge wire which is fixed to the surface area instead. However, for the small-scale test it was not sufficient because the surface area of timber specimen was too small for the installation of a unit of reed mat with the wire. However, in this study the 39


41 fixing of the reeds was not significantly important aspect because the cone calorimeter tests were carried out at horizontal orientation and no failure time could be measured. Figure 4.3 Positioning of the thermocouples and reeds on top of the timber member Clay plaster Clay plaster tested in this study was tested only as a basecoat material with a grain size of 0-4 mm. Clay plaster consisted of the main components: clay, coarse sand and straw fibres. The selected ratios of components of plaster is specified in Table 4.2. Table 4.2 Different ratios of clay plaster for the tests. Ratio number Ratio of components of clay plaster clay sand fibers I 1 2 0,5 II 1 3 0,5 III 1 4,5 0,5 Variants A B A B A B Clay had been extracted from the Southern part of Estonia, Põlva County, Joosu quarry [44]. The mineral composition of the Joosu quarry s clay is specified in Table 4.3. The melting point for clay extracted from Joosu quarry is degrees. [45] 40
42 Table 4.3 The mineral composition of Joosu quarry s clay [29]. The added fraction of coarse sand was 0-4 mm. The sand was coarse, angular and consisted of different sizes of grains equally distributed forming a continuous granulometric curve. A constant amount of traditional straw fibres was added. Water was added in respect to an amount of 4,5-6 l / 25 kg. Four different plaster thicknesses of 10, 20, 30 and 40 mm were applied to the specimens, respectively. Wood-based edge fixers were used to receive accurate thicknesses for the test specimens while plastering the species, see Figure 4.4. The edge fixers were taken off before the testing. The mineral composition Weight procent Quartz 45.2 Feldspar 4.2 Plagioclase 3.0 Illite-Smectite 10.9 Illite/Mica 9.1 Kaolinite 26.6 Hematite, Pyrite 2.1 Anataas 0.6 The layers of plaster were mechanically applied to the surface by a trowel according to the general requirements of plastering. A thickness of 10 mm was applied at once. Subsequent layers were applied after the former applied layer was dry. The preparation times of different plaster thicknesses applied by the craftsman are presented in Table 4.4. Table 4.4 Dates of installation of the layers of plaster. Ratio number Ratio of components of clay plaster clay sand fibers I 1 2 0,5 II 1 3 0,5 III 1 4,5 0,5 Variants A B A B A B Thickness of clay plaster [mm] [ Date of preparation of the layer]


43 Figure 4.4 Installing the edge fixers and plastering the specimens Prepared specimens A total of 24 specimens covered with clay plaster were prepared in Estonia, see Figure 4.5. Table 4.5 illustrates all numbered timber specimens with clay plaster tested at this study. The numbering system for the specimens is explained in Figure 4.6 to provide a better overview of the tested specimens in the following Chapters. Additionally, a specimen with gypsum plasterboard Type F with a thickness of 15 mm was tested as a reference. Figure 4.5 Schematic about the prepared specimens with plaster. 42
44 Table 4.5 Prepared specimens for the tests. Ratio number Ratio of components of clay plaster clay sand fibers I 1 2 0,5 II 1 3 0,5 III 1 4,5 0,5 Variants Thickness of clay plaster [mm] [ specimen number] A B A B A B Figure 4.6 Explanation of the numbering system for the specimens. 43
45 4.3.4 Test set-up and procedure Preparation of specimens for the test All prepared specimens were transported to Sweden. The testing was carried out at SP Wood Technology in Stockholm. The specimens were maintained in a climate chamber at 20 C and 65% RH minimum two weeks before the testing. Every specimen was taken out of the chamber on the same day it was going to be tested in order to have the equal properties and conditions considering the hygroscopic characteristics of clay plaster. All specimens were weighted, measured and documented before the tests. Weight and density values of the components of specimens are described in Table 4.7. Densities of plaster were calculated without the volume of reeds. Figure 4.7 illustrates the measuring of the specimens before the testing. Control weighing was made for randomly selected timber specimens, see Table 4.6. These specimens were not tested but followed all the procedures with the tested specimens. The objective was to verify the weighing values of timber members received during the preparation of the specimens, see Chapter The results of control weighing show a minimal difference. This difference can be neglected. Table 4.6 Control weighing of timber specimens. Specimen Number Volume of timber specimen During the preparation Weight of Specimen After climate chamber Difference of weight [cm³] [ g ] [ g ] % 5.1 A B C All tests were conducted with a use of a retainer frame. The retainer frame was used to reduce the unrepresentative edge burning of specimens. The edges of the frame reduce the actual exposed area from 0,1 x 0,1 m to 0,094 x 0,094 m. As a result the exposed area is 0,0088 m² instead of 0,01 m², see Figure 4.11.[15] Test specimen was first wrapped in a self-adhesive aluminium tape to prevent the air flow in and through the straws, see Figure 4.8. Figure 4.8 illustrates the schematic of the test specimen before placing it to the retainer frame. 44
46 The foil-wrapped specimen was inserted into the retainer frame with the exposed surface facing down. In order to fix the specimen in the frame, layers of refractory fibre blanket were put into the frame and the sampler holder was fit into the frame on top of the refractory fibre and pressed down. Thereafter, the retainer frame was secured to the sampler holder. [15] Test No Ratio No Table 4.7 Weight and density values of test specimens. Test Specimen Timber Plaster and Reed Mat Specimen Number Weight of Specimen Weight of Timber Member Density of Timber Member Plaster thickness Total Volume Volume of Reeds Volume of Plaster Weight of Plaster Density of Plaster [ g ] [ g ] [kg/m³ ] [mm] [ cm³ ] [ cm³ ] [ cm³ ] [ g ] [kg/m³ ] A I B A II B A III B A I B A II B A III B A I B A II B A III B A I B A II B A III B


47 Figure 4.7 Documentation of the specimen before the test. 46

48 Figure 4.8 The schematic of the test specimen before placing it to the retainer frame. Figure 4.9 Necessary equipment for the test. 47
49 Heat Flux [kw/m²] Temperature [ºC] Calibration of cone calorimeter In order to receive reliable test result the heat flux calibration was to be repeated every testing day due to an ageing of the heater coil. The calibration consisted of measuring an electrical potential from the heat flux meter and its correlation with the heat flux. The electronic temperature control system was adjusted so that the conical heater produces the required heat flux to within ± 2 % as measured by the heat flux meter. Two heat flux values of 50 and 75 kw/ m² were measured by an analogical voltmeter with the precision of 0,1 mv because these values roughly follow the ISO 834 heat flux curve. ISO 834 heat flux curve is the heat flux value measured during ISO 834 standard temperature-time fire test in a furnace without any specimen inside [17]. [15] Figure 4.10 illustrates the ISO 834 heat flux curve according to the ISO 834 temperaturetime curve as well as the heat flux curve measured during the calibration of the cone calorimeter at this study Heat flux at this study 200 ISO 834 heat flux 100 ISO 834 temperature t [min] Figure 4.10 ISO 834 heat flux curve according to the ISO 834 temperature-time curve and the heat flux curve measured during the calibration of the cone calorimeter. 48

50 Testing procedure The fire tests were conducted in a time period of 60 minutes. Temperatures were recorded every 5 seconds to determine the start of charring. Observations were made during the whole procedure to analyse the behaviour of plaster in fire. The following procedure was used for all the performed tests: 1. As the test specimen was fixed inside the retainer frame, the whole assembly was then balanced and placed underneath the cone heater, see Figure Figure 4.11 Fixed specimen and its position under the cone heater. 2. Thermocouples were connected to the device for saving data. 3. The specimen was exposed to the constant heat flux at 50 kw/ m² during the first 20 minutes. 4. After 20 minutes the heat flux value was raised according to ISO 834 heat flux. 5. The heat flux value was raised in 3 equal steps during 10 minutes, see Figure After 30 minutes the heat flux was raised to 75 kw/ m² and was kept constant until the testing period of 60 minutes. 7. After 60 minutes the specimen holder was removed from the cone calorimeter. 8. The specimen was cooled down under cold water and the retainer frame was removed. 9. Specimen was set to dry and was measured and photographed, see Figure
51 10. As clay plaster hardens in high temperatures, it was easily removed from the top of the timber member. See Figure After the removal of charcoal the residual cross section of timber member was measured and evaluated. 50
52 Temperature t [ C] 4.4 Test results All 24 specimens with clay plaster were tested. In addition, one test was made with a timber specimen covered with a gypsum plasterboard. The duration of every test was 60 minutes. Test specimens are specified in Table 4.5. Test results are presented as follows Temperature measurements Temperature measurements of different thicknesses and ratios of components of plaster are shown in Figure 4.12 to Figure Each Figure shows the temperature measurements under plaster based on the specific thickness of plaster. Each Figure comprises timber specimens covered with three different ratios of plaster. Every ratio of plaster has a duplicate test A and B. The specific ratios of components of plaster are specified in Chapter The temperature curves are presented in monochrome colours in order to highlight the variation of different ratios of plaster. Lighter colour refers to a greater ratio A B A B A B Time t [min] Figure 4.12 Temperature rise behind 10 mm plaster layer. Ratio I, II, III. 51
53 Temperature t [ C] Temperature t [ C] A B A B A B Time t [min] Figure 4.13 Temperature rise behind 20 mm plaster layer. Ratio I, II, III A B A B A B Time t [min] Figure 4.14 Temperature rise behind 30 mm plaster layer. Ratio I, II, III. 52
54 Temperature t [ C] Temperature t [ C] A B A B A B Time t [min] Figure 4.15 Temperature rise behind 40 mm plaster layer. Ratio I, II, III. An additional test was conducted with a gypsum plasterboard Type F with a thickness of 15 mm, see Figure The temperature rise was recorded on the surface of the timber specimen under the gypsum plasterboard Gypsum plasterboard Type F 15 mm (Liblik 2014) Time t [min] Figure 4.16 Temperature rise behind a gypsum plasterboard tested at this study. 53

55 4.4.2 Observations Visual observations were made for all the specimens during the test of 60 minutes. The surface area of clay plaster did not show any significant change during the test period. Irrespectively, the surfaces of all the specimens showed no cracks or any other transformation. No ignition of clay plaster occurred. Ignition of the timber members if occurred only started from the corners or edges of the specimens. Ignition occurred in majority of the timber members with plaster thicknesses of 10 to 30 mm, see Figure Specimens with the plaster thickness of 40 mm hardly showed any ignition during the whole test period. During the test and the process of cooling down there were no unpleasant odours from clay plaster. Since the plaster hardly cracked after the cooling process, it was removed from the timber member easily in one piece, see Figure Cracking of the plaster occurred only to few specimens with a plaster thickness of 10 mm. The reeds were carbonized but in some cases the metal staples were still anchored to the timber members which held the plaster fixed to the timber. Figure 4.17 Documentation of the specimen during the test. 54

56 4.4.3 Documentation of specimens The specimens were documented after the test by photos, see Figure 4.18 and Figure Documentation of the specimens with different thicknesses of plaster is specified in Annex A. Every specimen was photographed and measured after the specimens were cooled down and removed from the retainer frame.. Figure 4.18 Documentation of specimen after cooling down. 55

57 Figure 4.19 Removed plaster coat from the timber member after cooling down. Tested specimens retained their shape after the process of cooling. Due to the characteristics of clay plaster, it hardens while it is exposed to higher temperatures. As a result, the plaster coat will not lose its form or crack. Thereby, the plaster coat was not significantly affected by water while cooling the specimens. Figure 4.19 illustrates the removed unit of plaster which is placed unexposed side up in order to have the visual of reeds recorded. However, a few plaster coats with a thickness of 10 mm did show some cracking and broke after its removal from the timber member. 56
58 4.5 Analysis and discussion Temperature measurements The temperature measurements indicate that the behaviour of protected timber specimens is not significantly influenced by the different ratios of components of plaster. The comparison of different temperature curves show that the most important factor is the thickness of plaster. While a specific thickness of plaster is under investigation there is a good correlation of temperature curves. This phenomenon is explainable by the good repeatability of double tests (A and B) for each ratio of plaster (Ratio I, II, III) and also because of the minimal influence of the different ratios of plaster. Due to the good repeatability of double tests, the following analysis presents the mean results of double tests for each ratio of plaster. The temperature curves of the different ratios of plaster are presented for each tested thickness of plaster shown in Figure 4.20 to Figure 4.23, respectively. The temperature curves of different ratios of components of plaster are determined as Ratio I, II, III, respectively. However, there is no significant difference in results between the tested ratios of plaster, a slight difference can be pointed out. The temperature curves indicate that the plaster with a ratio I showed generally lower temperature measurements comparing to other ratios of plaster. Since the plaster with a ratio I comprises a clay/sand ratio of 1:2, a conservative conclusion can be made. The more sand is added to the plaster, the higher temperatures are received under the plaster. Although in practice, this ratio of clay and sand is not widely used because of the poor properties of plaster. According to the temperature measurements, the plaster thickness increases the time to reach 300 C considerably. For the specimens with a plaster thickness of 10 and 20 mm the temperature curves hardly have a plateau at 100 C due to the rapid evaporation of the moisture content. However, the plateau is clearly recognized in case of plaster with a thickness of 30 and 40 mm. The maximum temperatures measured on the surface of timber members after 60 minutes of testing were received within 400 C and 700 C degrees. The difference between the maximum temperature measurements is explicable by the different thicknesses of plaster, respectively. 57
59 Temperature t [ C] Temperature t [ C] Ratio I Ratio II Ratio III Time t [min] Figure 4.20 Mean temperature rise behind 10 mm plaster layer. Ratio I, II, III Ratio I Ratio II Ratio III Time t [min] Figure 4.21 Mean temperature rise behind 20 mm plaster layer. Ratio I, II, III. 58
60 Temperature t [ C] Temperature t [ C] Ratio I Ratio II Ratio III Time t [min] Figure 4.22 Mean temperature rise behind 30 mm plaster layer. Ratio I, II, III Ratio I Ratio II Ratio III Time t [min] Figure 4.23 Mean temperature rise behind 40 mm plaster layer. Ratio I, II, III. 59
61 Temperature t [ºC] Figure 4.20 to Figure 4.23 show that the temperature curves of a certain thickness have a smooth rise and the variations from the curve line are rare. However, the temperature curves based on a 10 mm thickness of plaster indicate slight shifting of temperature rise in three steps during the time period of minutes. The high temperatures behind the thin plaster layer indicate poor insulation properties. The temperature curves can be also influenced by other minor factors. The small differences in temperature curves caused by the different ratios of components plaster could be only one aspect to consider, since the temperature measurements of the different ratios of plaster are in a strong correlation. Several other aspects should also be considered such as the density of plaster, positioning of the reeds, the preparation quality of the specimens, an inaccuracy of the cone calorimeter as well as a scatter in timber members density or the difference in fibre orientation of timber members. However, due to the strong correlation of temperature curves of a same thickness of plaster, the following Figure 4.24 is presented. Each temperature curve in Figure 4.24 presents a specific thickness of plaster and shows a mean temperature rise, respectively. The mean temperature rise for each thickness of plaster is based on the results from the previously showed Figures mm plaster 20mm plaster 30mm plaster 40mm plaster Time t [min] Figure 4.24 Comparison of mean temperature rise curves under different thicknesses of plaster. 60


62 4.5.2 Analysis of the residual cross-section In order to measure the residual cross-section, the timber specimens were sawn into two species along the centre line of the specimens. The cut species were measured and photographed. Figure 4.25 to Figure 4.26 present the documentation of the specimens. The cut species showed no significant corner roundings. A clear plateau line of charcoal was formed. The charring depth of timber specimens was determined on the interface of the charcoal and unaffected timber members. The accurate measuring was conducted after the removal of charcoal, see Annex B. The charring depth was measured from the same centre line where the temperature measurements were taken during the tests. Figure 4.25 Timber specimen after cut in half. Figure 4.26 Timber specimen after the removal of charcoal. 61


63 Figure 4.27 Documentation of residual cross-sections of timber member. 62


64 4.5.3 Recording of the plaster species The species of plaster were cut apart after the removal from the timber member. The cross-sections were documented. Since the purpose of the current study was not to inspect the physical transformation of the properties of clay plaster, only general observations were made. The documentation of different thickness of plaster species is illustrated in Figure The unaffected side of plaster was turned black in colour after the test. However, the affected side of plaster had maintained its original colour. This change in colour could be a result of the gases which generated from timber in high temperatures. The change in colour is also recognized in the sides of plaster. This is analogically explained by the greater vulnerability of the sides and corners of the test specimens. The transformation in colour was characteristic for all the species, no significant difference was detected between different ratios of components of plaster nor different thicknesses of plaster. Figure 4.28 Documentation of the cross-sections of plaster after tests. Plaster thicknesses mm. 63
65 Start of charring t ch [min] Start time of charring The temperature value of 300 C is taken as the position of the char-line and it is specified in EN [4]. For each test the times were pinpointed when the value of thermocouples reached 300 C. The detailed time values are presented in Table 4.8. The relationship between the start time of charring of protected timber specimens and different thicknesses of plaster are shown in Figure 4.29 to Figure Each Figure contains results based on a specific ratio of plaster, respectively. Previously discussed temperature measurements showed a good repeatability of the double test results. Accordingly, the start times of charring of timber specimens of the double tests also show rather similar results when a specific thickness is involved. The results of each ratio of plaster show a good linear regression, respectively. There is a good correlation between the trend lines of different ratios of plaster. Thereby, a total of 24 tested specimens are taken into consideration in order to generally characterise the start time of charring of timber under plaster. This is shown in Figure RATIO I t ch = 1,25h p - 10,33 R² = 0, Plaster thickness h p [mm] Figure 4.29 Relationship between the start time of charring of timber and thickness of plaster. Ratio I. 64
66 Start of charring t ch [min] Start of charring t ch [min] RATIO I I t ch = 1,17h p - 9,0 R² = 0, Plaster thickness h p [mm] Figure 4.30 Relationship between the start time of charring of timber and thickness of plaster. Ratio II RATIO I I I t ch = 1,16h p - 9,1 R² = 0, Plaster thickness h p [mm] Figure 4.31 Relationship between the start time of charring and the thickness of plaster. Ratio III. 65
67 Start of charring t ch [min] RATIO I - III t ch = 1,20h p - 9,5 R² = 0, Plaster thickness h p [mm] Figure 4.32 Relationship between start of charring and thickness of plaster concerning all 24 specimens. Ratio I,II,III. Table 4.8 Start times of charring of timber for all the tested specimens. Test Specimens Plaster thickness Start Time of Charring Test Ratio Specimen No Number Number [mm] [min] A 4.7 I B A 3.9 II B A 4.3 III B A 11.8 I B A 12.3 II B A 11.9 III B A 27.0 I B A 28.5 II B A 27.3 III B A 42.7 I B A 38.7 II B A 38.7 III B
68 When a specific thickness of plaster is investigated the test results show that there is no significant difference in time to reach temperature value of 300 C between the three different ratios of plaster. The test results show that the behaviour of timber members protected with plaster is significantly influenced by the different thicknesses of plaster. For the plaster thickness of 10 mm the average time for the start time of charring of timber was 4.1 minutes. The deviation of that value stays between ± 0.6 minutes. For the plaster thicknesses of 20 and 30 mm the average time for the start times of charring of timber were accordingly 11.8 and 26.4 minutes and the maximum deviations are correspondingly ±1.0 and 2.8 minutes. For the plaster thickness of 40 mm the average time for the start time of charring of timber was 39.1 minutes with a maximum deviation of 3.6 minutes. It is concluded that while the plaster thickness is increased the start time of charring of timber is delayed, respectively Influence of the density of plaster In this study the density of plaster was influenced by many aspects because of the variety of different ratios of plasters. It was difficult to predict the compatibility of the components on the reeds. Thereby, the density of plaster was not considered as one of the basic values. However, a comparison between the start times of charring of timber and the density of different tested plasters, see Figure The density values are presented by the different ratios of plaster. Most of the density values range in between kg/m³. One density value of over 2050 kg/m³ concerning Ratio III is most likely an error. Detailed values are shown in Table 4.9. Figure 4.33 confirms that the start time of charring of timber covered with plaster is not significantly influenced by the different ratios of plaster. The distribution of the density values with respect to the start time of charring clearly indicates to the different thicknesses of plaster. Therefore, a conservative conclusion could be drawn that the density of plaster does not significantly influence the behaviour of protected timber in fire. 67
69 Start of charring t ch [min] Ratio I Ratio II Ratio III Density of plaster ρ p [kg/m³] Figure 4.33 Relationship between the start time of charring of timber and the density values of plaster. Ratio I,II,III. The variation of densities could be explained by the mechanical compression of plaster during the application process. The application of several layers of plaster could probably result in more consistent outcome. Therefore, when the plaster is thicker, the density values are less dispersed. There could be an influence by the small surface of 100 x 100 mm which makes it more difficult to receive equivalent densities. In addition, a slight effect on the density values could also be caused by the positioning of reeds. 68
70 Test No Table 4.9 Test specimens. Values of the start time of charring and the density of plaster. Ratio No Test Specimen Plaster and Reed Mat Start Specimen Number Weight of Specimen Plaster thickness Total Volume Volume of Reeds Volume of Plaster Weight of Plaster Density of Plaster Time of Charring of Timber [ g ] [mm] [ cm³ ] [ cm³ ] [ cm³ ] [ g ] [kg/m³ ] [min] A I B A II B A III B A I B A II B A III B A I B A II B A III B A I B A II B A III B
71 Recommendation for calculations The following recommendation is based on this specific experimental study. The limitations for the clay plaster are closely explained in Chapter 4.1. Due to the different ratios of components of plaster the density of plaster was difficult to estimate and it was not taken as a basic value in this study. The analysis of test results showed that the plaster thickness has the most significant influence on the determination of the start time of charring of timber. Based on that knowledge, a linear equation it is recommended to be used: where is the start time of charring (min) is the thickness of the plaster (mm). 70
72 4.5.5 Charring rate In this study the charring rate for the timber members was calculated by the residual cross-section and the time range from the start time of charring until the 60 minutes of the test period. The charring depths and charring rates for the test specimens are given in Table Mean charring rates were calculated because of the good repeatability of the double tests. Furthermore, in order to highlight the different values of charring rates of the three ratios of components of plaster. The following graphics are based on the mean charring rates for each ratio of plaster, see Figure 4.34 to Figure The comparison of charring rates of timber between different ratios of plaster is illustrated in Figure Table 4.10 Calculated charring rates for the tested specimens. Test No Specimen No Plaster Thickness Start Time of Charring Charring Depth Charring Time Charring Rate Mean charring rate [mm] [min] [mm] [min] [mm/min] [mm/min] A B A B A B A B A B A B A B A B A B A B A B A B
73 Charring depth d 300 [mm] Charring depth d 300 [mm] RATIO I = 0, = 0,38 = 0,22 = 0,11 10 mm plaster 20 mm plaster 30 mm plaster 40 mm plaster Charring time t [min] Figure 4.34 Mean charring rates of timber under plaster. Ratio I RATIO I I = 0, = 0,39 = 0,20 = 0, Charring time t [min] 10 mm plaster 20 mm plaster 30 mm plaster 40 mm plaster Figure 4.35 Mean charring rates of timber under plaster. Ratio II. 72
74 Charring depth d 300 [mm] Charring depth d 300 [mm] RATIO I I I = 0, = 0,28 = 0,26 = 0, Charring time t [min] 10 mm plaster 20 mm plaster 30 mm plaster 40 mm plaster Figure 4.36 Mean charring rates of timber under plaster. Ratio III RATIO I - III Charring time t [min] 10 mm Ratio I 10 mm Ratio II 10 mm Ratio III 20 mm Ratio I 20 mm Ratio II 20 mm Ratio III 30 mm Ratio I 30 mm Ratio II 30 mm Ratio III 40 mm Ratio I 40 mm Ratio II 40 mm Ratio III Figure 4.37 Comparison of mean charring rates of timber under plaster. Ratio I, II,III. 73
75 Charring depth d 300 [mm] The charring rates of timber covered with plaster are highly influenced by the thickness of plaster. When the timber specimen is covered with a 10 mm thickness of plaster the charring rate stays in range of 0,39-0,45 mm/min, whereas a plaster thickness of 40 mm reduces the rate to 0,11-0,18 mm/min. Since the unprotected timber has a general charring rate of 0,65 mm/min, it can be stated based on this experimental study that plaster can have a considering effect of protecting timber from high temperatures. This understanding is valid as long as the plaster remains in contact with timber. While investigating the results of a specific thickness of plaster, the charring rates of timber under different ratios of plaster show good correlation. However, some values of charring rates are more dispersed compared to the others, see Figure This could be explained by minor influencing factors. For example the density of plaster, peculiarities of timber and the positioning of the reeds could add an influence to the result of the charring rate of timber. Nevertheless, since there are clearly recognizable trend lines for different thicknesses of plaster the following graphic is presented, see Figure This Figure gives a comprehensive overview and comprises all tested timber specimens covered with plaster CLAY PLASTER = 0, = 0,35 = 0,23 0,22 = 0,16 10 mm plaster 20 mm plaster 30 mm plaster 40 mm plaster Charring time t [min] Figure 4.38 Mean charring rates of timber under different thicknesses of plaster. 74
76 According to EN [4] a one-dimensional charring of unprotected timber member is determined 0,65 mm/min. While the charring of timber member has started but the fire protection layer still remains in contact with the timber member, a reduced charring rate is used. The reducted charring rate is calculated by a protection phase factor. This factor is specified for some materials in EN This was closely explained in Chapter 2.4. [4] Based on the analysis of this study, it can be concluded that the charring of timber occurs at a lower rate under plaster. The protection phase factors are calculated for every tested specimen, respectively. The calculation of the protection phase factor is based on the one-dimensional charring of 0,65 mm/min, see Table Table 4.11 Values of protection factor k for tested specimens. Test No Ratio No Specimen No Plaster thickness Charring rate Protection factor [mm] [mm/min] A I B A II B A III B A I B A II B A III B A I B A II B A III B A I B A II B A III B
77 According to the values of protection factors given in Table 4.11 a following Figure 4.39 is presented. Figure 4.39 illustrates the single protection factors of each tested specimen. It can be recognized that the results do not significantly disperse and there is a good linear regression. The presented formula in Figure 4.39 is given according to the mean values of protection factor of tested specimens. The maximum deviation of the single results from the trend line is about 0,11. This variation of protection factor is causing only a slight difference of 0,07 mm/min while calculating the charring rates, respectively. This small deviation does not signifantly influence the fire design of timber structures. Protection factor k CLAY PLASTER k 2 = h p R² = Thickness of plaster h p [mm] Figure 4.39 Relationship between the thickness of plaster and protection factor. 76
78 Recommendation for calculations The following recommendation is based on the present study of tested timber members protected with clay plaster. The results of the charring rates of timber members showed that there was no significant difference of the charring of timber while different ratios of plaster were involved. The recommended formula is based on the mean results of charring rates of timber members. The failure time of plaster was not possible to investigate in this study, but the following values are recommended to apply only as long as the plaster is ensured to be attached to timber. For the charring rates of the timber member covered with clay plaster according to this study is recommended to be multiplied by a factor : where =0,8 0,015 is the thickness of the clay plaster layer (mm) 77
79 Temperature t [ºC] Comparison to gypsum plasterboard Temperature measurements This comparison gives an overall understanding about the results of temperature measurement of this study and a perspective where the plaster stands considering the characteristics of widely used gypsum plasterboard given in EN [4]. The comparison of temperature measurements between the tested specimens with a clay plaster and a gypsum plasterboard is shown in Figure The temperature curves of plaster represent average measurements under different thicknesses of plaster. This was closely explained in Chapter There is a significant difference of temperature measurements between the plaster and the tested gypsum plasterboard. The temperature measurements on timber surface under the gypsum plasterboard are significantly lower compared to the protection layers of different thicknesses of plaster during the first 30 minutes. This is due to the large amount of water in gypsum plasterboard which is evaporating while the temperature of 100 C is reached mm plaster 20mm plaster mm plaster 40mm plaster Time t [min] Gypsum plasterboard Type F 15 mm (Liblik, 2014) Figure 4.40 Comparison of temperature measurements between different thicknesses of clay plaster and the tested gypsum plasterboard Type F with a thickness of 15 mm. 78
80 Start time of charring t ch [min] Start time of charring The comparison of the start time of charring of protected timber is made between the recommendation formula for clay plaster and the given expression of gypsum plasterboard according to the EN [4]. The comparison is present in Figure The expression for the calculation of the start time of charring considering gypsum plasterboards was closely explained in Chapter It can be concluded that the start time of charring of timber under gypsum plasterboards is significantly delayed compared to the protection layer of plaster. This is due to the different properties of the protection materials. The behaviour of gypsum plasterboard in higher temperatures was closely explained in the previous Chapter t ch = 2,8h p - 14 t ch = 1,2h p Layer thickness h p [mm] Clay Plaster (Liblik 2014) Gypsum Plasterboard, EN Figure 4.41 Comparison of the start time of charring of timber protected with different materials. 79
81 Charring rate A following comparison is made in order to demonstrate the different reduced charring rates for protected timber members from fire exposure. EN [4] gives the expression to calculate the reduced charring rate by multiplying the charring rate of an unprotected timber member to a protection factor. For a single layer of a gypsum plasterboard, Type F this factor is given in EN and is closely explained in Chapter Figure 4.42 shows the comparison of protection factors between the gypsum plasterboard and the recommended factor given for the clay plaster tested in this study. 1.0 Protection phase factor k k 2 = 1-0,018h p k 2 = 0.8-0,015h p Clay Plaster (Liblik 2014) Gypsum Plasterboard, EN Layer thickness h p [min] Figure 4.42 Comparison of protection factors between tested clay plaster and gypsum plasterboard EN A comparison of reduced charring rates is made between the tested timber specimens covered with plaster and the tested gypsum plasterboard, Type F with a thickness of 15 mm, see Figure Additionally, a comparison is made to the expression given in EN [4] for the gypsum plasterboard, Type F 15 mm. Figure 4.43 is presented in order to illustrate the comparison between different reduced charring rates for timber member. Although, the start time of charring of timber covered with a gypsum plasterboard is significantly delayed compared to the plastered specimens, 80
82 Charring depth d 300 [mm] the reduced charring rate of timber is quite high compared to the received charring rates of timber under plaster. The charring rate of timber covered with a plaster thickness of 10 mm is 0,43 mm/min while for the gypsum plasterboard it is 0,50 mm/min. The charring rates for the plaster thicknesses of 30 and 40 mm show significantly lower charring rates compared to the gypsum plasterboard, Type F mm plaster 25 = 0,43 20 mm plaster = 0,35 = 0,50 = 0,47 = 0,23 = 0, Charring time t [min] 30 mm plaster 40 mm plaster Gypsum Plasterboard Type F 15 mm (Liblik 2014) Gypsum Plasterboard, EN Figure 4.43 Comparison of reduced charring rates of protected timber members. 81
83 5 Recommendations for the fire design The following recommendations are based on the results of this study. The limitations of the tested clay plaster are closely explained in Chapter 4.1. Start time of charring In order to determine the start time of charring of timber protected with a clay plaster, a linear equation is recommended to be used: where is the start time of charring (min) is the thickness of the plaster (mm). Charring rate For the charring rates of the timber member covered with clay plaster is recommended to be multiplied by a factor : where = 0 is the thickness of the clay plaster layer (mm). 82
84 6 Further needs This present study is probably one of the first comprehensive researches about the behaviour of timber structures protected with clay plaster in fire. Therefore, in order to validate the results of these tests, further investigation is necessary. The given recommendations of formulas about the start time of charring and the charring rate behind the clay plaster are based only on the current study by the author. It can be expected that the given recommendations are conservative and need to be improved by further research. The properties of clay plaster should be standardised in order to fit the material in to the European system. To confirm the general conclusions made in this study, the main properties of plaster with regard to fire performance need to be verified in larger scale. Investigation of failure times with different substrates and fastening systems should be performed. Similar studies with clay plaster should be made with different components of clay and sand from other regions. Studies with lime plaster should be performed. Fire technical properties determined for plasters should lead to thermal modelling. 83
85 7 Summary This thesis investigated the properties of clay plaster for the fire design of timber structures in line with the design methods in EN [4]. This thesis was carried out in a close cooperation with manufacturers of clay plaster in Estonia. This was essential in order to specify the properties of clay plaster and to set the basic parameters to investigate. As a result, in view to receive a comprehensive overview of the properties of clay plaster under fire exposure, different ratios of components of clay plaster were tested. Clay plaster only as a basecoat was examined. The range of plaster thickness was chosen according to the practical use in buildings. A reed mat as a plaster support was used on the timber members. A total of 24 timber specimens covered with clay plaster were tested in small scale. In addition, one timber specimen with a gypsum plasterboard Type F with a thickness of 15 mm was tested as a reference. A cone calorimeter (ISO 5660) was used for testing in order to determine the behaviour of timber under the protection layer of plaster. The duration of every test was 60 minutes. A heat flux following the standard fire exposure (ISO 834) was used during the most relevant time period to determine the start time of charring and charring rate. These properties were measured by thermocouples and by analysing the residual cross-section. From the analysis of the test results, the following conclusions can be drawn for the fire behaviour of timber members protected with clay plaster: 1. The use of clay plaster as a protection layer on timber under fire exposure, increases the start time of charring and decreases the charring rate of timber members. 2. The thickness of plaster has a significant influence on the behaviour of the plaster as a fire protection of timber members. 3. There is minimal influence on the fire behaviour of timber members with different clay and sand ratios of plaster. 4. The densities of plasters in this study showed no significant influence on the determination of the fire protection properties. 5. No ignition and cracking of clay plaster occurred during the fire exposure. 6. No unpleasant odors came from the clay plaster during the test. 84
86 7. Design equations for the start time of charring of timber and for the calculation of reduced charring rate are provided. The given recommendations are based on the test results and relate to the thickness of plaster. 8. The given equations are most probably conservative and ensure sufficient safety level for the use of clay plaster. At the moment, the properties of clay plaster are not described and classified in European product standards. In order to confirm the conclusions based on this study, the properties of clay plaster need to be verified in larger scale. Further research is necessary towards the determination of the protection effect of clay plaster for the fire design of timber structures. 85
87 8 Resümee Käesoleva töö eesmärk oli uurida savikrohvi kaitsvat mõju puitkonstruktsioonidele tulekahju olukorras. Savikrohvi mõju puitkonstruktsioonide projekteerimisel ei ole laialdaselt uuritud ning puitkonstruktsioonide tulepüsivuse projekteerimise standard (EN ) ei käsitle krohvi kui kaitsvat materjali. Töö tulemuste kirjeldamisel järgiti EN arvutuseeskirjade eeskuju ning esitati ettepanekud oluliste parameetrite arvutamiseks krohviga kaetud puitkonstruktsioonide projekteerimiseks puidu söestumise algusaeg ja söestumiskiirus. Uurimistöö teostati katsete ja teoreetiliste uuringute tulemusena. Tulenevalt savikrohvi spetsiifilistest omadustest tehti tihedat koostööd vastavate Eesti ettevõtetega, kes jagasid nii tehnilist teavet kui ka abistasid katsekehade ettevalmistustöödega. Krohvimistööd teostas professionaalne krohvija. Kõik kasutatud materjalid olid toodetud Eestis. Katsekehad koosnesid: puidust, pilliroomatist ja savikrohvist. Okaspuidust katsekehade mõõtmed olid 100x100x100 mm, millele kinnitati pilliroomatt enne krohvikihi paigaldamist. Pilliroomatt on üks traditsioonilisemaid ja laialdasemalt kasutatavaid aluspinna materjale savikrohvi paigaldamiseks. See on vajalik, sest savikrohv kinnitub kantavale pinnale vaid mehaaniliselt. Katsetatavaks savikrohviks valiti kõige lihtsam ja traditsioonilisem krohvi koostis: savi, jämedateraline liiv fraktsiooniga 0-4mm ja põhukiud. Käesoleva töö raames oli soov leida võimalikult laiahaardeline tulemustekogum, mis ei pärsi üldistuste tegemist. Sellest tulenevalt katsetati erinevate savi ja liiva koostissuhetega krohvi. Lisaks katsetati erinevaid krohvikihi paksusi. Iga eriliiki katsekeha jaoks teostati korduskatsed veendumaks tulemuste usaldusväärsuses. Katsed viidi läbi SP Tehnilise Uurimise Instituudis Stockholmis. Katsekehade katsemiseks kasutati väikesemõõduselist seadet koonkalorimeeterit (ISO 5660). Katsete läbiviimisel järgiti standardtulekahjule (ISO 834) vastavat soojavoogu ning iga katse kestvus oli 60 minutit. Katse käigus mõõdeti temperatuuri termopaaride abil krohvi all puidu pinnal. 86
88 Kokku katsetati 24 savikrohviga kaetud puidust katsekeha. Savikrohvi kaitsva mõju parema ülevaate andmiseks ja tulemuste võrdlemiseks tehti üks katse ka puidust katsekehaga, mis oli kaetud F tüüpi kipsplaadiga paksusega 15 mm. Katse tulemused esitati temperatuuri mõõtmistulemuste põhjal ning visuaalse uuringu alusel. Temperatuurimõõtmiste alusel leiti krohviga kaetud puidu söestumise algusaeg. Puidu söestumiskiirus krohvi taga arvutati pärast puidust katsekehade pooleks lõikamist ning jääkristlõike mõõtmist. Katsetulemused näitasid väga head kokkulangevust korduskatsete puhul. Uurimistööst selgus, et puidu söestumise algusaeg krohvi taga ei sõltu märkimisväärselt erinevate krohvi koostisosade suhetest. Sama järelduseni jõuti ka krohvi taga leitud puidu söestumiskiiruste tulemuste analüüsi põhjal. Katsetulemustest selgus, et oluline parameeter, mis mõjutab krohviga kaetud puidu käitumist tulekahju olukorras on krohvi paksus. Savikrohviga kaetud puitkonstruktsioonide söestumise algusaja ja söestumiskiiruse projekteerimiseks esitati käesoleva töö tulemusena arvutusvalemid. Savikrohviga kaetud puitkonstruktsioonide projekteerimiseks esitatud ettepanekud põhinevad vaid antud töös kasutatud savikrohvi koostiste kohta ning suuri üldistusi oleks ennatlik teha. Saadud tulemused on vajalik kinnitada suuremamõõtmeliste katsetega, mis lisaks võimaldavad leida ka krohvi tõrketekkeaega. Käesolev lõputöö annab soovitusi ja projekteerimisparameetreid savikrohvi kui traditsioonilise ehitusmaterjali tulepüsivuse tõestamiseks analüütilisel moel. Autori soov on julgustada looduslike ehitusmaterjalide laialdasemat kasutamist. 87


89 APPENDIX A Figure A-1 Documentation after the test. Timber specimen with a 10 mm plaster. 88


90 Figure A-2 Documentation after the test. Timber specimen with a 20 mm plaster. 89

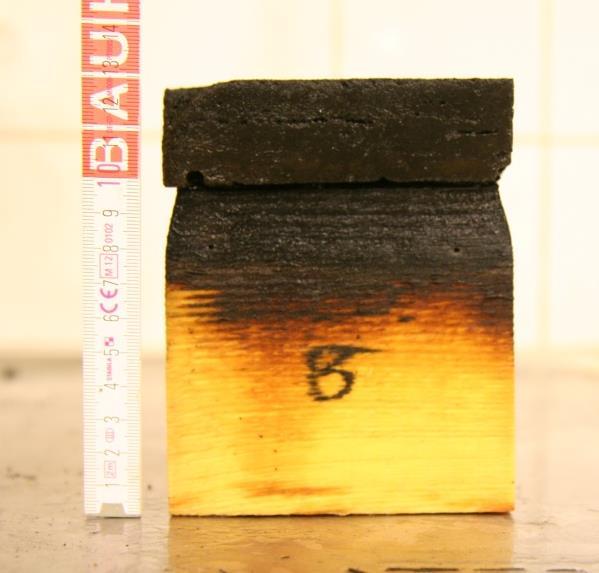
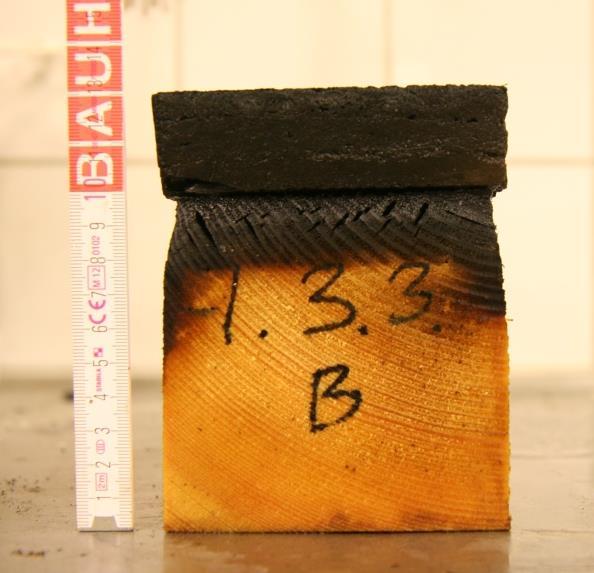

91 Figure A-3 Documentation after the test. Timber specimen with a 30 mm plaster. 90

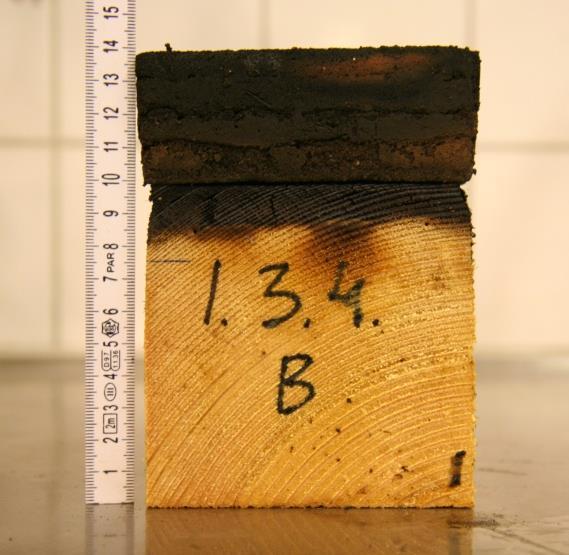
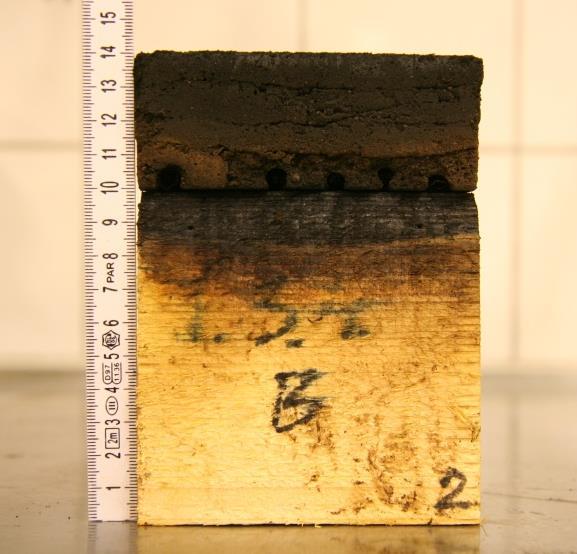


92 Figure A-4 Documentation after the test. Timber specimen with a 40 mm plaster. 91

93 APPENDIX B Figure B-1 Documentation of the residual cross-sections. Specimens variant A. 92

94 Figure B-2 Documentation of the residual cross-sections. Specimens variant B. 93