Engineering Construction on Infrastructure
|
|
|
- Ferdinand Fowler
- 5 years ago
- Views:
Transcription

1 Engineering Construction on Infrastructure 10 YEARS OF TRENDS 2018
2 Engineering Construction on Infrastructure 10 YEARS OF TRENDS Engineers Australia is the trusted voice of the engineering profession. We are the global home for engineering professionals renowned as leaders in shaping a sustainable world.
3 ENGINEERING CONSTRUCTION ON INFRASTRUCTURE; 10 years of trends Author: Andre Kaspura ISBN: Institution of Engineers Australia 2018 All rights reserved. Other than brief extracts, no part of this publication may be reproduced in any form without the written consent of the publisher. The report can be downloaded at Public Affairs Engineers Australia 11 National Circuit, Barton ACT 2600 Tel:
4 Contents 1. Executive summary 1 2. Objective and Introduction Base-Line Statistics 4 3. Structure of Engineering Construction Statistics 7 4. Infrastructure Priorities Infrastructure Asset Classes Roads Bridges Railways Harbours Water Sewerage Electricity Pipelines Telecommunications Assessment Progress in States and Territories Construction compared to jurisdictional economy NSW, Victoria and Queensland Western Australia, South Australia and Tasmania The ACT and Northern Territory Jurisdictional performance against Comparison to key drivers Comparison to Gross National Product Comparison to Population Growth Overall assessment Changes in Asset Classes Changes in States and Territories Economic and Population Growth Effectiveness of Infrastructure Decisions Summary 46
5 1 Executive Summary This Engineers Australia report, Engineering Construction on Infrastructure: 10 years of trends, is an analysis of the progress of infrastructure construction. It is based on Australian Bureau of Statistics (ABS) statistics over 10 years from to The report fills a gap in public discussions about infrastructure, which typically focus on new projects and rarely include analyses of the stock of infrastructure as a whole and characteristics like its condition, its performance compared to service standards in its design, its age and maintenance history. The report emphasis is on public sector construction, though private sector work is also analysed. All statistics are converted into prices to ensure valid comparisons. GENERAL TRENDS Over the past 10 years, Australia s public sector engineering construction on infrastructure in real terms has displayed a downward trend. A low point was reached in when construction completed was 82% of the outcome. Since then, construction on infrastructure has increased but, in , it was still below the outcome. It was not until that the amount of infrastructure completed was once again higher than at the start of the decade, and exceeded the intervening high point of Private sector engineering construction on infrastructure has also displayed a downwards trend. In this case the reason was mainly the winding down of infrastructure construction that is complementary to resources projects (and often in remote locations). In the last two years, private sector infrastructure construction has begun to increase, mainly on electricity and telecommunications. PUBLIC SECTOR PRIORITIES: ROADS, RAILWAYS AND TELECOMMUNICATIONS On the strength of engineering construction completed, in , the highest public sector priority was roads construction. It accounted for 44.2% of work completed. This was followed by railway construction which accounted for 18.1% of work completed, and telecommunications which accounted for 13.5% of work completed. These asset classes accounted for three-quarters of construction completed. The same three asset classes (roads, railways and telecommunications) had upwards trends over the decade reviewed. They accounted for on average 59.6% of public sector engineering construction on infrastructure over the decade. The remaining six asset classes had downwards trends. In , overall public sector engineering construction on infrastructure was almost identical to that in in real terms. This result occurred due to increases in roads, railways, pipelines and telecommunications construction that were fully offset by reductions in construction of bridges, harbours, water and sewerage facilities and electricity. A NEW HIGH, DRIVEN BY ROADS AND RAILWAYS In , public sector engineering construction on infrastructure moved ahead of the level. This shows that there may be some momentum to the growth that has followed the low point. Most of the change to above construction was the result of increased construction of roads and railways. Those asset classes that were below the level the previous year were still well 1
6 below this level in , although small increases were recorded. Telecommunications construction decreased relative to the previous year, but continued to be well above the level. PRIVATE SECTOR RESULTS In the private sector, only two asset classes showed increasing trends over the decade: electricity and telecommunications. They accounted for an average 41.0% of private sector construction. Three asset classes (railways, harbours and pipelines), showed boom/bust cycles that were likely the result of construction that was complementary to resources projects. This construction accounted for an average 29.2% of the decade s construction. The remaining four asset classes, accounting for an average 29.8% of the decade s construction, showed downwards trends. RECOVERY PHASE IS NOT OVER A common feature of both public and private sectors is that numerous asset categories had construction levels in that were well below levels. The key driver in the public sector was transport-related construction and telecommunications. Telecommunications was also a substantial contributor to the overall private sector result, together with construction of electricity facilities. Last year was the best year of the past five for infrastructure construction, with public sector construction rising above an early decade peak. Likewise, private sector infrastructure construction has moved beyond its strong emphasis on construction that is complementary to the resources boom and shrugged off three years of construction levels below levels. RECENT GAINS ARE MAKING UP FOR EARLIER LOSSES These are important gains. However, the current upswing in infrastructure construction underway since is really compensating for a downwards cycle in construction over the four years before. STATE-BY-STATE Taking a broad perspective over the past decade, public sector infrastructure construction displayed increasing trends in four jurisdictions: Victoria, Tasmania and the two territories. On average these jurisdictions accounted for 18.9% of public sector construction. Four jurisdictions had decreasing trends: NSW, Queensland, South Australia and Western Australia. They accounted for 81.1% of infrastructure completed. In the last two years, public sector infrastructure completed has increased in all jurisdictions except Western Australia and Tasmania. In the two resources states, Queensland and Western Australia, infrastructure completed remains less than at the beginning of the decade especially in Queensland. The large increase in Victoria is offset by that state s low share of national public sector infrastructure completed. Public sector infrastructure completed has grown in the smaller jurisdictions, but the effect on the national result is minor. INFRASTRUCTURE NOT KEEPING UP WITH POPULATION AND ECONOMIC GROWTH From until , national public sector infrastructure completed tracked above both economic and population growth. Since then, infrastructure completed has tracked slower than economic and population growth. The gap was widest in when infrastructure completed was at a low point. Despite strong infrastructure growth since then, the gap has not yet been bridged. 2
7 2 Objective and Introduction During the past five years or so, there has been a great deal of government emphasis on increasing scale of infrastructure programs. Establishing what is really happening is not always simple when projects are announced multiple times, when the duration of projects (even in the same program) range from a year to over six years, when announcements compound new developments with the running and maintenance costs of existing assets, and when details of private sector participation in infrastructure development is often commercial in confidence. Ideally, discussions about infrastructure would be based on comprehensive information about the existing stock of infrastructure assets, including the ages of these assets, the service standards to which they were designed and built and the locations of existing assets and locations where problems and/or deficiencies have been found. Unfortunately, most discussions, and too often decisions, are based on information not readily verified by others. In this context, Engineers Australia has turned to surrogate indicators based on Australian Bureau of Statistics (ABS) engineering construction statistics. These statistics have been continuously compiled since the mid-1980s 1 and cover major classes of infrastructure assets in each state and territory and nationally. The indicators are surrogates for two reasons. First, engineering construction statistics do not measure the stock of infrastructure, but new additions to the stock. Second, the ABS employs a number of protocols such as the exclusion of land values so that the statistics are necessarily different to conventional budget figures. Never-the-less, trends in engineering construction have proved to be reliable indicators of infrastructure delivered on the ground and avoid the confusion described above. The objective of this report is to analyse trends in engineering construction on infrastructure during the decade ending 30 June 2018 with particular emphasis on public sector construction. The ABS statistics require some transformation to facilitate analysis. Engineering construction statistics are comprehensive and cover many economic activities other than infrastructure. For this purpose, we simply adopt the definition of infrastructure used by Infrastructure Australia which covers transport, water, energy and telecommunications. This definition leaves out social infrastructure assets such as education and health facilities and recreational facilities and in this sense is debateable. It also leaves out engineering construction on heavy industrial facilities and resource sector facilities. Traditionally, infrastructure was provided by governments; accordingly, it is important to differentiate between infrastructure constructed by the public and the private sectors. There is a second reason why this distinction is important. Although the statistics readily allow a distinction to be drawn between private sector construction on resource sector projects and infrastructure, private sector infrastructure construction includes construction of infrastructure complementary to resources projects as well as private sector equivalents to public sector infrastructure. 1 Australian Bureau of Statistics, Engineering Construction Australia, Cat No , electronic statistics, 3
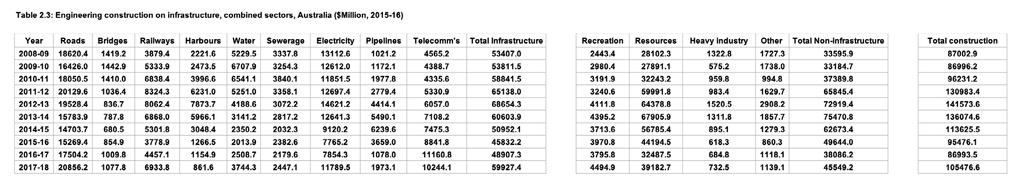
8 Sometimes this distinction makes little difference, but in many cases resources projects are located remote from population centres and the utility of any infrastructure is specific to those locations. Its character is therefore different to infrastructure that is located in population centres and accessible by the community at large. Virtually all engineering construction undertaken by the public sector is infrastructure development. The small amount that is not is the construction of recreational facilities and some work on mines that complement publicly owned coal fired power stations. The ABS classifies statistics to sectors according to ownership of the asset constructed at the conclusion of construction. Thus private sector includes assets constructed and owned by the private sector when the asset has been built. Construction by the private sector under contract to the public sector is not treated as private sector but as public sector because the asset remains under public ownership. Construction undertaken directly by public sector agencies is the second element of public sector. Finally, the public sector covers all three levels of government. Some statistics are available about the contribution of each level of government, but these are limited and cannot be used to differentiate between infrastructure asset classes. The ABS publishes its statistics quarterly and in this report we annualise them into financial years. At national and state and territory level, both current value and chain volume statistics are published. However, statistics for specific asset classes are only available in current price form and are deflated using the implicit deflator estimated from the jurisdictional level statistics. There are probably other deflators that could give marginally better results, but the important issue is to use deflated statistics rather than overstate the extent of infrastructure construction by using current price statistics. 2.1 Base-Line Statistics The transformed engineering construction statistics that are the basis for this report are shown in Tables 2.1, 2.2 and 2.3 for the period to inclusive. The Tables comprise three parts: the first part of each Table presents statistics for infrastructure construction by asset class and the total of infrastructure; the second part of each Table presents statistics for the noninfrastructure elements of engineering construction; the final part of the Table is total engineering construction. Table 2.1 shows statistics for the private sector, Table 2.2 covers the public sector and Table 2.3 shows combined private and public sector statistics. 4


9 5

10
11 3 Structure of Engineering Construction Statistics The focus in this report is on engineering construction completed on infrastructure, but it is useful to take a moment to reflect on the scale of engineering construction as a whole and how much of it is infrastructure. We do this with the assistance of Figure 3.1 which illustrates the trends in public, private and total engineering construction on infrastructure. Figure 3.2 illustrates the corresponding trends in non-infrastructure components of engineering construction. Public sector engineering construction on infrastructure has ranged from a low of $24,720.5 million in to a high of $34,390.5 million in and has consistently accounted for over 93.0% of public sector engineering construction. In , public sector total engineering construction was $36,855.6 million, of which 93.3% was infrastructure construction. Construction of resources and heavy industry facilities was minor and most often related to facilities complementary to government owned electricity generators. The small scale of this component is clearly evident in Figure 3.2. The relative scale of the infrastructure and non-infrastructure components of engineering construction in the private sector has been quite different. Typically, engineering construction on infrastructure has been lower than construction of non-infrastructure assets. The peak year for construction was ; engineering construction on infrastructure was $36,486.5 million, greater than the corresponding peak in the public sector. However, in that year infrastructure was just 34.0% of total private sector engineering construction, and construction of noninfrastructure elements was $70,893.2 million. Both private sector infrastructure and noninfrastructure construction have fallen dramatically since the peak; infrastructure construction fell to $19,454.0 million in but has since recovered to $25,536.8 million. Construction of non-infrastructure assets fell to $36,146.0 million in and has increased to $43,084.1 million in , with over 90% in the resources sector. The reduction in construction activity since the peak has been substantial and has led to the popular one liner that the resources boom is over. However, construction of non-infrastructure assets in was higher than either public or private infrastructure construction and still remains a potent source of economic activity. Private sector engineering construction on resources facilities has been complemented by large amounts of infrastructure construction in some asset categories. Construction of railways, harbours and pipelines have been essential to complete investments in remote locations. In several years the scale of this work has dominated private sector infrastructure construction, distorting how we should view it. Although undoubtedly infrastructure, its location means it is of a different character to similar assets in large population centres. As construction in the resources sector falls, this effect will ease. It is also useful to reflect briefly on the infrastructure construction pipeline. This comprises three elements: construction work completed, construction work commenced and construction work that is underway, but not yet completed. Our analysis concentrates on construction work completed because it is the indicator of what is really happening on the ground. It is useful to consider trends in construction worked commenced because it provides a guide to the implications of current decision making and to future trends in construction completed. The third element is a guide to the volume of uncompleted work that may feed into trends in construction completed in the future with the caveat that uncompleted work is not always so reflected. Our discussion relies on illustrations, but for completeness the relevant statistics are in Tables 2.4 to 2.6 for construction commencements, and Tables 2.7 to 2.9 for construction yet to finish. 7
12 8


13 9


14 10
15 The infrastructure pipeline for the public sector is illustrated in Figure 3.3. The trend in construction completed on infrastructure is shown in blue and has a negative trend. Infrastructure completed fell to a low point in and has since steadily increased. The first two years of this upswing were below the trend line; in construction completed was close to trend, that is still below the earlier peak in , but in construction completed was above the trend and the highest level in the decade reviewed. The trend in new construction on infrastructure commenced fairly closely, and follows the trend in construction completed on infrastructure and also has a negative trend. In new commencements increased to above the trend and have been above trend in subsequent years. New commencements in were the highest in the period reviewed even though several large announced projects, for example, the second Sydney airport, have yet to commence on the ground. On average new commencements were equal to average annual completions during this period. Last year, new commencements were equal to about 1.1 years of work at the current rate of completions. The third component of the infrastructure pipeline is unfinished work yet to be completed shown in red in Figure 3.3. This element can be unreliable and statistics for several asset classes appear not to be available in several jurisdictions. Even so it is a helpful guide to uncompleted work in the system. On average, there are 2.3 years of uncompleted public sector work, at the average rate of completions. Last year there were 2.9 years of uncompleted work, reflecting some larger projects that commenced in recent years. 11
16 The infrastructure pipeline for the private sector is illustrated in Figure 3.4. The influence of the resources boom is clearly evident in the period up to Over the next four years, construction of various large projects was completed leading to a sharp reduction in unfinished work which has levelled out over the past three years. Given this background, it was not surprising to find negative trends in construction of infrastructure completed and new construction commenced. The interesting aspect of the latter is the upsurge in commencements last year which contrasts sharply with the trend of the previous nine years. Over the 10- year period, private sector commencements averaged 0.9 years of work at the average rate of completions while unfinished construction averaged 2.6 years of work at the average rate of completions. Although traditionally infrastructure provision has been the responsibility of the public sector, the contribution of the private sector has become increasingly important. This is especially the case in roads, electricity and telecommunications infrastructure. Earlier statistics for the private sector include construction on assets accessible by a narrow range of business groups by virtue of the location of these assets away from population centres. This distortion has reduced as the resources boom has tapered off but should be kept in mind. 12

17 ENGINEERS AUSTRALIA ENGINEERING CONSTRUCTION ON INFRASTRUCTURE 13
18 4 Infrastructure Priorities It is useful to consider how infrastructure priorities have changed over the past decade. Official announcements of infrastructure plans are subject to change, so in this report, priorities are instead indicated by outcomes achieved. In practice, this is measured in terms of the relative proportion of infrastructure completed in each asset class. We compare priorities for three years; the beginning and end of the decade and for which, as well as being mid-decade, was also the peak year for the resources boom. In Table 4.1 we set out infrastructure priorities for the public sector. Throughout the decade, the construction of roads has been the top priority for the public sector, increasing from 38.4% of infrastructure completed in to 43.5% and 44.6% in Table 4.1: Public sector infrastructure priorities over the years Rank Asset class % of construction Asset class % of construction Asset class % of construction 1 Roads 38.4 Roads 43.5 Roads Electricity 23.7 Electricity 22.7 Railways Water 15.1 Railways 10.7 Telecomm Railways 8.3 Water 8.3 Electricity Sewerage 7.2 Sewerage 7.4 Water Bridges 4.4 Telecomm 3.9 Sewerage Harbours 2.7 Bridges 2.4 Bridges Telecomm 0.2 Harbours 0.9 Harbours Pipelines 0.0 Pipelines 0.1 Pipelines 0.0 Electricity assets was the second ranked priority in both and accounting for 23.7% and 22.7%, respectively, of infrastructure completed. This reflected extensive redevelopment of the electricity transmission and distribution system during this period. By , electricity had slipped to fourth accounting for 8.0% of public sector infrastructure completed. In , construction of water facilities was the third highest public sector priority, accounting for 15.1% of infrastructure completed. This was largely due to the construction of desalination plants in several jurisdictions prompted by the millennium drought. By , water had slipped to fourth place with 8.3% of infrastructure completed and by to fifth place with 6.6% of infrastructure completed. The priority accorded to public sector railway construction has increased over time. In , railway construction was the fourth ranked priority with 8.3% of infrastructure completed. By , the ranking rose to third and its share of infrastructure completed to 10.7%. By , railway construction was ranked second highest and accounted for 17.5% of infrastructure completed. Together, road and rail transport facilities accounted for 62.3% of public sector infrastructure completed. In , Telstra had been privatised and public sector focus on the construction of telecommunications facilities was low and construction in this area was the second lowest priority. Table 4.1 shows that as the NBN project was progressively geared up. In , construction completed on telecommunications was ranked sixth with 3.9% of infrastructure completed and by the ranking had risen to third and the telecommunications share of construction completed had increased to 13.5%. 14
19 A consistent feature of public sector infrastructure construction has been that the top three priorities have accounted for more than three-quarters of infrastructure completed, even though the top three asset classes have changed. The proportion of construction in the remaining six asset classes has been substantially lower. Private sector priorities are set out in Table 4.2. Like in the public sector, road construction has been important to private sector infrastructure construction. In , it was the top priority with 30.3% of infrastructure completed. Table 4.2: Private sector infrastructure priorities over the years Rank Asset class % of construction Asset class % of construction Asset class % of construction 1 Roads 30.3 Harbours 20.8 Electricity Electricity 25.6 Electricity 20.1 Roads Telecomm 19.3 Roads 15.1 Telecomm Harbours 6.1 Telecomm 13.1 Pipelines Railways 6.0 Railways 12.7 Water Sewerage 5.0 Pipelines 12.0 Railways Pipelines 4.3 Water 4.1 Sewerage Water 2.9 Sewerage 1.9 Harbours Bridges 0.4 Bridges 0.2 Bridges 0.6 By , roads slipped to third highest priority and its share of construction completed halved. By , road construction had increased to second priority with 22.2% of construction completed. From an engineering point of view this variability reduces the capacity to maintain a skilled road-building workforce, with implications for costs. Construction of electricity assets has consistently been a high private sector priority but the reasons for this status have changed over time. During the first half of the decade the focus was on renewal of the distribution and transmission system, paralleling the public sector. More recently, the focus has turned to the construction of renewable electricity facilities. Later analysis shows that the trend in electricity construction is very buoyant and has resulted in this sector being the highest ranked private sector priority with 35.3% of construction completed in The influence of the resources sector on private sector infrastructure priorities is clearly evident in the statistics. Asset classes that are important complements to resource sector facilities increased substantially in priority and in their share of construction completed. In particular, construction of harbour facilities became the top priority with 20.8% of infrastructure completed, railway construction did not rise up the priority list but doubled its share of construction completed to12.7% and the share of construction accounted for by pipelines almost tripled to 12.0%. The three asset classes accounted for 45.5% of private sector infrastructure completed in compared to 16.4% in and 12.2% in

20
21 5 Infrastructure Asset Classes This section explores trends in engineering construction in the nine classes included in our definition of infrastructure: Roads Bridges Railways Harbours Water Sewerage Electricity Pipelines Telecommunications The discussion focuses on engineering construction work completed. References to new work commenced and/or work yet to finish relies on Tables 2.4 through to Roads The trends in engineering construction on roads 2 over the past 10 years are illustrated in Figure 5.1. Private sector construction is shown in green, the public sector in blue and the two sectors combined is in red. Simple trend lines have been included for each sector and the combined outcome. On average, over the past decade road construction was 31.4% of national engineering construction on infrastructure (private sector 21.3% and public sector 40.6%). In , the share of road construction was above average at 34.8% (private sector 22.2% and public sector 44.2%). 2 The ABS statistics for roads are very broad. Besides conventional roads, it includes parking areas, cycle paths, airport runways, pedestrian and vehicle overpasses, traffic lights, roundabouts, associated road drainage work, street and highway lighting, road resurfacing, curbing and guttering and road tunnels. See cat no
22 Road construction by the public sector was characterised by large fluctuations lasting several years which produced a slight upwards trend. The low point for public sector road construction was in when construction completed was well below trend. Since then there have been three years of solid increases resulting in construction in being well above the trend and substantially higher than the previous peak in Recent commentary has tended to emphasize the upswing since , ignoring the fact that there was a strong downwards cycle between and In , public sector road construction completed was $15,185.7 million in real terms. That was 6.7% higher than the peak and 50.6% higher than the trough. In contrast to the public sector, road construction by the private sector has substantially smaller fluctuations and shows a decisive downwards trend. The low point in road construction occurred in when it was $4,367.0 million in real terms. In it increased to be on the downwards trend line and in it increased again to $5,670.4 million in real terms, above the trend line but below the construction outcomes in to inclusive. Road construction by the private sector has generally been substantially less than by the public sector. When the sectors are combined, the 10-year trend line is almost horizontal. While the real outcome in is indeed the highest during the period it is just 3.6% higher than was achieved in Abstracting from the broad fluctuations shown in Figure 5.1, effectively road construction has not increased over time. Turning to the future, we observe that private sector commencements on road projects more than doubled while public sector commencements fell by 39%. Overall, there was a 5% increase in commencements on roads in which is about 0.9 years of work at the current rate of completions. There was a similar pattern in the amount of engineering construction on roads yet to be finished with a large increase in private sector work offset by a reduction in public sector work, resulting in an overall increase of 2%. This was about 3.2 years of work at the present rate of completions. These figures suggest that the high level of completions achieved in is likely to be repeated if not exceeded next year. 18
23 5.2 Bridges The construction of bridges 3 is a small component of infrastructure. On average, it accounts for just 0.4% of private sector construction on infrastructure and 3.1% of public sector engineering construction. This combines for an overall share of 1.9% of infrastructure construction. This asset category covers both road and railway bridges. Trends are illustrated in Figure 5.2. Public sector engineering construction on bridges peaked in and has followed a pronounced downwards trajectory reaching a low point of $528.3 million in This trajectory was characterised by similar broad fluctuations over several years, as evident in road construction. The outcome is a high point in the latest such cycle suggesting a large increase from the low, but in reality it is well below the level of construction in earlier years. In , public sector construction on bridges was $931.3 million in real terms. Private sector engineering construction on bridges has been much lower than in the public sector and has not fluctuated to the same degree. There is a slight upwards trend shown in Figure 5.2, but not nearly enough to offset the falls in the public sector. In , private sector construction on bridges was $146.5 million in real terms. Engineering construction on this asset displays similar fluctuations to road construction but with a clear-cut downwards trend. That is mainly due to reduced construction by the public sector. Focusing on the upswing since gives a misleading impression of growth when the outcome is below those achieved in the early years of the decade. Overall commencements fell by 7.6% in , representing about 0.85 years of work at the present rate of completions. Unfinished work fell by 6.7%, representing about 2 years of work at the present rate of completions. These figures suggest that in construction could plateau or fall. 3 The ABS statistics include bridges for the support of roads, railways, causeways and elevated highways. See cat no

24
25 5.3 Railways This asset class includes tracklaying, overhead power lines and signals, platforms, tramways, tunnels for underground railways and fuel hoppers 4. Assessing trends in this asset category is complicated by a large bump in private sector construction evident in Figure 5.3 due mainly to the resources boom. This is now over and the last three years of private sector data are a better reflection of its contribution to infrastructure development. The 10-year average share of 8.1% for private sector infrastructure reflects this effect. Over the past three years this share has fallen to 3.2% and in it was 2.7%. Railway construction has been an increasingly important area for the public sector. On average railways have accounted for 11.9% of public sector engineering construction on infrastructure. This share increased to 14.2% over the past three years and to 18.1% in Private sector engineering construction on railways ranged from 2.7% of private sector infrastructure construction last year to 14.0% in Indeed, it averaged 12.4% over the period to inclusive. In , private sector construction on railways fell to less than a third of the level the previous year. In construction completed was $520.0 million in real terms compared to the peak of $4,623 million in Last year construction completed increased to $694.3 million in real terms. Public sector engineering construction on railways has been characterised by large fluctuations which have never-the-less produced an upwards trend over the 10 years of the review. On average, public sector railway construction has been 11.9% of the sector s infrastructure and peaked at construction valued at $4,481.1 million in real terms in before sliding to a low point of $2,417.1 million in real terms in The last three years have seen large annual increases in construction, resulting in a new peak of $6,239.5 million in real terms in , some 39% higher than in See cat no
26 As was the case with road construction, much of the emphasis in public sector railway construction has been on growth from the latest low point. This calculation shows there has been a 158% increase to $6,239.5 million in real terms in While this might be considered something of an exaggeration, the outcome was 39% higher than the previous peak in construction in The low point in new railway commencements occurred relatively late, in , when construction valued at $3,641.2 million in real terms began. This almost tripled to $10,013.6 million in real terms last year, representing about 1.4 years of work at the current rate of completions. There is a large amount of unfinished work in rail assets and this has more than doubled since In it was $33,206.8 million in real terms, representing about 4.8 years of work at the current rate of completions. These figures suggest that rail construction completed is likely to rise over the next year or so. 5.4 Harbours Engineering construction on harbours 5 has been dominated by private sector construction. The large hump in that sector s construction, evident in Figure 5.4, coincides with resources sector construction in support of resources projects. It resulted in a 10- year average share of private sector construction on infrastructure of 10.1%. As was the case with railways, the level of construction in the last three years is a better indicator of harbour construction in population centres. The share of construction fell to 3.4% and even further to 1.8% in In , the private sector construction harbour facilities valued at $460.9 million in real terms. Public sector engineering construction on harbours has been low throughout the last 10 years, averaging 1.8% of construction on public sector infrastructure, and it has been falling over time; to 1.4% over the past three years and to 1.2% in resulting in a negative trend. 5 The ABS statistics includes boat and yacht basins, breakwaters, retaining walls, docks and piers, terminals, wharves, dredging works and marinas. See cat no

27 In , the public sector completed $400.7 million in rail facilities, bringing the overall total up to $861.6 million. Private sector construction commencements have been falling. Public sector commencements were steady at the level but in increased by more than threefold to $838.5 million. Overall, new commencements were $1,098.9 million in real terms, representing about 1.3 years of work at the current level of completions. There is a substantial amount of unfinished work in the system, some $2,637.7 million last year, representing about three years of work at the current rate of completions. These figure suggest that the falling overall trend observed in Figure 5.4 is likely to plateau at about current completion levels.
28 5.5 Water Trends in engineering construction on water facilities 6 are illustrated in Figure 5.5. The early regions of the trends illustrated reflect high levels of engineering construction associated with the building of desalination plants in several capital cities. These high levels of construction are largely responsible for the negative trends shown in the illustration. Following this period, construction fell to a low point: in for the private sector and a year earlier for the public sector. On average, construction of water facilities has been 5.5% of private sector engineering construction on infrastructure and 8.8% of public sector construction. In , these shares were lower at 5.2% and 6.2%, respectively. In , private sector construction on water facilities doubled the levels achieved in the preceding two years with $1,340.3 million in construction completed, compared $3,278.5 million in real terms in Public sector engineering construction on water facilities has increased in each of the last two years and in was $2,403.9 million in real terms compared to $4,723.5 million in real terms in Overall, water facilities construction is on the rise. It increased by 85%, from the low point of $2,013.9 million in real terms in , to $3,744.3 million in real terms. This compared to the peak of $6,707.9 million in real terms. New commencements last year were $3,359.1 million in real terms, down 2.6% on the previous year but about 50% higher than in the three years to inclusive. This represented about 0.9 years of work at the current rate of completions. There was unfinished work of $9,138.3 million in real terms outstanding, representing about 2.4 years of work at the current rate of completions. These figures suggest that the increases observed over the past two to three years could continue for another two years or so. 6 The ABS statistics on water storage and supply includes dams, weirs, reservoirs, embankments for water diversion, water pipelines, mains and treatment plants, flood prevention and erosion, aqueducts, water conduits, systems conveying water to residences and commercial and industrial establishments. See cat no
29 5.6 Sewerage Trends in the construction of sewerage facilities 7 are more straight forward than some of the assets discussed above, with no obvious source of major distortion. They are illustrated in Figure 5.6. On average, construction of sewerage facilities has been 2.6% of private sector engineering construction on infrastructure and 7.3% of the public sector construction. Consistent with the falling trends illustrated, the shares are lower at 2.5% and 5.2%, respectively. Like several other asset classes, was a low point in sewerage construction and much of the focus has been on the improvement since then. For the public sector this low was $1,609.1 million in real terms so that was up 11.8% on this, but some 42% lower than peak construction in Private sector construction in this asset class has been much lower and has been falling steadily. Again attention tends to be on the 84% increase since the low point instead of the drop of the 48% drop since peak construction in to the outcome. The two sectors combined completed construction valued at $2,447.1 million in real terms, well down on the levels achieved in the first half of the decade. New commencements in were in line with the average of the past four years, noting small annual fluctuations, but the level of new starts was well down on the first half of the decade. In new commencements were $1,716.7 million in real terms, representing 0.7 years of work at the current level of commencements. The peak was $2,703.9 million in There was a fair amount of unfinished work in the system, but again well down on these amounts in the first half of the decade. In , unfinished work was $5,139.9 million in real terms, representing about 2 years of work at the current rate of completions. Other than some annual fluctuations it is likely that current sewerage trends will continue. 7 Sewerage and drainage statistics include sanitary and storm sewers, sewerage treatment plants, stormwater drains and drainage systems. See cat no
30 5.7 Electricity Trends in engineering construction on electricity facilities 8 are illustrated in Figure 5.7. On average, engineering construction on electricity facilities has been 21.5% of private sector infrastructure construction and 19.3% of the public sector s construction. Construction in the private sector has been characterised by broad multi-year fluctuations while the public sector trend is clearly downwards. The early sections of both private and public sector trends reflected large investments in the electricity transmission and distribution networks. This influence is most noticeable in the lumpy completion levels in private sector between and In both sectors, construction fell as this work was completed. In the private sector, poles and wires construction peaked in and was well and truly over by Construction plateaued for two years, but began to increase from and in construction completed was almost double that of the previous year with $9,025.6 million in real terms. That was most likely due to the construction of renewable generation facilities. This outcome meant that this construction accounted for 35.3% of the private sector infrastructure construction. In contrast, public sector construction on electricity facilities continued to fall after the poles and wires phase was over. In , construction completed on electricity facilities by this sector had fallen to $2,763.9 million in real terms, the lowest level in the 10 years reviewed. This sharp rise in private sector construction completed was more than sufficient to offset the fall in public sector construction. The result was an overall 50% increase in construction completed last year. In , combined sector new commencements on electricity facilities increased by 57% and unfinished work in the system increased by 67%. These figures were driven by the private sector and are likely to see a continuation of the trends illustrated in Figure 5.7 for the next two years at least. 8 Statistics on electricity include power stations, substations, hydro-electric generating plants and associated work such as towers, chimneys, transmission and distribution lines. See cat no
31 5.8 Pipelines Almost all pipeline 9 construction has been undertaken by the private sector, as can be seen in Figure 5.8. Almost all can be linked to the resources boom in some respect. Construction completed peaked at $6,229 million in and has fallen sharply since. In , $1,452 million in pipeline construction was completed, a sharp increase on the previous year, but left the level of construction substantially below the peak. There was almost no construction by the public sector. New construction commencements increased by 67% in , but were about one third the level of commencements at the peak. Similarly, the amount of unfinished work in the system more than doubled but its scale was substantially reduced; just 12% of the $34,342.9 million peak. Construction of pipelines may increase over the next two years but will not come close to peak construction levels. 9 Pipelines include oil and gas pipelines, urban supply mains for gas and pipelines for refined petroleum products, chemicals and foodstuffs. See cat no

32
33 5.9 Telecommunications Both private and public sector trends in engineering construction on telecommunications facilities 10 have been upwards. Before Telstra was privatised, almost all engineering construction on telecommunications infrastructure was by the public sector. Figure 5.9 shows that the privatised Telstra and other private sector competitors have steadily grown their infrastructure. In the public sector, engineering construction on the NBN grew strongly from a zero base. On average, construction of telecommunications facilities was 19.5% of the private sector s infrastructure construction, rising to 26.4% in the past three years. The corresponding proportion for the public sector was 15.0%. Private sector engineering construction on telecommunications peaked at $6,165 million in , but fell to $4,697 million the following year. Public sector construction also peaked in , at $4,995 fell the following year, in this case to $3,510 million. The two sectors combined completed telecommunications infrastructure valued at $8,208.3 million, about 19% of infrastructure completed. Private sector new construction commencements in were $4,618.7 million, down 11.6% on the previous year. New commencements in the public sector were similar to the previous year. The combined outcome was $10,146.8 million in real terms, about 9% down on , but the second highest commencement level in the decade investigated. This represented about a year s work at the current rate of completions. In contrast to other infrastructure assets, unfinished telecommunications infrastructure in and recent years has been especially low suggesting a different approach to construction procurement. These statistics are difficult to evaluate but the level of commencements suggests that present trends could plateau in the year ahead. 10 Telecommunications includes mobile phone, radio, television, microwave and radar transmission towers, telephone lines and underground cables and coaxial cables. See cat no

34

35 5.10 Assessment We can assess progress on infrastructure completed from two perspectives; on the one hand, we can assess the 10 year trends and evaluate how individual trends contribute to the trends in Figure 3.1. We can also take a shorter term view by examining the asset class changes that have occurred in the past two years and compare them to the level of activity at the beginning of the decade. We begin with the public sector. Comparing the past two years with : public sector In the public sector, three asset classes had upwards trends: roads, railways and telecommunications. They accounted for on average 59.6% of public sector engineering construction on infrastructure over the decade. The remaining six asset classes had downwards trends. The more recent perspective is illustrated in Figure In this illustration we have employed index numbers to measure the level of engineering construction in (in blue) and in (in green) compared to the base year (in red). We have not included telecommunications in the diagram because this asset class grew to rather large numbers from a zero base and its inclusion would distort the rest of the diagram. In , overall public sector engineering construction on infrastructure was almost identical to that in in real terms. This result occurred as a result of increases in road, railways, pipelines and telecommunications (which are not shown in Figure 5.10) construction that were fully offset by reductions in construction of bridges, harbours, water and sewerage facilities and electricity. In , public sector engineering construction on infrastructure moved ahead of the level, continuing the growth momentum following the low point. Those asset classes that were below the the previous year were still well below this level in although small increases were recorded. Most of the change to above construction was the result of increased construction of roads and railways. Telecommunications construction decreased relative to the previous year but 31

36 continued to be well above the level. In , 66.2% of public sector engineering construction on infrastructure was accounted for by roads, railways, harbours and bridges. Comparing the past two years with : private sector In the private sector, only two asset classes showed increasing trends over the decade: electricity and telecommunications. They accounted for an average 41.0% of private sector construction. Three asset classes railways, harbours and pipelines showed boom/bust cycles that were likely the result of construction that was complementary to resources projects. This construction accounted for an average 29.2% of the decade s construction. The remaining four asset classes accounting for an average 29.8% of the decade s construction showed downwards trends. Figure 5.11 illustrates the engineering construction levels in (in blue) and (in green) relative to (in red). With the passing of the resources boom, two of the three asset classes closely associated with it railways and harbours had recent construction levels well below the level. The third asset class, pipelines, experienced a recent resurgence in construction which took it above the base level in Overall, private sector engineering construction on infrastructure in was below the level, but strong results in electricity and telecommunications, which accounted for 57.2% of the sector s construction, lifted the result above the starting level. A common feature of Figures 5.10 and 5.11 is that numerous asset categories had construction levels last year well below levels. The key driver in the public sector was transport related construction and telecommunications. 32

37
38 6 Progress in States and Territories Telecommunications was also a substantial contributor to the overall private sector result, together with construction of electricity facilities. Last year was a good year for infrastructure construction, but in real terms public sector construction has just emerged from five years of construction that is lower than levels. Likewise, private sector infrastructure construction has emerged from three years of construction levels below levels. While acknowledging the improvements that have occurred, the data suggests that the majority of asset classes are still well below where they should be. For example, recent reports 11 of congestion in cities suggests that the public sector focus on transport needs to persist for some time yet. This section briefly looks at the trends in public sector infrastructure constructed in the states and territories. It is important to emphasize that this discussion is about the location of public sector infrastructure and not about the construction undertaken by state or territory governments. The ABS statistics encompass the three levels of government: Commonwealth, state/territory and local. Earlier, we drew attention to the fact that statistics for the private sector include private sector construction that corresponds to public sector infrastructure construction and private sector construction of infrastructure in support of remotely located resources projects. We have no way of separating the two and given that resources activity has been more concentrated in some jurisdictions than others, we have limited the discussion to public sector infrastructure construction. 6.1 Construction compared to jurisdictional economy Australian jurisdictions vary greatly in size and the first question to ask is whether the amount of engineering construction on infrastructure is consistent with the size of the jurisdiction s economy. This comparison is undertaken in Figure 6.1 which compares each jurisdiction s share of gross national product to its shares of public and private sector engineering construction on infrastructure. Each of these shares are the averages over the 10-year period reviewed. 11 Australian Automobile Association, Road Congestion in Australia, October 2018, 34

39 Consider public sector engineering construction on infrastructure. Four jurisdictions have shares of national public sector infrastructure construction higher than their shares of gross domestic product. These were NSW, Queensland, South Australia and Tasmania. The other four jurisdictions had shares of national infrastructure construction below their shares of gross domestic product. These were Victoria, Western Australia, the Northern Territory and the Australian Capital Territory. In the private sector three jurisdictions had shares of national private sector infrastructure construction higher than their shares of gross domestic product. These were Queensland, Western Australia and the Northern Territory. In each case, these jurisdictions enjoyed significant resource sector development. However, the extent of the difference in Queensland was fairly small given the scale of resource development. The remaining five jurisdictions had shares of national private sector infrastructure construction below their shares of gross domestic product. Victoria has had a long history of private sector participation in infrastructure ownership and development which is illustrated by the large difference between public and private sector shares of infrastructure construction. To compare jurisdictional trends in public sector engineering construction on infrastructure is was necessary to convert engineering construction statistics into index number form in order to manage size differences. In doing so we acknowledge all the usual issues associated with this form of comparison. 35
40 6.2 NSW, Victoria and Queensland Figure 6.2 compares the trends in the three largest states: NSW, Victoria and Queensland. Figure 6.3 compares the trends in South Australia, Western Australia and Tasmania and Figure 6.4 compares the trends in the two Territories. In each case the national trend is included. NEW SOUTH WALES The NSW trend in public sector engineering construction on infrastructure closely follows the national trend. It shows a similar downwards trend with similar periodic fluctuations. Public sector infrastructure peaked in when the NSW construction index reached Construction contracted for three years to a low of index 83.3 in It is important to note that in the three years to , inclusive, the state s public sector infrastructure construction index was below its starting value. Then similar to the national situation, from the low there has been a pronounced growth spurt which established a new peak in construction of last year. At this stage this growth spurt has not been enough to turn around the negative trend for the 10-year period. Offsetting this assessment is the fact that the NSW share of national public sector infrastructure is higher than its gross product share. It is also important to bear in mind that none of the construction associated with the second Sydney airport would be included in the statistics yet. VICTORIA In Victoria, engineering construction on infrastructure was also characterised by large fluctuations lasting three to four years, but with an overall positive trend well above the national trend. An early peak in construction occurred in when the construction index reached Construction plateaued near this level for three years, followed by two years of contraction to the low where 36
41 the construction index was 102.9, just 2.9% higher than in From this low the recent growth spurt in infrastructure construction in Victoria has been much stronger, lifting the state s infrastructure construction index to in , well over double its starting value. In contrast to NSW, the Victorian public sector infrastructure construction index has been higher than the starting value in each of the past 10 years. On the negative side, however, the Victorian share of national public sector infrastructure construction has been quite low compared to its share of national gross product. QUEENSLAND Public sector infrastructure construction in Queensland has not experienced the large fluctuations evident in NSW and Victoria but the trend is one of continuous decline. The state s public sector infrastructure index fell in each year from to a low of 55.3% in There have been two years of increase since then so that by the index had increased to 70.2%, still almost 30% below its starting value. Offsetting this assessment is the fact that the Queensland share of national public sector infrastructure construction has been much higher than the state s share of gross national product. 6.3 Western Australia, South Australia and Tasmania Figure 6.3 compares the public sector infrastructure trends in Western Australia, South Australia and Tasmania to the national trend. WESTERN AUSTRALIA In the case of Western Australia, we observed above that the state s share of national public sector infrastructure was less than its share of national gross product. This has been accompanied by a downwards trend in real public sector infrastructure construction. Initially, infrastructure construction increased strongly and despite a fall in remained higher than its starting value. There followed seven years where the state s public sector construction index was well below its value and it was not until that the index again exceeded 100. Unfortunately, in it once again fell below the starting value to
42 TASMANIA In both South Australia and Tasmania there have been large fluctuations in public sector infrastructure construction. What distinguishes the two is the direction of the trends. Tasmania had a share of national public sector infrastructure construction higher than its share of gross national product which was reinforced by a relatively strong upwards trend in real construction. Throughout the 10-year period the Tasmanian public sector infrastructure index has been well above its starting value. SOUTH AUSTRALIA South Australia also had a share of national public sector infrastructure construction above its share of national gross product, but in this case it was accompanied by a downwards trend in real public sector infrastructure construction. During the early part of the decade infrastructure construction increased strongly, albeit with fairly large annual fluctuations. In both and the construction index exceeded 145. This period was followed by several years of lower activity with a low point of 79.1 in Construction has since rebounded with three years of growth which left the index at in Unfortunately, the rebound was not strong enough to offset the negative trend. 6.4 The ACT and Northern Territory Finally, Figure 6.4 compares the public sector infrastructure trends in the territories with Australia as a whole. NORTHERN TERRITORY Both Figures 6.3 and 6.4 show that the smaller the jurisdiction the larger the fluctuations in infrastructure construction. In the case of the Northern Territory, public sector infrastructure construction increased during the early years of the decade to a peak over 50% higher than in before falling to a low of 71.8 in , well below the starting value. Construction then increased to a new peak of in before easing back to in

43 AUSTRALIAN CAPITAL TERRITORY The range of variability was even greater in the Australian Capital Territory, with peaks of in and in This reflected the effect of large developments in a small jurisdiction, such as the new Cotter Dam and the light rail project. Both territories have shares of national public sector infrastructure that are less than their shares of national gross product. With reservations associated with the variability of infrastructure construction both, territories have positive trends. SUMMARY Considering the perspective over the past decade, there were four jurisdictions that show evidence of an upwards trend in public sector engineering construction on infrastructure. These are Victoria, Tasmania and the two territories which, combined, accounted for on average 18.9% of construction. There were also four jurisdictions that showed evidence of downwards trends in public sector engineering construction on infrastructure and these accounted for on average 81.1% of construction. These were NSW, Queensland, South Australia and Western Australia. In other words, the negative national trend reflects the negative trends in these jurisdictions, particularly NSW. 6.5 Jurisdictional performance against Figure 6.5 takes a more recent perspective by comparing public sector infrastructure completed in jurisdictions in and to the starting value in From the low point in , NSW reproduced the outcome in and exceeded it last year. 39
44 Victoria was well above the starting value in each of the last two years but its share of public sector infrastructure completed was low compared to its national gross product share. Queensland was well down on the starting values and Western Australia was marginally lower. The smaller jurisdictions were typically well above the beginning of the decade but this was offset by their small shares of gross national product. At national level, these results translate into a result below the beginning of the decade and a result above it. The key drivers of infrastructure investment are generally held to be economic and population growth. In this section we compare national trends in engineering construction on infrastructure to economic and population indicators. Engineering construction and the economy are measured in different ways and we facilitate comparison using index numbers with the same reservations as expressed in section 6. 40
45 7 Comparison to key drivers 7.1 Comparison to Gross National Product Figure 7.1 illustrates the comparison between gross national product and public sector engineering construction on infrastructure 12. Engineering construction on infrastructure statistics are those previously discussed. To highlight the effect of the resources boom on overall engineering construction on infrastructure we include the private sector trend. Australia s economy has steadily expanded since For the first few years, public sector engineering construction on infrastructure grew ahead of the economy, but from this changed and growth in public sector infrastructure construction has lagged economic growth and continues to do so. The upswing since the low point has improved the comparison, but the key conclusion is that public sector engineering construction on infrastructure has lagged behind growth in the economy since The influence of resources sector infrastructure development in the private sector is clearly evident in the bulge in construction between and Not all of this bulge was exclusively resources related and includes a number of relatively large private sector toll road projects in capital cities. As resources sector construction concluded, private sector engineering construction on 12 The economic indicator used was the ABS expenditure based estimates of gross domestic product in chain volume form. See ABS, Australian National Accounts, National Income, Expenditure and Product, Cat No , 2018, 41
46 infrastructure slowed to well below economic growth, but has also improved in recent years. The importance of this graph is that it illustrates how overall figures for engineering construction can create the impression that infrastructure development has been higher than it actually is. 7.2 Comparison to Population Growth Our second comparison is between public sector engineering construction on infrastructure and population. Population statistics up to and including 2017 were obtained for Australia as a whole and for Sydney and Melbourne 13. Figure 7.2 illustrates the comparison of trends, again using index numbers. Population figures for were not yet available so evaluation should take into account the improvement in infrastructure in The comparison shows that since , public sector engineering construction on infrastructure has lagged national population growth by substantial margins. Since , the gap between population and infrastructure construction has narrowed but remains quite high. Population growth in Sydney has tracked a trend similar to national growth, but started to outstrip it from about Population growth in Melbourne has been faster than in Sydney and nationally since This simple comparison affirms why the link between population growth and infrastructure planning is critical. Overall, these comparisons show that public sector engineering construction on infrastructure have lagged both economic and population growth. Matters have improved through the emphasis on infrastructure development since , but a lot more is needed. 13 ABS, Regional Population Australia, Cat No , April 2018, 42

47
48 8 Overall assessment 8.1 Changes in Asset Classes In the public sector, three asset classes had upwards trends over the decade reviewed: roads, railways and telecommunications: They accounted for, on average, 59.6% of public sector engineering construction on infrastructure over the decade. The remaining six asset classes had downwards trends. In , overall public sector engineering construction on infrastructure was almost identical to that in in real terms. This result occurred as a result of increases in road, railways, pipelines and telecommunications construction that were fully offset by reductions in construction of bridges, harbours, water and sewerage facilities and electricity. In , public sector engineering construction on infrastructure moved ahead of the level, continuing the growth momentum following the low point. Those asset classes that were below the level the previous year were still well below this level in , although small increases were recorded. Most of the change to above construction was the result of increased construction of roads and railways. Telecommunications construction decreased relative to the previous year but continued to be well above the level. In , 66.2% of public sector engineering construction on infrastructure was accounted for by roads, railways, harbours and bridges. In the private sector, only two asset classes showed increasing trends over the decade: electricity and telecommunications. They accounted for an average 41.0% of private sector construction. Three asset classes, railways, harbours and pipelines, showed boom/bust cycles that were likely the result of construction complementary to resources projects. This construction accounted for an average 29.2% of the decade s construction. The remaining four asset classes accounted for an average 29.8% of the decade s construction showed downwards trends. A common feature of both public and private sectors is that numerous asset categories had construction levels in well below levels. The key driver in the public sector was transport related construction and telecommunications. Telecommunications was also a substantial contributor to the overall private sector result, together with construction of electricity facilities. Last year was the best year of the past five for infrastructure construction, with public sector construction rising above an early decade peak. Likewise, private sector infrastructure construction has moved beyond its strong emphasis on construction complementary to the resources boom and shrugged off three years of construction levels below levels. These are important gains. However, the current upswing in infrastructure construction underway since is really compensating for a downwards cycle in construction over the four years before then. 44
49 8.2 Changes in States and Territories The national downwards trend in the public sector was primarily due to downwards trends in infrastructure construction completed in NSW, Queensland, South Australia and Western Australia. These jurisdictions together accounted for an average 81.2% of national public sector infrastructure construction over the 10 years reviewed. Upwards trends in Victoria, Tasmania and the territories accounted for just 18.8%, and their influence was offset by comparative size. These statistics were mirrored by new commencement trends, suggesting a continuation of recent figures. Queensland, Western Australia and Northern Territory private sector infrastructure construction included large amounts related to resources sector developments until the last two to three years. Taking these influences into account shows that infrastructure construction trends by the private sector has been very similar to that of the public sector. The largest jurisdiction that showed an upwards trend was Victoria and this was insufficient to offset an overall downwards trend. In the last two years, public sector infrastructure completed has increased in all jurisdictions except Western Australia and Tasmania. In the two resources states, Queensland and Western Australia, infrastructure completed remains less than at the beginning of the decade; quite a long way short in the former. The large increase in Victoria is offset by that state s low share of national public sector infrastructure completed. Public sector infrastructure completed has grown in the smaller jurisdictions, but the effect on the national result is minor. Indeed, the national outcome reflects that, in NSW, public sector infrastructure completed in equalled the first year of the decade and exceeded it in Economic and Population Growth In the early part of the decade public sector engineering construction on infrastructure grew ahead of the economy. But, from , this changed and growth in public sector infrastructure construction has lagged economic growth and continues to do so. The upswing since the low point has improved the comparison, but the key conclusion still holds. Similarly, since , public sector engineering construction on infrastructure has lagged national population growth by substantial margins. Again since , the gap between population and infrastructure growth has narrowed but it still remains quite high. The situation in Melbourne, where population growth has been faster than at the national level, is more acute. 8.4 Effectiveness of Infrastructure Decisions Connecting infrastructure requirements to population and economic growth is what economics prescribes. However, based on the announcements made during the 2016 federal election campaign and the so-called super Saturday by-elections, one could be forgiven for believing that infrastructure decisions are primarily political decisions. Infrastructure decisions that originate as political promises may or may not be economically effective. As long ago as 2003, Engineers Australia advocated for the establishment of a National Infrastructure Council to ensure that major infrastructure decisions were taken consistent with economic principles and well determined priorities. The subsequent formation of Infrastructure Australia in 2008 was consistent with our views. Infrastructure Australia has designed and articulated rigorous analytical frameworks for project analysis and has undertaken extensive research into national priorities 45
50 as the basis for final decision making by the political system. Recently, the Grattan Institute compared announcements relating to infrastructure made by Labor, Coalition and Greens parties in the 2016 Federal elections to the method used by Infrastructure Australia to categorise prospective infrastructure projects 14. The three categories used by Infrastructure Australia are: A project is defined by having a full business case and a benefit-cost that shows the project is worth doing. Some proposals have full business cases developed but the benefit-cost is too low to be worth doing. Initiatives are proposals that do not yet have a full business case in place. The Grattan Institute analysis shows that geographically projects were biased towards Queensland, and the majority of money promised was in the third rung of Infrastructure Australia lists or were not on any Infrastructure Australia list. It concluded that all three major parties exhibit a big gap between what they say and what they do reducing the lists of projects to boondoggles (that) are paid for by worthwhile projects that are never built. In other words, the negative infrastructure trends discussed in this report are further eroded by undue political interference in what should be an orderly and thorough decision-making process in the national interest. 8.5 Summary This report reviews trends in engineering construction on infrastructure. The stock of infrastructure assets is the result of accumulation of this construction over time. The report covers the period to In 2010, Engineers Australia undertook an assessment of the status of Australia s infrastructure. The assessment was that national infrastructure was rated as adequate but in need of some major improvements. This was mirrored at state and territory levels with some jurisdictions faring a little better than others. Only one jurisdiction, the Australian Capital Territory, was accorded a good rating. Public sector engineering construction on infrastructure, at the national level and in jurisdictions that accounted for 81% of construction, trended downwards in the 10 years reviewed in this new report. This was despite a surge in construction between and At its height, this surge was well below annual construction achieved during the first five years of the period. The only class of infrastructure to buck this trend was telecommunications, although in the last two years there has been a surge in the construction of electricity sector facilities. Private sector engineering construction is more difficult to evaluate because of the influence of construction of infrastructure specifically to support resources facilities typically remote from population centres. This influence has waned so that over the past few years its effect was not as great. During these years, private sector construction of infrastructure fell to the lowest level in the period covered and was about 44% of total national infrastructure construction. In recent years, public sector infrastructure construction has grown slower than the national economy and slower than population growth. The situation is exacerbated when major political parties choose to announce infrastructure proposals during election campaigns that have not been subject to thorough cost benefit assessment. Based on these factors, Australia s infrastructure has begun to improve in recent years but requires much more well-planned investment to bridge the gap created by almost a decade of underinvestment. 14 Marion Terrill, Election 2016: Will the infrastructure promises meet Australia s needs? 27 June 2016, The Conversation. 46

51 Contact us Public Affairs Engineers Australia 11 National Circuit, Barton ACT 2600 (02) engineersaustralia.org.au facebook.com/engineersaustralia engineersaustralia.org.au/linkedin youtube.com/user/engaustralia