Volume II FWPRDC PN Maximising impact sound resistance of timber framed floor/ceiling systems. Page 183
|
|
|
- Chastity Carter
- 5 years ago
- Views:
Transcription
1 Volume II FWPRDC PN04.05 Maximising impact sound resistance of timber framed floor/ceiling systems Page 183
2 Page 184
3 Table of Contents. 1 PROJECT OVERVIEW INTRODUCTION OVERVIEW OF THE ISSUES OVERVIEW OF EXISTING KNOWLEDGE THE STRUCTURE OF THE RESEARCH PROJECT CONCLUSIONS OF THE ANALYSES SUCCESSFUL FLOOR DESIGNS SUGGESTIONS FOR FURTHER WORK TECHNOLOGY TRANSFER OF OUTPUTS REFERENCES OVERVIEW OF EXISTING FLOOR SYSTEM DESIGNS AND RECENT RESEARCH RESULTS INTRODUCTION EXISTING LOW-FREQUENCY PERFORMANCE UNDERSTANDING EXISTING HIGH-FREQUENCY PERFORMANCE UNDERSTANDING EXISTING LIGHTWEIGHT FLOOR COMPONENTS IN USE AROUND THE WORLD REFERENCES THEORETICAL MODELLING OF A JOIST FLOOR INTRODUCTION PART I: REVIEW OF EXISTING MODELS PART II: OUR MODELLING FOR LTF FLOOR SYSTEMS MODELLING FIBROUS INFILL FURTHER COMPARISON OF THE FLOOR MODEL WITH EXPERIMENTAL RESULTS PART III: MODELLING THE RECEIVING ROOM REFERENCES FLOOR MODEL ANALYSIS INTRODUCTION SINGLE FIGURE RATINGS MM CONCRETE REFERENCE FLOOR FLOOR JOIST PROPERTIES FLOOR UPPER LAYER PROPERTIES CAVITY AND CEILING CONNECTION PROPERTIES CEILING PROPERTIES EFFECTS OF FLOOR SPAN AND ROOM SIZE CONCLUSIONS OF THE TREND ANALYSIS REFERENCES ANALYSIS OF EXPERIMENTAL RESULTS INTRODUCTION EXAMINATION OF THE LOW-FREQUENCY RESULTS EXAMINATION OF THE HIGH-FREQUENCY RESULTS BRIEF EXAMINATION OF THE VIBRATION WAVEFORMS OBSERVED REFERENCES SUBJECTIVE LISTENING TESTS AND ASSESSMENTS INTRODUCTION SUBJECTIVE VERSUS OBJECTIVE TESTING PREVIOUS RESEARCH ON SUBJECTIVE ACCEPTABILITY IEC LISTENING ROOM OBJECTIVE EVALUATION OF PERFORMANCE EXPERIMENTAL SETUP THE SUBJECTS AND THEIR TASK RESULTS AND DISCUSSION WALKING ON BARE FLOOR REFERENCES QUESTIONNAIRES USED IN THE SUBJECTIVE TESTING LOW-FREQUENCY MEASUREMENT RESULTS INTRODUCTION EXPERIMENTAL SETUP EXPERIMENTAL TECHNIQUE Page 185
4 7.4 EXPERIMENTAL RESULTS OVERVIEW DIMENSIONAL VIBRATION PLOTS AVERAGE SURFACE VELOCITY PLOTS REFERENCES HIGH-FREQUENCY MEASUREMENT RESULTS SUMMARY OF THE MEASUREMENT OF IMPACT SOUND INSULATION OF FLOORS THE RESULTS FOR EACH MEASURED FLOOR FLOOR COST COMPARISON PROPERTIES OF MATERIALS USED PANEL PRODUCTS: POURED-ON TOPPINGS/SCREEDS JOISTS INFILL MATERIALS CEILING FIXTURES FLOOR DIAGRAMS AND PHOTOGRAPHS THE TEST CHAMBER REFERENCE CONCRETE FLOOR (FLOOR 0) FLOOR FLOOR FLOOR FLOOR FLOOR FLOOR FLOOR FLOOR FLOOR FLOOR FLOOR FLOOR FLOOR FLOOR FLOOR FLOOR FLOOR FLOOR FLOOR FLOOR FLOOR FLOOR FLOOR FLOOR FLOOR Page 186
5 7 LOW-FREQUENCY MEASUREMENT RESULTS 7.1 INTRODUCTION. This research is primarily concerned with examining the weakest area of timber floor impact sound insulation performance: low-frequency impact sound. It is difficult to measure lowfrequency sound performance of a floor using traditional methods of measuring the sound pressure in a receiving room and normalising for the effect of the room. This is simply because the effect of the room is uncertain at such low frequencies and hence is difficult to factor out. With the above in mind, and because we would like to examine the performance of the floors in detail, it was decided to measure the vibration response of the floor when driven or excited with a known force. This allows the effect of the room to be removed, and if we measure the vibration of the floor over its surface, also allows us to examine how the floor is reacting to the applied forces. This detail of measurement assists greatly in modelling and generally seeing what is happening in the floors. In this section we describe the experimental procedure used to generate the low-frequency vibration measurements. Plots of the average surface velocity of the floors upper surfaces and ceilings will then be presented, as well as plots of predicted sound pressures in a room below. 7.2 EXPERIMENTAL SETUP. The floors were built in the concrete block test chamber. On each floor an electrodynamic shaker was used to provide a vertical force on the floor upper surface. The shaker was connected to the floor through a wire stinger and a reference force transducer. The function of the stinger is to ensure that only vertical forces are transmitted in the floor, while the force transducer enables us to known how much force is being sent into the floor. The shaker body was mounted on a beam which straddled the floor and rested on supports which sat on the concrete collar surrounding the floor. Vibration isolation of the beam from the concrete collar was provided by very resilient pads made of polyester fibre infill. The shaker was driven with pseudorandom signal with a bandwidth from 10Hz to 0Hz, for a duration of 2 seconds (to get a frequency resolution of 0.5Hz). The shaker/force transducer setup used to achieve this is shown in Figure 7-1 and Figure 7-2. Page 187
 was used to measure the")

6 Figure 7-1. View of the shaker attached to a floor to send vibrations into the floor. Shaker Force Transducer Figure 7-2. Close-up of shaker and force transducer used to vibrate the floor A scanning laser vibrometer (Polytec PSV 0) was used to measure the velocity of the floor and ceiling normal to the surface. A grid with a spatial resolution of 10-14cm was used to obtain a map of the surface velocity of the floor and ceiling relative to the input force; both amplitude and phase information was recorded at each frequency. The scanning laser Page 188

7 vibrometer used to measure the vibration of the upper surface of the floor is shown in Figure 7-3 and Figure 7-4. The scanning laser vibrometer was also used to measure the vibration of the ceiling surface and this set up is shown in Figure 7-5. Scanning Laser Vibrometer Figure 7-3. Overview of the shaker and the scanning laser vibrometer for measurement of floor vibration response. The scanning laser vibrometer is mounted on a gantry made from I-beams 2.6m above the floor. There are two gantries to enable the whole upper surface of the floor to be scanned. Page 189


8 Figure 7-4. Close-up of the scanning laser vibrometer as supported in the gantry. The laser vibrometer is supported in a trolley, which can roll along the flanges of the I-beams, enabling the laser vibrometer to be moved to different sections of the floor. Figure 7-5. The scanning laser vibrometer as used to measure the vibration of the ceiling in response to the shaker force. Page 190
9 7.3 EXPERIMENTAL TECHNIQUE. For each floor, the shaker was connected to the upper surface through a force transducer as illustrated above. The position on the floor was selected so that the low-frequency modes would be excited. Only one position on each floor was chosen. It is often useful to select two or more positions on a structure to ensure a sufficient number of modes are excited, and to act as a check for results. However, in this case, it would have taken too long to do two complete vibration response scans of each floor. Once the shaker was connected to the floor the scanning laser vibrometer was positioned over the floor upper surface to measure the surface velocity of the floor upper in the direction normal to the surface of the floor. The scanning laser vibrometer was supported in a mobile cradle and mounted on two gantries over the floor so that it point down to the floor and scan the surface. For each can the area that could be measured was about 1.8m by 1.8m, hence eight positions were required to scan the whole surface of the floor. The scanning laser vibrometer measurement equipment was also connected to the force transducer so that the recorded surface vibration is normalised with respect to the force applied. The signal sent to the shaker was a pseudorandom noise filtered by a low-pass filter (0Hz corner frequency) with a period of 2 seconds (±µs), which matched with the sampling time of the laser vibrometer software. This ensured minimal spectral leakage and a frequency resolution of 0.5Hz. After measuring the upper surface, the scanning laser vibrometer was placed in its cradle on the floor under the ceiling of the floor to be tested, pointing up to the ceiling. It was then used to scan the surface of the ceiling. This was repeated in different positions to cover the whole ceiling. After the scans of the floor vibration were made, the results of the measurements of surface vibration over the floor were extracted from the Polytec scanning software into a form easily readable by other software. The program used to do this was specially written for the project. The data was then compiled by software specially written for this project to enable overall surface velocity of the floor upper and ceiling to be plotted as well as animated pictures of the response of the floor upper surface and ceiling to be generated. 7.4 EXPERIMENTAL RESULTS OVERVIEW The data available from the experimental results is enormous: there are about 00 measured points each containing 1000 vibration frequencies. For the purposes of this report, we will restrict ourselves to examining a frequency range of 10Hz to 0Hz, which contains the lowfrequency region we are interested in. For each floor we will look at the overall, average surface velocity response to the applied dynamic force. We will also examine some 3D plots of the surface to illustrate some regions of interest. We note that there are two sizes of floors: - floors 3.2m wide, spanning 7m - floor3 3.2m wide, spanning 5.5m. Each floor size has the shaker excitation point located at a different place: for 7m spans it is at 2510mm in from the joist ends, and 965mm in from the side of the floor this is designated position C; for 5.5m spans it is at 1875mm in from the joist ends, and 965mm in from the side of the floor this is designated position E. Page 191
10 Another floor size was examined, this was only 1.3m long, and the shaker position was position F (4mm in from the joist ends, and 965mm in from the side of the floor). It was tested without a ceiling, but was not considered further. The results are included for completeness DIMENSIONAL VIBRATION PLOTS Software was written to allow the plotting of 3-dimensional plots of the upper surfaces and ceilings of the floors for every frequency measured. This software also allows animations of the floors to be produced. An example of this for Floor 10 is shown in Figure Such 3D plots will be produced to illustrate certain aspects of the floors in the experimental analysis section of the report. Displacement per unit force at 23Hz, and at phase 0 relative to force x Vertical displacement (m) x (m) y (m) Figure 7-6. Illustration of mode (1,2) of floor 10. Note that the phase with respect to the force is 0 in this illustration. 7.6 AVERAGE SURFACE VELOCITY PLOTS In this section the data from each measured floor is presented as a root-mean-square average over the entire surface when the force applied to the floor is 1N for each frequency. This way an overall trend can be seen, especially when we are examining different floors. Since different vibrational modes present in the ceiling couple into the room below differently, one other useful thing to look at is the average sound pressure in a room below the ceiling. This is achieved by predicting what effect a rectangular room 2.5m high (with the other dimensions Page 192
11 being the same as the floor) would have on the sound produced by the floor. It is assumed that the room has an absorption coefficient of This is concluded to be the approximate case for plasterboard-lined light-framed rooms from work by Maluski and Gibbs (04). Page 193
12 Floor 2. <v 2 >, 7 x 3.2 m Floor 2 Upper, F in =1 N at pos C. 70 <v 2 >, db (re: 5x10⁻⁸ m/s) Frequency (Hz) <v 2 >, 7 x 3.2 m Floor 2 ceiling, F in =1 N at pos C. 70 <v 2 >, db (re: 5x10⁻⁸ m/s) Frequency (Hz) Figure 7-7. Averaged surface velocity plots in db for Floor 2 as a function of frequency for both the upper part of the floor and the ceiling. As measured by the scanning laser vibrometer, generated by the force at position C and normalised against the amplitude of the applied force (F in ) for each frequency. Page 194
13 <p 2 >, 7 x 3.2 m Floor 2, F in =1 N at pos C. Room 7x3.2x2.5m α= <p 2 >, db (re: x10-6 Pa) Frequency (Hz) Figure 7-8. Averaged sound pressure in db for Floor 2 calculated for a room 2.5m high and with a sound absorption coefficient of 0.15 over its surfaces. Generated by the force at position C and normalised against the amplitude of the applied force (F in ). Page 195
14 Floor 3. <v 2 >, 7 x 3.2 m Floor 3 Upper, F in =1 N at pos C. 70 <v 2 >, db (re: 5x10⁻⁸ m/s) Frequency (Hz) <v 2 >, 7 x 3.2 m Floor 3 ceiling, F in =1 N at pos C. 70 <v 2 >, db (re: 5x10⁻⁸ m/s) Frequency (Hz) Figure 7-9. Averaged surface velocity plots in db for Floor 3 as a function of frequency for both the upper part of the floor and the ceiling. As measured by the scanning laser vibrometer, generated by the force at position C and normalised against the amplitude of the applied force (F in ) for each frequency. Page 196
15 <p 2 >, 7 x 3.2 m Floor 3, F in =1 N at pos C. Room 7x3.2x2.5m α= <p 2 >, db (re: x10-6 Pa) Frequency (Hz) Figure Averaged sound pressure in db for Floor 3 calculated for a room 2.5m high and with a sound absorption coefficient of 0.15 over its surfaces. Generated by the force at position C and normalised against the amplitude of the applied force (F in ). Page 197
16 Floor 4. <v 2 >, 7 x 3.2 m Floor 4 Upper, F in =1 N at pos C. 70 <v 2 >, db (re: 5x10⁻⁸ m/s) Frequency (Hz) <v 2 >, 7 x 3.2 m Floor 4 ceiling, F in =1 N at pos C. 70 <v 2 >, db (re: 5x10⁻⁸ m/s) Frequency (Hz) Figure Averaged surface velocity plots in db for Floor 4 as a function of frequency for both the upper part of the floor and the ceiling. As measured by the scanning laser vibrometer, generated by the force at position C and normalised against the amplitude of the applied force (F in ) for each frequency. Page 198
17 <p 2 >, 7 x 3.2 m Floor 4, F in =1 N at pos C. Room 7x3.2x2.5m α= <p 2 >, db (re: x10-6 Pa) Frequency (Hz) Figure Averaged sound pressure in db for Floor 4 calculated for a room 2.5m high and with a sound absorption coefficient of 0.15 over its surfaces. Generated by the force at position C and normalised against the amplitude of the applied force (F in ). Page 199
18 Floor 5. <v 2 >, 7 x 3.2 m Floor 5 Upper, F in =1 N at pos C. 70 <v 2 >, db (re: 5x10⁻⁸ m/s) Frequency (Hz) <v 2 >, 7 x 3.2 m Floor 5 ceiling, F in =1 N at pos C. 70 <v 2 >, db (re: 5x10⁻⁸ m/s) Frequency (Hz) Figure Averaged surface velocity plots in db for Floor 5 as a function of frequency for both the upper part of the floor and the ceiling. As measured by the scanning laser vibrometer, generated by the force at position C and normalised against the amplitude of the applied force (F in ) for each frequency. Page 0
19 <p 2 >, 7 x 3.2 m Floor 5, F in =1 N at pos C. Room 7x3.2x2.5m α= <p 2 >, db (re: x10-6 Pa) Frequency (Hz) Figure Averaged sound pressure in db for Floor 5 calculated for a room 2.5m high and with a sound absorption coefficient of 0.15 over its surfaces. Generated by the force at position C and normalised against the amplitude of the applied force (F in ). Page 1
20 Floor 6. <v 2 >, 7 x 3.2 m Floor 6 Upper, F in =1 N at pos C. 70 <v 2 >, db (re: 5x10⁻⁸ m/s) Frequency (Hz) <v 2 >, 7 x 3.2 m Floor 6 ceiling, F in =1 N at pos C. 70 <v 2 >, db (re: 5x10⁻⁸ m/s) Frequency (Hz) Figure Averaged surface velocity plots in db for Floor 6 as a function of frequency for both the upper part of the floor and the ceiling. As measured by the scanning laser vibrometer, generated by the force at position C and normalised against the amplitude of the applied force (F in ) for each frequency. Page 2
21 <p 2 >, 7 x 3.2 m Floor 6, F in =1 N at pos C. Room 7x3.2x2.5m α= <p 2 >, db (re: x10-6 Pa) Frequency (Hz) Figure Averaged sound pressure in db for Floor 6 calculated for a room 2.5m high and with a sound absorption coefficient of 0.15 over its surfaces. Generated by the force at position C and normalised against the amplitude of the applied force (F in ). Page 3
22 Floor 7. <v 2 >, 7 x 3.2 m Floor 7 Upper, F in =1 N at pos C. 70 <v 2 >, db (re: 5x10⁻⁸ m/s) Frequency (Hz) <v 2 >, 7 x 3.2 m Floor 7 ceiling, F in =1 N at pos C. 70 <v 2 >, db (re: 5x10⁻⁸ m/s) Frequency (Hz) Figure Averaged surface velocity plots in db for Floor 7 as a function of frequency for both the upper part of the floor and the ceiling. As measured by the scanning laser vibrometer, generated by the force at position C and normalised against the amplitude of the applied force (F in ) for each frequency. Page 4
23 <p 2 >, 7 x 3.2 m Floor 7, F in =1 N at pos C. Room 7x3.2x2.5m α= <p 2 >, db (re: x10-6 Pa) Frequency (Hz) Figure Averaged sound pressure in db for Floor 7 calculated for a room 2.5m high and with a sound absorption coefficient of 0.15 over its surfaces. Generated by the force at position C and normalised against the amplitude of the applied force (F in ). Page 5
24 Floor 8. <v 2 >, 5.5 x 3.2 m Floor 8 Upper, F in =1 N at pos E. 70 <v 2 >, db (re: 5x10⁻⁸ m/s) Frequency (Hz) <v 2 >, 5.5 x 3.2 m Floor 8 ceiling, F in =1 N at pos E. 70 <v 2 >, db (re: 5x10⁻⁸ m/s) Frequency (Hz) Figure Averaged surface velocity plots in db for Floor 8 as a function of frequency for both the upper part of the floor and the ceiling. As measured by the scanning laser vibrometer, generated by the force at position E and normalised against the amplitude of the applied force (F in ) for each frequency. Page 6
25 <p 2 >, 5.5 x 3.2 m Floor 8, F in =1 N at pos E. Room 5.5x3.2x2.5m α= <p 2 >, db (re: x10-6 Pa) Frequency (Hz) Figure 7-. Averaged sound pressure in db for Floor 8 calculated for a room 2.5m high and with a sound absorption coefficient of 0.15 over its surfaces. Generated by the force at position E and normalised against the amplitude of the applied force (F in ). Page 7
26 Floor 9. <v 2 >, 5.5 x 3.2 m Floor 9 Upper, F in =1 N at pos E. 70 <v 2 >, db (re: 5x10⁻⁸ m/s) Frequency (Hz) <v 2 >, 5.5 x 3.2 m Floor 9 ceiling, F in =1 N at pos E. 70 <v 2 >, db (re: 5x10⁻⁸ m/s) Frequency (Hz) Figure Averaged surface velocity plots in db for Floor 9 as a function of frequency for both the upper part of the floor and the ceiling. As measured by the scanning laser vibrometer, generated by the force at position E and normalised against the amplitude of the applied force (F in ) for each frequency. Page 8
27 70 <p 2 >, 5.5 x 3.2 m Floor 9, F in =1 N at pos E. Room 5.5x3.2x2.5m α=0.15 <p 2 >, db (re: x10-6 Pa) Frequency (Hz) Figure Averaged sound pressure in db for Floor 9 calculated for a room 2.5m high and with a sound absorption coefficient of 0.15 over its surfaces. Generated by the force at position E and normalised against the amplitude of the applied force (F in ). Page 9
28 Floor <v 2 >, 5.5 x 3.2 m Floor 10 Upper, F in =1 N at pos E. <v 2 >, db (re: 5x10⁻⁸ m/s) Frequency (Hz) Figure Averaged surface velocity plot in db for Floor 10 as a function of frequency for the upper part of the floor (there is no ceiling). As measured by the scanning laser vibrometer, generated by the force at position E and normalised against the amplitude of the applied force (F in ) for each frequency. Page 210
29 Floor <v 2 >, 1.3 x 3.2 m Floor 11 Upper, F in =1 N at pos F. <v 2 >, db (re: 5x10⁻⁸ m/s) Frequency (Hz) Figure Averaged surface velocity plot in db for Floor 11 as a function of frequency for the upper part of the floor (there is no ceiling). As measured by the scanning laser vibrometer, generated by the force at position F and normalised against the amplitude of the applied force (F in ) for each frequency. Page 211
30 Floor <v 2 >, 5.5 x 3.2 m Floor 12 Upper, F in =1 N at pos E. 90 <v 2 >, db (re: 5x10⁻⁸ m/s) Frequency (Hz) Figure Averaged surface velocity plot in db for Floor 12 as a function of frequency for the upper part of the floor (there is no ceiling). As measured by the scanning laser vibrometer, generated by the force at position E and normalised against the amplitude of the applied force (F in ) for each frequency. Page 212
31 Floor <v 2 >, 5.5 x 3.2 m Floor 13 Upper, F in =1 N at pos E. <v 2 >, db (re: 5x10⁻⁸ m/s) Frequency (Hz) Figure Averaged surface velocity plot in db for Floor 13 as a function of frequency for the upper part of the floor (there is no ceiling). As measured by the scanning laser vibrometer, generated by the force at position E and normalised against the amplitude of the applied force (F in ) for each frequency. Page 213
32 Floor <v 2 >, 5.5 x 3.2 m Floor 14 Upper, F in =1 N at pos E. <v 2 >, db (re: 5x10⁻⁸ m/s) Frequency (Hz) <v 2 >, 5.5 x 3.2 m Floor 14 ceiling, F in =1 N at pos E. 70 <v 2 >, db (re: 5x10⁻⁸ m/s) Frequency (Hz) Figure Averaged surface velocity plots in db for Floor 14 as a function of frequency for both the upper part of the floor and the ceiling. As measured by the scanning laser vibrometer, generated by the force at position E and normalised against the amplitude of the applied force (F in ) for each frequency. Page 214
33 70 <p 2 >, 5.5 x 3.2 m Floor 14, F in =1 N at pos E. Room 5.5x3.2x2.5m α=0.15 <p 2 >, db (re: x10-6 Pa) Frequency (Hz) Figure Averaged sound pressure in db for Floor 14 calculated for a room 2.5m high and with a sound absorption coefficient of 0.15 over its surfaces. Generated by the force at position E and normalised against the amplitude of the applied force (F in ). Page 215
34 Floor 15. <v 2 >, 5.5 x 3.2 m Floor 15 Upper, F in =1 N at pos E. 70 <v 2 >, db (re: 5x10⁻⁸ m/s) Frequency (Hz) Figure Averaged surface velocity plot in db for Floor 15 as a function of frequency for the upper part of the floor (there is no ceiling). As measured by the scanning laser vibrometer, generated by the force at position E and normalised against the amplitude of the applied force (F in ) for each frequency. Page 216
35 Floor 17. <v 2 >, 5.5 x 3.2 m Floor 17 Upper, F in =1 N at pos E. 70 <v 2 >, db (re: 5x10⁻⁸ m/s) Frequency (Hz) <v 2 >, 5.5 x 3.2 m Floor 17 ceiling, F in =1 N at pos E. 70 <v 2 >, db (re: 5x10⁻⁸ m/s) Frequency (Hz) Figure 7-. Averaged surface velocity plots in db for Floor 17 as a function of frequency for both the upper part of the floor and the ceiling. As measured by the scanning laser vibrometer, generated by the force at position E and normalised against the amplitude of the applied force (F in ) for each frequency. Page 217
36 70 <p 2 >, 5.5 x 3.2 m Floor 17, F in =1 N at pos E. Room 5.5x3.2x2.5m α=0.15 <p 2 >, db (re: x10-6 Pa) Frequency (Hz) Figure Averaged sound pressure in db for Floor 17 calculated for a room 2.5m high and with a sound absorption coefficient of 0.15 over its surfaces. Generated by the force at position E and normalised against the amplitude of the applied force (F in ). Page 218
37 Floor 18. <v 2 >, 5.5 x 3.2 m Floor 18 Upper, F in =1 N at pos E. 70 <v 2 >, db (re: 5x10⁻⁸ m/s) Frequency (Hz) <v 2 >, 5.5 x 3.2 m Floor 18 ceiling, F in =1 N at pos E. 70 <v 2 >, db (re: 5x10⁻⁸ m/s) Frequency (Hz) Figure Averaged surface velocity plots in db for Floor 18 as a function of frequency for both the upper part of the floor and the ceiling. As measured by the scanning laser vibrometer, generated by the force at position E and normalised against the amplitude of the applied force (F in ) for each frequency. Page 219
38 70 <p 2 >, 5.5 x 3.2 m Floor 18, F in =1 N at pos E. Room 5.5x3.2x2.5m α=0.15 <p 2 >, db (re: x10-6 Pa) Frequency (Hz) Figure Averaged sound pressure in db for Floor 18 calculated for a room 2.5m high and with a sound absorption coefficient of 0.15 over its surfaces. Generated by the force at position E and normalised against the amplitude of the applied force (F in ). Page 2
39 Floor 19. <v 2 >, 5.5 x 3.2 m Floor 19 Upper, F in =1 N at pos E. 70 <v 2 >, db (re: 5x10⁻⁸ m/s) Frequency (Hz) <v 2 >, 5.5 x 3.2 m Floor 19 ceiling, F in =1 N at pos E. 70 <v 2 >, db (re: 5x10⁻⁸ m/s) Frequency (Hz) Figure Averaged surface velocity plots in db for Floor 19 as a function of frequency for both the upper part of the floor and the ceiling. As measured by the scanning laser vibrometer, generated by the force at position E and normalised against the amplitude of the applied force (F in ) for each frequency. Page 221
40 70 <p 2 >, 5.5 x 3.2 m Floor 19, F in =1 N at pos E. Room 5.5x3.2x2.5m α=0.15 <p 2 >, db (re: x10-6 Pa) Frequency (Hz) Figure Averaged sound pressure in db for Floor 19 calculated for a room 2.5m high and with a sound absorption coefficient of 0.15 over its surfaces. Generated by the force at position E and normalised against the amplitude of the applied force (F in ). Page 222
41 Floor. <v 2 >, 5.5 x 3.2 m Floor Upper, F in =1 N at pos E. 70 <v 2 >, db (re: 5x10⁻⁸ m/s) Frequency (Hz) <v 2 >, 5.5 x 3.2 m Floor ceiling, F in =1 N at pos E. 70 <v 2 >, db (re: 5x10⁻⁸ m/s) Frequency (Hz) Figure Averaged surface velocity plots in db for Floor as a function of frequency for both the upper part of the floor and the ceiling. As measured by the scanning laser vibrometer, generated by the force at position E and normalised against the amplitude of the applied force (F in ) for each frequency. Page 223
42 70 <p 2 >, 5.5 x 3.2 m Floor, F in =1 N at pos E. Room 5.5x3.2x2.5m α=0.15 <p 2 >, db (re: x10-6 Pa) Frequency (Hz) Figure Averaged sound pressure in db for Floor calculated for a room 2.5m high and with a sound absorption coefficient of 0.15 over its surfaces. Generated by the force at position E and normalised against the amplitude of the applied force (F in ). Page 224
43 Floor 21. <v 2 >, 5.5 x 3.2 m Floor 21 Upper, F in =1 N at pos E. 70 <v 2 >, db (re: 5x10⁻⁸ m/s) Frequency (Hz) <v 2 >, 5.5 x 3.2 m Floor 21 ceiling, F in =1 N at pos E. 70 <v 2 >, db (re: 5x10⁻⁸ m/s) Frequency (Hz) Figure Averaged surface velocity plots in db for Floor 21 as a function of frequency for both the upper part of the floor and the ceiling. As measured by the scanning laser vibrometer, generated by the force at position E and normalised against the amplitude of the applied force (F in ) for each frequency. Page 225
44 <v 2 >, 5.5 x 3.2 m Floor 21 Upper, F in =1 N at pos E. 70 <v 2 >, db (re: 5x10⁻⁸ m/s) Frequency (Hz) Figure Averaged sound pressure in db for Floor 21 calculated for a room 2.5m high and with a sound absorption coefficient of 0.15 over its surfaces. Generated by the force at position E and normalised against the amplitude of the applied force (F in ). Page 226
45 Floor 22. <v 2 >, 5.5 x 3.2 m Floor 22 Upper, F in =1 N at pos E. 70 <v 2 >, db (re: 5x10⁻⁸ m/s) Frequency (Hz) <v 2 >, 5.5 x 3.2 m Floor 22 ceiling, F in =1 N at pos E. 70 <v 2 >, db (re: 5x10⁻⁸ m/s) Frequency (Hz) Figure 7-. Averaged surface velocity plots in db for Floor 22 as a function of frequency for both the upper part of the floor and the ceiling. As measured by the scanning laser vibrometer, generated by the force at position E and normalised against the amplitude of the applied force (F in ) for each frequency. Page 227
46 70 <p 2 >, 5.5 x 3.2 m Floor 22, F in =1 N at pos E. Room 5.5x3.2x2.5m α=0.15 <p 2 >, db (re: x10-6 Pa) Frequency (Hz) Figure Averaged sound pressure in db for Floor 22 calculated for a room 2.5m high and with a sound absorption coefficient of 0.15 over its surfaces. Generated by the force at position E and normalised against the amplitude of the applied force (F in ). Page 228
47 Floor 23. <v 2 >, 5.5 x 3.2 m Floor 23 Upper, F in =1 N at pos E. 70 <v 2 >, db (re: 5x10⁻⁸ m/s) Frequency (Hz) <v 2 >, 5.5 x 3.2 m Floor 23 ceiling, F in =1 N at pos E. 70 <v 2 >, db (re: 5x10⁻⁸ m/s) Frequency (Hz) Figure Averaged surface velocity plots in db for Floor 23 as a function of frequency for both the upper part of the floor and the ceiling. As measured by the scanning laser vibrometer, generated by the force at position E and normalised against the amplitude of the applied force (F in ) for each frequency. Page 229
48 70 <p 2 >, 5.5 x 3.2 m Floor 23, F in =1 N at pos E. Room 5.5x3.2x2.5m α=0.15 <p 2 >, db (re: x10-6 Pa) Frequency (Hz) Figure Averaged sound pressure in db for Floor 23 calculated for a room 2.5m high and with a sound absorption coefficient of 0.15 over its surfaces. Generated by the force at position E and normalised against the amplitude of the applied force (F in ). Page 2
49 Floor 24. <v 2 >, 5.5 x 3.2 m Floor 24 ceiling, F in =1 N at pos E. 70 <v 2 >, db (re: 5x10⁻⁸ m/s) Frequency (Hz) Figure Averaged surface velocity plots in db for Floor 24 as a function of frequency for the ceiling. As measured by the scanning laser vibrometer, generated by the force at position E and normalised against the amplitude of the applied force (F in ) for each frequency. 70 <p 2 >, 5.5 x 3.2 m Floor 24, F in =1 N at pos E. Room 5.5x3.2x2.5m α=0.15 <p 2 >, db (re: x10-6 Pa) Frequency (Hz) Figure Averaged sound pressure in db for Floor 24 calculated for a room 2.5m high and with a sound absorption coefficient of 0.15 over its surfaces. Generated by the force at position E and normalised against the amplitude of the applied force (F in ). Page 231
50 Floor 25. <v 2 >, 5.5 x 3.2 m Floor 25 ceiling, F in =1 N at pos E. 70 <v 2 >, db (re: 5x10⁻⁸ m/s) Frequency (Hz) Figure Averaged surface velocity plots in db for Floor 25 as a function of frequency for the ceiling. As measured by the scanning laser vibrometer, generated by the force at position E and normalised against the amplitude of the applied force (F in ) for each frequency. 70 <p 2 >, 5.5 x 3.2 m Floor 25, F in =1 N at pos E. Room 5.5x3.2x2.5m α=0.15 <p 2 >, db (re: x10-6 Pa) Frequency (Hz) Figure Averaged sound pressure in db for Floor 25 calculated for a room 2.5m high and with a sound absorption coefficient of 0.15 over its surfaces. Generated by the force at position E and normalised against the amplitude of the applied force (F in ). Page 232
51 Floor 26. <v 2 >, 5.5 x 3.2 m Floor 26 ceiling, F in =1 N at pos E. 70 <v 2 >, db (re: 5x10⁻⁸ m/s) Frequency (Hz) Figure Averaged surface velocity plots in db for Floor 26 as a function of frequency for the ceiling. As measured by the scanning laser vibrometer, generated by the force at position E and normalised against the amplitude of the applied force (F in ) for each frequency. 70 <p 2 >, 5.5 x 3.2 m Floor 26, F in =1 N at pos E. Room 5.5x3.2x2.5m α=0.15 <p 2 >, db (re: 2x10⁻⁵ Pa) Frequency (Hz) Figure Averaged sound pressure in db for Floor 26 calculated for a room 2.5m high and with a sound absorption coefficient of 0.15 over its surfaces. Generated by the force at position E and normalised against the amplitude of the applied force (F in ). Page 233
52 7.7 REFERENCES Maluski, S., Gibbs, B.M. (04). The effect of construction material, contents and room geometry on the sound field in dwellings at low frequencies, Applied Acoustics, 65, pp Page 234
53 8 HIGH-FREQUENCY MEASUREMENT RESULTS. In this chapter the high frequency measurements of the floor, as done using the standard tapping machine method, are presented in full. Only test floors with a ceiling were measured in this way: it was felt that measuring floors without ceilings using the tapping machine would not have produced informative results for this project. 8.1 SUMMARY OF THE MEASUREMENT OF IMPACT SOUND INSULATION OF FLOORS. Method. The normalized impact sound pressure levels are obtained in accordance with the recommendations of ISO standard 1-6:1998(E) Laboratory measurements of impact sound insulation of floors. The BK34 tapping machine is placed sequentially in four different positions on the floor. The impact sound pressure level is measured in the receiving room below the floor, using a rotating microphone, in third octave frequency bands. The impact sound pressure levels are normalized against the room absorption. The room absorption is calculated from the reverberation time and room volume. The reverberation time is measured from the decay of a steady state sound field. Results. The third octave band normalized impact sound pressure levels Ln are presented in both table and graph formats. Sometimes a highly reflective test sample means that the lower frequency normalized impact sound pressure levels cannot be reliably measured; this is indicated by #N/A in the table of results. Additionally, sometimes the airborne transmission of sound through the floor or loud background noise affects the measurements resulting in only an upper threshold being found; this is indicated by a < sign preceding the tabulated results. Single figure ratings are also presented. The weighted normalized impact sound pressure level L n,w, determined according to ISO 717-2, is presented along with a spectrum adaptation term C I. L n,w is determined by fitting a reference curve to the third octave band normalized impact sound pressure levels L n from 100Hz to 31Hz, and gives a single figure determination of the sound levels which are transmitted through the floor from impacts (higher is worse). The spectrum adaptation term C I is used to suggest the presence of high level peaks in the results over the frequency range 100Hz to Hz, and may be added to L n,w. For massive floors with effective coverings C I will be about zero, for light timber floors C I will be slightly positive, and for concrete floors with less effective covering C I will range from 15 db to 0dB. Another spectrum adaptation term C I,-, which covers the frequency range from Hz to Hz, may also be presented if the low frequency levels are available. The impact insulation class (IIC) determined according ASTM E989 is also presented. This is determined by fitting a reference curve to the third octave band normalized impact sound pressure levels L n from 100Hz to 31Hz, but in a slightly different way to ISO The impact insulation class measures the insulating abilities of the floor so that higher is better (contrary to L n,w ). Page 235
54 8.2 THE RESULTS FOR EACH MEASURED FLOOR. Floor 0 The concrete reference floor. Normalized Impact sound pressure levels according to ISO 1-6 Date of test: 14-Sep-05 Description and identification of the test specimen and test arrangement: Client: FWPRDC A A concrete light weight based timber floor/ceiling floor/ceiling system system comprising: comprising: 1mm Butt reinforced jointed 15mm concrete plywood floor sheets with a 2700mm suspended x 10mm ceiling comprising: fixed with 0mm mm square long 6mm head Ø threaded screws at rods 1mm fixed centres to steel to plates 0mm glued x 45mm to the LVL underside joists at of 0mm the concrete centres. slab The at 0mm 7m long x LVL 0mm joists centres, are "simply Rondo supported" ceiling at clips the are ends screwed with timber to the blocking threaded between rods and the 35mm ends of GIB the joists, Rondo the furring joists at channels each side are are held seated in the clips. on 100mm The furring x mm channels timber are plates screw-fixed bolted at at 1m either centres end to to the J channels concrete screw-fixed blockwork. The to the floor 25mm cavity x 245mm between timber the LVL perimeter plate. joists 1 is lining lined of with 13mm 2 layers GIB of Standard 1mm thick plasterboard Pink Batts is screw-fixed Silencer Mid at Floor 0mm bulk centres fiberglass to the insulation furring channels, The ceiling the 2mm ceiling comprises: cavity 2 is layers lined with of 13mm 1 layer GIB of Noiseline 75mm Pink Batts plasterboard R1.8 fixed fibreglass with 41mm insulation. screws The at joints 0mm and centres perimeter to 35mm are sealed GIB with Rondo GIB Soundseal steel furring. channels at 0mm centres and the steel perimeter J channel fixed to the timber plates, the furring channels are fixed to the LVL joists with RSIC clips at 0mm centres.the perimeter of the GIB Noiseline plasterboard is sealed with GIB Soundseal and the joints are paper taped and stopped with GIB TradeSet 90 stopping compound. Italics are clients wording Frequency f Hz L n 1/3 Octave db <.4 < 23.7 < Notes:1.#N/A = Value not available. 2. Bold values are used to calculate IIC and Ln,w. 3.< indicates that the true value is lower. Normalized impact sound pressure level, L n, db curve of ASTM E989 reference values. curve of ISO reference values Frequency, f, Hz Rating according to ISO 717-2: Rating according to ASTM E989: L n,w (C I ) = 69 ( -12 ) db Impact Insulation Class = 37 db C I,- = -10 db No. of test report: Floor 0 Bare Name of test institute: University of Auckland Acoustics Testing Service. Page 236
55 Floor 2. Normalized Impact sound pressure levels according to ISO 1-6 Date of test: 29-Dec-04 Description and identification of the test specimen and test arrangement: Client: FWPRDC A light weight timber floor/ceiling system comprising: Butt jointed 15mm plywood sheets 2700mm x 10mm fixed with mm square head screws at 1mm centres to 0mm x 45mm LVL* joists at 0mm centres. The 7m long LVL* joists joists are "simply are "simply supported" supported" at the at ends the with ends timber with timber blocking blocking between between the ends the of ends the of joists, the joists, the joists the joists at each at side each are side seated are seated on 100mm on 100mm x mm x timber mm plates timber bolted plates at bolted 1m centres at 1m centres to the concrete to the concrete blockwork. blockwork. The floor The cavity floor between cavity between the LVL the LVL* joists joists lined is with lined 2 with layers 2 layers of 1mm of 1mm thick Pink thick Batts Pink Batts Silencer Silencer Mid Mid Floor Floor bulk bulk fiberglass fibreglass insulation insulation The The ceiling ceiling comprises: 2 layers of 13mm GIB Noiseline plasterboard fixed with 41mm screws at at 0mm centres to to 35mm GIB Rondo furring steel furring channels channels at 0mm at 0mm centres centres and the and steel the perimeter steel perimeter J channel J channel fixed to fixed the timber to the plates, timber the plates, furring the channels furring channels are fixed are to the fixed LVL to joists the LVL with joists RSIC** with clips RSIC at 0mm clips at 0mm centres. centres.the perimeter perimeter of the GIB of the Noiseline GIB Noiseline plasterboard is sealed with GIB Soundseal and and the the joints are are paper taped and and stopped with with GIB GIB TradeSet stopping compound. Italics are clients wording * LVL Laminated Veneer Lumber ** RSIC Resilient Sound Isolation Clip Frequency f Hz L n 1/3 Octave db Notes:1.#N/A = Value not available. 2. Bold values are used to calculate IIC and Ln,w. 3.< indicates that the true value is lower. Normalized impact sound pressure level, L n, db curve of ASTM E989 reference values. curve of ISO reference values Frequency, f, Hz Rating according to ISO 717-2: Rating according to ASTM E989: L n,w (C I ) = 61 ( -1 ) db Impact Insulation Class = 49 db C I,- = 2 db No. of test report: Bare floor 2 Name of test institute: University of Auckland Acoustics Testing Service. Page 237
56 Floor 3. Normalized Impact sound pressure levels according to ISO 1-6 * ** Date of test: 17-Jan-05 Description and identification of the test specimen and test arrangement: Client: FWPRDC A light weight timber floor/ceiling system comprising: 3 layers of 13mm GIB Soundbarrier sheets 900mm x 10mm, each layer fixed with mm square head screws at 1mm centres to 15mm butt jointed plywood sheets 2700mm x 10mm fixed with mm square head screws at 1mm centres to 0mm x 45mm LVL* joists at 0mm centres. The 7m long LVL* joists are "simply supported" at the ends with timber blocking between the ends of the joists, the joists at each side are seated on 100mm x mm timber plates bolted at 1m centres to the concrete blockwork. The floor cavity between the LVL* joists is lined with 2 layers of 1mm thick Pink Batts Silencer Mid Floor bulk fibreglass insulation. The ceiling comprises: 2 layers of 13mm GIB Noiseline plasterboard fixed with 41mm screws at 0mm centres to 35mm GIB Rondo furring channels at 0mm centres and the steel perimeter J channel fixed to the timber plates, the furring channels are fixed to the LVL* joists with RSIC** clips at 0mm centres. The perimeter of the GIB Noiseline plasterboard is sealed with GIB Soundseal and the joints are paper taped and stopped with GIB TradeSet 90 stopping compound. Italics are clients wording LVL Laminated Veneer Lumber RSIC Resilient Sound Isolation Clip Frequency f Hz L n 1/3 Octave db Notes:1.#N/A = Value not available. 2. Bold values are used to calculate IIC and Ln,w. 3.< indicates that the true value is lower. Normalized impact sound pressure level, L n, db curve of ASTM E989 reference values. curve of ISO reference values Frequency, f, Hz Rating according to ISO 717-2: Rating according to ASTM E989: L n,w (C I ) = 45 ( 1 ) db Impact Insulation Class = 61 db C I,- = 9 db No. of test report: Bare floor 3 Name of test institute: University of Auckland Acoustics Testing Service. Page 238
57 Floor 4. Normalized Impact sound pressure levels according to ISO 1-6 Date of test: 04-Mar-05 Description and identification of the test specimen and test arrangement: Client: FWPRDC A light weight timber floor/ceiling system comprising: 1 x 15mm butt jointed plywood sheets 2700mm x 10mm fixed with mm square head screws at 1mm centres onto 70mm x 45mm battens 70mm side down at 4mm centres angle screwed to 15mm butt jointed plywood sheets 2700mm x 10mm fixed with mm square head screws at 1mm centres to 0mm x 45mm LVL* joists at 0mm centres, the cavity between the 2 layers of Plywood is lined with 1 layer of Pink Batts R1.8 fibreglass insulation. The 7m long LVL* joists are "simply supported" at the ends with timber blocking between the ends of the joists, the joists at each side are seated on 100mm x mm timber plates bolted at 1m centres to the concrete blockwork. The floor cavity between the LVL* joists is lined with 2 layers of 1mm thick Pink Batts Silencer Mid Floor bulk fibreglass insulation. The ceiling comprises: 2 layers of 13mm GIB Noiseline plasterboard fixed with 41mm screws at 0mm centres to 35mm GIB Rondo furring channels at 0mm centres and the steel perimeter J channel fixed to the timber plates, the furring channels are fixed to the LVL* joists with RSIC** clips at 0mm centres. The perimeter of the GIB Noiseline plasterboard is sealed with GIB Soundseal and the joints are paper taped and stopped with GIB TradeSet 90 stopping compound. Bold Italics are clients wording * LVL Laminated Veneer Lumber ** RSIC Resilient Sound Isolation Clip Frequency f Hz L n 1/3 Octave db Notes:1.#N/A = Value not available. 2. Bold values are used to calculate IIC and Ln,w. 3.< indicates that the true value is lower. Normalized impact sound pressure level, L n, db curve of ASTM E989 reference values. curve of ISO reference values Frequency, f, Hz Rating according to ISO 717-2: Rating according to ASTM E989: L n,w (C I ) = 58 ( -1 ) db Impact Insulation Class = 53 db C I,- = 1 db No. of test report: Bare floor 4 Name of test institute: University of Auckland Acoustics Testing Service. Page 239
58 Floor 5. * ** Normalized Impact sound pressure levels according to ISO 1-6 Date of test: 11-Mar-05 Description and identification of the test specimen and test arrangement: Client: FWPRDC A light weight timber floor/ceiling system comprising: 1 x 15mm butt jointed plywood sheets 2700mm x 10mm fixed with mm square head screws at 1mm centres onto 70mm x 45mm battens 70mm side down at 4mm centres angle screwed to 15mm butt jointed plywood sheets 2700mm x 10mm fixed with mm square head screws at 1mm centres to 0mm x 45mm LVL* joists at 0mm centres, the cavity between the 2 layers of Plywood is filled to mm deep paving sand. The 7m long LVL* joists are "simply supported" at the ends with timber blocking between the ends of the joists, the joists at each side are seated on 100mm x mm timber plates bolted at 1m centres to the concrete blockwork. The floor cavity between the LVL* joists is lined with 2 layers of 1mm thick Pink Batts Silencer Mid Floor bulk fibreglass insulation. The ceiling comprises: 2 layers of 13mm GIB Noiseline plasterboard fixed with 41mm screws at 0mm centres to 35mm GIB Rondo furring channels at 0mm centres and the steel perimeter J channel fixed to the timber plates, the furring channels are fixed to the LVL* joists with RSIC** clips at 0mm centres. The perimeter of the GIB Noiseline plasterboard is sealed with GIB Soundseal and the joints are paper taped and stopped with GIB TradeSet 90 stopping compound. Italics are clients wording LVL Laminated Veneer Lumber RSIC Resilient Sound Isolation Clip Frequency f Hz L n 1/3 Octave db Notes:1.#N/A = Value not available. 2. Bold values are used to calculate IIC and Ln,w. 3.< indicates that the true value is lower. Normalized impact sound pressure level, L n, db curve of ASTM E989 reference values. curve of ISO reference values Frequency, f, Hz Rating according to ISO 717-2: Rating according to ASTM E989: No. of test report: Bare floor 5 L n,w (C I ) = 52 ( 0 ) db C I,- = 4 db Impact Insulation Class = 57 db Name of test institute: University of Auckland Acoustics Testing Service. Page 2
59 Floor 6. Normalized Impact sound pressure levels according to ISO 1-6 Date of test: 17-Mar-05 Description and identification of the test specimen and test arrangement: Client: FWPRDC A light weight timber floor/ceiling system comprising: 1 x 15mm butt jointed plywood sheets 2700mm x 10mm fixed with mm square head screws at 1mm centres onto 70mm x 45mm battens 70mm side down at 4mm centres angle screwed to 15mm butt jointed plywood sheets 2700mm x 10mm fixed with mm square head screws at 1mm centres to 0mm x 45mm LVL* joists at 0mm centres, the cavity between the 2 layers of Plywood is filled to mm deep with % paving sand and % sawdust. The 7m long LVL* joists are "simply supported" at the ends with timber blocking between the ends of the joists, the joists at each side are seated on 100mm x mm timber plates bolted at 1m centres to the concrete blockwork. The floor cavity between the LVL* joists is lined with 2 layers of 1mm thick Pink Batts Silencer Mid Floor bulk fibreglass insulation. The ceiling comprises: 2 layers of 13mm GIB Noiseline plasterboard fixed with 41mm screws at 0mm centres to 35mm GIB Rondo furring channels at 0mm centres and the steel perimeter J channel fixed to the timber plates, the furring channels are fixed to the LVL* joists with RSIC** clips at 0mm centres. The perimeter of the GIB Noiseline plasterboard is sealed with GIB Soundseal and the joints are paper taped and stopped with GIB TradeSet 90 stopping compound. * ** Italics are clients wording LVL Laminated Veneer Lumber RSIC Resilient Sound Isolation Clip Frequency f Hz L n 1/3 Octave db Notes:1.#N/A = Value not available. 2. Bold values are used to calculate IIC and Ln,w. 3.< indicates that the true value is lower. Normalized impact sound pressure level, L n, db curve of ASTM E989 reference values. curve of ISO reference values Frequency, f, Hz Rating according to ISO 717-2: Rating according to ASTM E989: No. of test report: Bare floor 6 L n,w (C I ) = 52 ( -1 ) db C I,- = 3 db Impact Insulation Class = 58 db Name of test institute: University of Auckland Acoustics Testing Service. Page 241
60 Floor 7. Normalized Impact sound pressure levels according to ISO 1-6 Date of test: 17-Mar-05 Description and identification of the test specimen and test arrangement: Client: FWPRDC A light weight timber floor/ceiling system comprising: 1 x 15mm butt jointed plywood sheets 2700mm x 10mm fixed with mm square head screws at 1mm centres onto 70mm x 45mm battens 70mm side down at 4mm centres angle screwed to 15mm butt jointed plywood sheets 2700mm x 10mm fixed with mm square head screws at 1mm centres to 0mm x 45mm LVL* joists at 0mm centres, the cavity between the 2 layers of Plywood is filled to mm deep with % paving sand and % sawdust. The 7m long LVL* joists are clamped at the ends to simulate ridged connections, timber blocking is placed between the ends of the joists, the joists at each side are seated on 100mm x mm timber plates bolted at 1m centres to the concrete blockwork. The floor cavity between the LVL* joists is lined with 2 layers of 1mm thick Pink Batts Silencer Mid Floor bulk fibreglass insulation. The ceiling comprises: 2 layers of 13mm GIB Noiseline plasterboard fixed with 41mm screws at 0mm centres to 35mm GIB Rondo furring channels at 0mm centres and the steel perimeter J channel fixed to the timber plates, the furring channels are fixed to the LVL* joists with RSIC** clips at 0mm centres. The perimeter of the GIB Noiseline plasterboard is sealed with GIB Soundseal and the joints are paper taped and stopped with GIB TradeSet 90 stopping compound. * ** Italics are clients wording LVL Laminated Veneer Lumber RSIC Resilient Sound Isolation Clip Frequency f Hz L n 1/3 Octave db Notes:1.#N/A = Value not available. 2. Bold values are used to calculate IIC and Ln,w. 3.< indicates that the true value is lower. Normalized impact sound pressure level, L n, db curve of ASTM E989 reference values. curve of ISO reference values Frequency, f, Hz Rating according to ISO 717-2: Rating according to ASTM E989: No. of test report: Bare floor 7 L n,w (C I ) = 52 ( -1 ) db C I,- = 2 db Impact Insulation Class = 58 db Name of test institute: University of Auckland Acoustics Testing Service. Page 242
61 Floor 8. Normalized Impact sound pressure levels according to ISO 1-6 Date of test: 25-Apr-05 Description and identification of the test specimen and test arrangement: Client: FWPRDC A light weight timber floor/ceiling system comprising: 1 x 15mm butt jointed plywood sheets 2700mm x 10mm fixed with mm square head screws at 1mm centres onto 70mm x 45mm battens 70mm side down at 4mm centres angle screwed to 15mm butt jointed plywood sheets 2700mm x 10mm fixed with mm square head screws at 1mm centres to 0mm x 45mm LVL* joists at 0mm centres, the cavity between the 2 layers of Plywood is filled to mm deep with a mixture of % paving sand and % sawdust. The 5.5m long LVL* joists are "simply supported" at the ends with timber blocking between the ends of the joists, the joists are seated on 100mm x mm timber plates bolted at 1m centres to the concrete blockwork at one end and in joist hangers fixed to a 1mm x 0mm LVL* beam at the other end. The floor cavity between the LVL* joists is lined with 2 layers of 1mm thick Pink Batts Silencer Mid Floor bulk fibreglass insulation. The ceiling comprises: 2 layers of 13mm GIB Noiseline plasterboard fixed with 41mm screws at 0mm centres to 35mm GIB Rondo furring channels at 0mm centres and the steel perimeter J channel fixed to the timber plates, the furring channels are fixed to the LVL* joists with RSIC** clips at 0mm centres. The perimeter of the GIB Noiseline plasterboard is sealed with GIB Soundseal and the joints are paper taped and stopped with GIB TradeSet 90 stopping compound. * ** Italics are clients wording LVL Laminated Veneer Lumber RSIC Resilient Sound Isolation Clip Frequency f Hz L n 1/3 Octave db Notes:1.#N/A = Value not available. 2. Bold values are used to calculate IIC and Ln,w. 3.< indicates that the true value is lower. Normalized impact sound pressure level, L n, db curve of ASTM E989 reference values. curve of ISO reference values Frequency, f, Hz Rating according to ISO 717-2: Rating according to ASTM E989: No. of test report: Bare floor 8 L n,w (C I ) = 51 ( -1 ) db C I,- = 3 db Impact Insulation Class = 59 db Name of test institute: University of Auckland Acoustics Testing Service. Page 243
62 Floor 9. * ** Normalized Impact sound pressure levels according to ISO 1-6 Date of test: 25-Apr-05 Description and identification of the test specimen and test arrangement: Client: FWPRDC A light weight timber floor/ceiling system comprising: Carpet tile on 1 x 15mm butt jointed plywood sheets 2700mm x 10mm fixed with mm square head screws at 1mm centres onto 90mm x 45mm battens 45mm side down at 4mm centres angle screwed to 15mm but jointed plywood sheets 2700mm x 10mm fixed with mm square head screws at 1mm centres to 0mm x 45mm LVL* joists at 0mm centres, the cavity between the 2 layers of Plywood is filled to mm deep with a mixture of % paving sand and % sawdust. The 5.5m long LVL* joists are "simply supported" at the ends with timber blocking between the ends of the joists, the joists are seated on 100mm x mm timber plates bolted at 1m centres to the concrete blockwork at one end and in joist hangers fixed to a 1mm x 0mm LVL* beam at the other end. The floor cavity between the LVL* joists is lined with 2 layers of 1mm thick Pink Batts Silencer Mid Floor bulk fibreglass insulation. The ceiling comprises: 2 layers of 13mm GIB Noiseline plasterboard fixed with 41mm screws at 0mm centres to 35mm GIB Rondo furring channels at 0mm centres and the steel perimeter J channel fixed to the timber plates, the furring channels are fixed to the LVL* joists with RSIC** clips at 0mm centres. The perimeter of the GIB Noiseline plasterboard is sealed with GIB Soundseal and the joints are paper taped and stopped with GIB TradeSet 90 stopping compound. Italics are clients wording LVL Laminated Veneer Lumber RSIC Resilient Sound Isolation Clip Frequency f Hz L n 1/3 Octave db Notes:1.#N/A = Value not available. 2. Bold values are used to calculate IIC and Ln,w. 3.< indicates that the true value is lower. Normalized impact sound pressure level, L n, db curve of ASTM E989 reference values. curve of ISO reference values Frequency, f, Hz Rating according to ISO 717-2: Rating according to ASTM E989: No. of test report: Bare floor 9 L n,w (C I ) = 48 ( -2 ) db C I,- = 9 db Impact Insulation Class = 62 db Name of test institute: University of Auckland Acoustics Testing Service. Page 244

63 Floor 14. Normalized Impact sound pressure levels according to ISO 1-6 Date of test: 16-May-05 Description and identification of the test specimen and test arrangement: Client: FWPRDC A A light light weight timber floor/ceiling system comprising: Butt Butt jointed 15mm plywood sheets 2700mm x x 10mm fixed with with mm square head screws at at 1mm centres to to 0mm x x 45mm LVL* joists at at 0mm centres. The 5.5m 7m long long LVL LVL* joists joists are are "simply supported" at at the the ends with with timber blocking between the the ends of of the the joists, the the joists at at one each side side are are seated seated on 100mm on 100mm x mm x mm timber timber plates plates bolted bolted at 1m at centres 1m centres to the to concrete the concrete blockwork blockwork. and in The joist floor hangers cavity on between the other. The LVL joists have joists 2 is transverse lined with stiffeners 2 layers of spaced 1mm 1.5m thick apart, Pink these Batts stiffeners Silencer are Mid made Floor up bulk of 355mm fiberglass x 0mm insulation x 45mm The ceiling pieces of LVL* joist comprises: with a steel 2 layers tensioning of 13mm rod GIB fixed Noiseline through the plasterboard centres of the fixed main with joists 41mm along screws side the at 0mm 355mm centres blocking. to The 35mm 2 GIB transverse Rondo steel stiffeners furring do not channels span the at full 0mm width centres and finish and at the the steel second perimeter to last J joists channel 0mm fixed from to the the timber wall. The plates, floor the cavity between furring the channels LVL* joists are fixed is lined to the with LVL 2 layers joists of with 1mm RSIC thick clips Pink at 0mm Batts Silencer centres.the Mid Floor perimeter bulk of fibreglass the GIB insulation. Noiseline The ceiling plasterboard comprises: sealed 2 layers with of GIB 13mm Soundseal GIB Noiseline and the plasterboard joints are paper fixed taped with 41mm and stopped screws with at 0mm GIB TradeSet centres to 90 35mm GIB stopping Rondo compound. steel furring channels at 0mm centres and the steel perimeter J channel fixed to the timber plates, the furring channels are fixed to the LVL* joists with RSIC** clips at 0mm centres. The perimeter of the GIB Noiseline plasterboard is sealed with GIB Soundseal and the joints are paper taped and stopped with GIB TradeSet 90 stopping compound. Italics are clients wording * LVL Laminated Veneer Lumber ** RSIC Resilient Sound Isolation Clip Frequency f Hz L n 1/3 Octave db Notes:1.#N/A = Value not available. 2. Bold values are used to calculate IIC and Ln,w. 3.< indicates that the true value is lower. Normalized impact sound pressure level, L n, db curve of ASTM E989 reference values. curve of ISO reference values Frequency, f, Hz Rating according to ISO 717-2: Rating according to ASTM E989: L n,w (C I ) = 56 ( 0 ) db Impact Insulation Class = 55 db C I,- = 4 db No. of test report: Bare floor 14 Name of test institute: University of Auckland Acoustics Testing Service. Page 245
64 Floor 18. Normalized Impact sound pressure levels according to ISO 1-6 Date of test: 27-May-05 Description and identification of the test specimen and test arrangement: Client: FWPRDC A light weight timber floor/ceiling system comprising: Butt jointed mm 15mm particleboard plywood sheets sheets 2700mm fixed x with 10mm mm fixed square with head mm screws square at head 1mm screws centres at 1mm to 0mm centres deep to I 0mm joists (90x45mm x LVL Flanges) joists at 0mm 0mm centres. The 5.5m 7m long long LVL I joists joists are "simply supported" at the ends with timber blocking between the ends of the joists, the joists at each side are seated on 100mm x mm timber plates bolted at 1m centres to the concrete blockwork. The joists floor cavity have 2 between transverse the stiffeners LVL spaced joists is 1.5m lined apart, with 2 these layers stiffeners of 1mm are thick made Pink up Batts of 555mm Silencer pieces Mid of Floor 0mm bulk deep fiberglass I joist insulation with a steel The tensioning ceiling rod fixed comprises: through 2 layers the centres of 13mm of the GIB main Noiseline joists along plasterboard side the 555mm fixed with blocking. 41mm The screws 2 transverse at 0mm stiffeners centres do to not 35mm span GIB the full Rondo width and steel finish furring at the channels second to at last 0mm joists centres 0mm and from the the steel wall. perimeter The floor J cavity channel between fixed to the the I timber joists is plates, lined with the 2 layers furring of channels 1mm thick are Pink fixed Batts to the Silencer LVL joists Mid with Floor RSIC bulk clips fibreglass at 0mm insulation. centres.the ceiling perimeter comprises: of the GIB 2 layers Noiseline of 13mm GIB plasterboard Noiseline sealed plasterboard with GIB fixed Soundseal with 41mm and screws the joints at 0mm are paper centres taped to 35mm and stopped GIB Rondo with GIB steel TradeSet furring 90 channels stopping compound. at 0mm centres and the steel perimeter J channel fixed to the timber plates, the furring channels are fixed to the I joists with RSIC** clips at 0mm centres. The perimeter of the GIB Noiseline plasterboard is sealed with GIB Soundseal and the joints are paper taped and stopped with GIB TradeSet 90 stopping compound. Italics are clients wording * LVL Laminated Veneer Lumber ** RSIC Resilient Sound Isolation Clip Frequency f Hz L n 1/3 Octave db Notes:1.#N/A = Value not available. 2. Bold values are used to calculate IIC and Ln,w. 3.< indicates that the true value is lower. Normalized impact sound pressure level, L n, db curve of ASTM E989 reference values. curve of ISO reference values Frequency, f, Hz Rating according to ISO 717-2: Rating according to ASTM E989: L n,w (C I ) = 58 ( 0 ) db Impact Insulation Class = 52 db C I,- = 2 db No. of test report: Bare floor 18 Name of test institute: University of Auckland Acoustics Testing Service. Page 246

65 Floor 19. Normalized Impact sound pressure levels according to ISO 1-6 Date of test: 02-Jun-05 Description and identification of the test specimen and test arrangement: Client: FWPRDC A A light light weight timber floor/ceiling system comprising: Butt Butt jointed mm 15mm particleboard plywood sheets sheets 2700mm fixed with x 10mm mm square fixed with head screws mm at square 1mm head centres screws to 0mm at 1mm deep centres I joists to 0mm (90x45mm x 45mm Flanges) LVL at joists 0mm at 0mm centres. centres. The 5.5m The long 7m long I joists LVL are joists "simply are "simply supported" supported" at the at ends the ends with timber with timber blocking blocking between between the ends the ends of the of joists, the joists, the joists the joists at each at each side are side seated are seated on 100mm on 100mm x mm x mm timber timber plates plates bolted bolted at 1m at centres 1m centres to the to concrete the concrete blockwork. blockwork. The The joists floor have cavity 2 transverse between stiffeners the LVL spaced joists is 1.5m lined apart, with 2 these layers stiffeners of 1mm are thick made Pink up Batts of 555mm Silencer pieces Mid of Floor 0mm bulk deep fiberglass I joist with insulation a steel The tensioning ceiling rod fixed through comprises: the centres 2 layers of of the 13mm main GIB joists Noiseline along side plasterboard the 555mm blocking. fixed with The 41mm 2 transverse screws at stiffeners 0mm centres do not span to 35mm the full GIB width and Rondo finish at steel the furring second channels to last joists at 0mm from centres the and wall. the The steel floor perimeter cavity between J channel the fixed I joists to the is lined timber with plates, 2 layers the of 1mm furring thick channels Pink Batts are fixed Silencer to the Mid LVL Floor joists bulk with fibreglass RSIC clips insulation. 0mm The centres.the ceiling comprises: perimeter 4 layers of the of GIB 13mm Noiseline GIB Noiseline plasterboard plasterboard is sealed with fixed GIB with Soundseal 41mm screws and at the 0mm joints centres are paper to 35mm taped GIB and stopped Rondo with furring GIB channels TradeSet at 90 0mm centres stopping and compound. the steel perimeter J channel fixed to the timber plates, the furring channels are fixed to the I joists with RSIC** clips at 0mm centres. The perimeter of the GIB Noiseline plasterboard is sealed with GIB Soundseal and the joints are paper taped and stopped with GIB TradeSet 90 stopping compound. Italics are clients wording * LVL Laminated Veneer Lumber ** RSIC Resilient Sound Isolation Clip Frequency f Hz L n 1/3 Octave db < 19.3 Notes:1.#N/A = Value not available. 2. Bold values are used to calculate IIC and Ln,w. 3.< indicates that the true value is lower. Normalized impact sound pressure level, L n, db curve of ASTM E989 reference values. curve of ISO reference values Frequency, f, Hz Rating according to ISO 717-2: Rating according to ASTM E989: L n,w (C I ) = 59 ( 0 ) db Impact Insulation Class = 51 db C I,- = 1 db No. of test report: Bare floor 19 Name of test institute: University of Auckland Acoustics Testing Service. Page 247
66 Floor. Normalized Impact sound pressure levels according to ISO 1-6 Date of test: 12-Jul-05 Description and identification of the test specimen and test arrangement: Client: FWPRDC A A light light weight timber floor/ceiling system comprising: 75mm Butt jointed Hebel 15mm aerated plywood concrete sheets floor 2700mm panels glued x 10mm and screwed fixed with to 0mm mm square deep I head joists screws (90x45mm at 1mm Flanges) centres at 4mm to 0mm centres. x 45mm The 5.5m LVL joists long I at joists 0mm are centres. "simply supported" The 7m long at LVL the ends joists with are timber "simply blocking supported" between at the the ends ends with of timber the joists, blocking the joists between at each the side ends are of the seated joists, on the 100mm joists x at mm each timber side are plates seated bolted on 100mm at 1m x centres mm to timber the concrete plates bolted blockwork. at 1m centres The joists to have the concrete 2 transverse blockwork. stiffeners The spaced floor cavity 1.5m between apart, these LVL stiffeners are joists made is lined up of with 5mm 2 layers pieces of 1mm of 0mm thick deep Pink I Batts joist with Silencer a steel Mid tensioning Floor bulk rod fiberglass fixed through insulation the centres The ceiling of the main joists comprises: along side 2 layers the 5mm of 13mm blocking. GIB Noiseline The 2 transverse plasterboard stiffeners fixed do with not 41mm span the screws full width at 0mm and finish centres at the to 35mm second GIB to last joists Rondo 4mm steel from furring the wall. channels The floor at cavity 0mm between centres the and I the joists steel is perimeter lined with 2 J channel layers of fixed 1mm to the thick timber Pink plates, Batts Silencer the Mid furring Floor channels bulk fibreglass are fixed insulation to the LVL The ceiling joists with comprises: RSIC clips 2 layers at 0mm of 13mm centres.the GIB Noiseline perimeter plasterboard of the GIB fixed Noiseline with 41mm screws plasterboard at 0mm is sealed centres with to GIB 35mm Soundseal GIB Rondo and furring the joints channels are paper at 0mm taped and centres, stopped and with the steel GIB TradeSet perimeter J 90 channel fixed stopping the compound. timber plates, the furring channels are fixed to the I joists with RSIC** clips at 0mm centres. The perimeter of the GIB Noiseline plasterboard is sealed with GIB Soundseal and the joints are paper taped and stopped with GIB TradeSet 90 stopping compound. Italics are clients wording * LVL Laminated Veneer Lumber ** RSIC Resilient Sound Isolation Clip Frequency f Hz L n 1/3 Octave db Notes:1.#N/A = Value not available. 2. Bold values are used to calculate IIC and Ln,w. 3.< indicates that the true value is lower. Normalized impact sound pressure level, L n, db curve of ASTM E989 reference values. curve of ISO reference values Frequency, f, Hz Rating according to ISO 717-2: Rating according to ASTM E989: L n,w (C I ) = 71 ( -9 ) db Impact Insulation Class = 35 db C I,- = -8 db No. of test report: Bare floor Name of test institute: University of Auckland Acoustics Testing Service. Page 248
67 Floor 21. Normalized Impact sound pressure levels according to ISO 1-6 Date of test: 09-Aug-05 Description and identification of the test specimen and test arrangement: Client: FWPRDC A A light light weight timber floor/ceiling system comprising: 75mm Butt jointed Hebel 15mm aerated plywood concrete sheets floor 2700mm panels glued x 10mm and screwed fixed with to 0mm mm square deep I head joists screws (90x45mm at 1mm Flanges) centres at 4mm to 0mm centres. x 45mm The 5.5m LVL joists long I at joists 0mm are centres. "simply supported" The 7m long at LVL the ends joists with are timber "simply blocking supported" between at the the ends ends with of timber the joists, blocking the joists between at each the side ends are of the seated joists, on the 100mm joists x at mm each timber side are plates seated bolted on 100mm at 1m x centres mm to timber the concrete plates bolted blockwork. at 1m centres The floor to cavity the concrete between blockwork. the I joists The is floor lined cavity with 2 between layers of the 1mm LVL thick Pink joists Batts is lined Silencer with 2 Mid layers Floor of bulk 1mm fibreglass thick Pink insulation Batts The Silencer ceiling Mid comprises: Floor bulk 2 layers fiberglass of 13mm insulation GIB Noiseline The ceiling plasterboard comprises: 2 fixed layers with of 41mm 13mm screws GIB Noiseline at 0mm plasterboard centres to 35mm fixed GIB with 41mm Rondo screws furring at channels 0mm centres at 0mm to 35mm centres, GIB and the Rondo steel perimeter steel furring J channel channels fixed at to 0mm the timber centres plates, and the the furring steel channels perimeter are J channel fixed to fixed the I to joists the timber with RSIC** plates, clips the at 0mm furring centres. channels The are perimeter fixed to of the the LVL GIB joists Noiseline with RSIC plasterboard clips at 0mm is sealed centres.the with GIB perimeter Soundseal of the and GIB the Noiseline joints are paper taped plasterboard and stopped is sealed with GIB with TradeSet GIB Soundseal 90 stopping and the compound. joints are paper taped and stopped with GIB TradeSet 90 stopping compound. Italics are clients wording * LVL Laminated Veneer Lumber ** RSIC Resilient Sound Isolation Clip Frequency f Hz L n 1/3 Octave db Notes:1.#N/A = Value not available. 2. Bold values are used to calculate IIC and Ln,w. 3.< indicates that the true value is lower. Normalized impact sound pressure level, L n, db curve of ASTM E989 reference values. curve of ISO reference values Frequency, f, Hz Rating according to ISO 717-2: Rating according to ASTM E989: L n,w (C I ) = 72 ( -10 ) db Impact Insulation Class = 35 db C I,- = -8 db No. of test report: Bare floor 21 Name of test institute: University of Auckland Acoustics Testing Service. Page 249
68 Floor 22. Normalized Impact sound pressure levels according to ISO 1-6 Date of test: 17-Nov-05 Description and identification of the test specimen and test arrangement: Client: FWPRDC A A light light weight timber floor/ceiling system comprising: Alpha Butt jointed Gypsum 15mm concrete plywood laid on sheets 12mm 2700mm polyethylene x 10mm foam fixed underlay with loose mm laid square with taped head joints screws on at 15mm 1mm flooring centres grade to 0mm butt jointed x 45mm plywood LVL screw-fixed joists at 0mm to 0mm centres. deep The I 7m joists long (90x45mm LVL joists Flanges) are "simply at 4mm supported" centres. at the The ends 5.5m with long timber I joists blocking are "simply between supported" the ends at of the ends joists, with the timber joists at blocking each side between are seated the ends on 100mm of the joists, x mm the timber joists plates each bolted side are at 1m seated centres on 100mm to the concrete x mm blockwork. timber plates The bolted floor cavity at 1m centres between to the the LVL concrete blockwork. joists is lined The with floor 2 cavity layers between of 1mm the thick I joists Pink is Batts lined Silencer with 2 layers Mid of Floor 1mm bulk thick fiberglass Pink Batts insulation Silencer The Mid ceiling Floor bulk fibreglass comprises: insulation 2 layers The of 13mm ceiling GIB comprises: Noiseline 2 layers plasterboard of 13mm fixed GIB Noiseline with 41mm plasterboard screws at 0mm fixed with centres 41mm to 35mm screws GIB at 0mm Rondo centres steel to furring 35mm channels GIB Rondo at 0mm furring centres channels and at the 0mm steel perimeter centres, and J channel the steel fixed perimeter to the timber J channel plates, fixed the to the timber furring plates, channels the furring are fixed channels to the are LVL fixed joists to with the I RSIC joists clips with at RSIC** 0mm clips centres.the at 0mm perimeter centres. The of the perimeter GIB Noiseline of the GIB Noiseline plasterboard plasterboard is sealed with is sealed GIB Soundseal with GIB Soundseal and the joints and are the paper joints are taped paper and taped stopped and with stopped GIB TradeSet with GIB TradeSet stopping compound. Italics are clients wording * LVL Laminated Veneer Lumber ** RSIC Resilient Sound Isolation Clip Frequency f Hz L n 1/3 Octave db Notes:1.#N/A = Value not available. 2. Bold values are used to calculate IIC and Ln,w. 3.< indicates that the true value is lower. Normalized impact sound pressure level, L n, db curve of ASTM E989 reference values. curve of ISO reference values Frequency, f, Hz Rating according to ISO 717-2: Rating according to ASTM E989: L n,w (C I ) = 52 ( -2 ) db Impact Insulation Class = 58 db C I,- = 4 db No. of test report: Bare floor 22 Name of test institute: University of Auckland Acoustics Testing Service. Page 2
69 Floor 23. Normalized Impact sound pressure levels according to ISO 1-6 Date of test: 24-Nov-05 Description and identification of the test specimen and test arrangement: Client: FWPRDC A A light light weight timber floor/ceiling system comprising: Alpha Butt jointed Gypsum 15mm concrete plywood laid on sheets 12mm 2700mm polyethylene x 10mm foam fixed underlay with with mm taped square joints head loose screws laid on at 15mm 1mm flooring centres grade to 0mm butt jointed x 45mm plywood LVL joists screw-fixed at 0mm to 0mm centres. deep The I 7m joists long (90x45mm LVL joists Flanges) are "simply at 4mm supported" centres. at the The ends 5.5m with long timber I joists blocking are "simply between supported" the ends at of the ends joists, with the timber joists at blocking each side between are seated the ends on 100mm of the joists, x mm the timber joists plates each bolted side are at 1m seated centres on 100mm to the concrete x mm blockwork. timber plates The bolted floor cavity at 1m centres between to the the LVL concrete blockwork. joists is lined The with floor 2 cavity layers between of 1mm the thick I joists Pink is Batts lined Silencer with 2 layers Mid of Floor 1mm bulk thick fiberglass Pink Batts insulation Silencer The Mid ceiling Floor bulk fibreglass comprises: insulation 2 layers The of 13mm ceiling GIB comprises: Noiseline 2 layers plasterboard of 13mm fixed GIB Noiseline with 41mm plasterboard screws at 0mm fixed with centres 41mm to 35mm screws GIB at 0mm Rondo centres steel to furring 35mm channels GIB Rondo at 0mm furring centres channels and at the 0mm steel perimeter centres, and J channel the steel fixed perimeter to the timber J channel plates, fixed the to the timber furring plates, channels the furring are fixed channels to the are LVL fixed joists to with independent RSIC clips 0mm at 0mm LVL centres.the joists at 0mm? perimeter centres of the with GIB clips Noiseline at 0mm centres. plasterboard The perimeter is sealed of with the GIB Soundseal Noiseline plasterboard and the joints is are sealed paper with taped GIB and Soundseal stopped with and GIB the joints TradeSet are paper 90 taped and stopping stopped compound. with GIB TradeSet 90 stopping compound. Italics are clients wording * LVL Laminated Veneer Lumber ** RSIC Resilient Sound Isolation Clip Frequency f Hz L n 1/3 Octave db Notes:1.#N/A = Value not available. 2. Bold values are used to calculate IIC and Ln,w. 3.< indicates that the true value is lower. Normalized impact sound pressure level, L n, db curve of ASTM E989 reference values. curve of ISO reference values Frequency, f, Hz Rating according to ISO 717-2: Rating according to ASTM E989: L n,w (C I ) = 53 ( -2 ) db Impact Insulation Class = 58 db C I,- = 2 db No. of test report: Bare floor 23 Name of test institute: University of Auckland Acoustics Testing Service. Page 251
70 Floor 25. Normalized Impact sound pressure levels according to ISO 1-6 Date of test: -Dec-05 Description and identification of the test specimen and test arrangement: Client: FWPRDC A A light light weight timber floor/ceiling system comprising: 1 Butt x 15mm jointed butt 15mm jointed plywood sheets sheets 2700mm x x 10mm fixed fixed with with mm mm square head screws at at 1mm centres onto 0mm 70mm x 45mm LVL battens joists 45mm at 0mm side down centres. at 4mm The 7m centres long LVL angle joists screwed are "simply to 15mm supported" butt jointed at the plywood ends with sheets timber 2700mm blocking x between 10mm the fixed ends with of mm the joists, square the head joists screws at each at side 1mm are seated centres to on 0mm 100mm deep x mm I joists timber at 4mm plates bolted centres, at the 1m cavity centres between to the concrete the 2 layers blockwork. of Plywood The is floor filled cavity to 65mm between deep the with LVL a mixture joists is of lined % with paving 2 layers sand of and 1mm % sawdust. thick Pink The Batts 5.5m Silencer long I joists Mid Floor are "simply bulk fiberglass supported" insulation the ends The with ceiling timber blocking comprises: between 2 layers the of ends 13mm of the GIB joists, Noiseline the joists plasterboard at each side fixed are seated with 41mm on 100mm screws x at mm 0mm timber centres plates to 35mm bolted at GIB 1m centres Rondo to the steel concrete furring blockwork. channels The at 0mm floor cavity centres between and the the steel I joists perimeter is lined J channel with 2 layers fixed of to 1mm the timber thick plates, Pink the Batts Silencer furring Mid channels Floor bulk are fixed fibreglass to the insulation LVL joists The with ceiling RSIC comprises: clips at 0mm 2 layers centres.the of 13mm GIB perimeter Noiseline of the plasterboard GIB Noiseline fixed with plasterboard 41mm screws is sealed at 0mm with GIB centres Soundseal to 35mm and GIB the Rondo joints are furring paper channels taped and at 0mm stopped centres, with GIB the TradeSet furring channels 90 are fixed stopping independent compound. 0mm LVL joists mounted on 10mm waffle profile rubber pads at 10mm centres with clips at 10mm centres and are not fixed to the perimeter. The perimeter of the GIB Noiseline plasterboard is sealed with GIB Soundseal and the joints are paper taped and stopped with GIB TradeSet 90 stopping compound. Italics are clients wording * LVL Laminated Veneer Lumber ** RSIC Resilient Sound Isolation Clip Frequency f Hz L n 1/3 Octave db < 11.8 Notes:1.#N/A = Value not available. 2. Bold values are used to calculate IIC and Ln,w. 3.< indicates that the true value is lower. Normalized impact sound pressure level, L n, db curve of ASTM E989 reference values. curve of ISO reference values Frequency, f, Hz Rating according to ISO 717-2: Rating according to ASTM E989: L n,w (C I ) = 48 ( -2 ) db Impact Insulation Class = 62 db C I,- = 10 db No. of test report: Bare floor 25 Name of test institute: University of Auckland Acoustics Testing Service. Page 252
71 Normalized Impact sound pressure levels according to ISO 1-6 Date of test: -Dec-05 Description and identification of the test specimen and test arrangement: Client: FWPRDC A A light light weight timber floor/ceiling system comprising: 0mm Butt jointed x 0mm 15mm ceramic plywood tiles sheets bonded 2700mm to 10mm x 10mm Fiberock fixed flooring with underlay mm square screw-fixed head screws at 0mm at 1mm centres centres to 1 x 15mm to 0mm butt x jointed 45mm plywood LVL joists sheets at 0mm 2700mm centres. x 10mm The 7m fixed long with LVL mm joists square "simply head supported" screws at 1mm at the ends centres with onto timber 70mm blocking x 45mm between battens the 45mm ends side of the down joists, at the 4mm joists centres at each angle side are screwed seated to 15mm on 100mm butt jointed x mm plywood timber sheets plates bolted 2700mm at 1m x 10mm centres fixed to the with concrete mm blockwork. square head The screws floor cavity at 1mm between centres the LVL to 0mm deep joists I joists lined at with 4mm 2 layers centres, of 1mm the cavity thick between Pink Batts the Silencer 2 layers of Mid Plywood Floor bulk is filled fiberglass to 65mm insulation deep with The a mixture ceiling of % paving comprises: sand and 2 layers % of sawdust. 13mm GIB The Noiseline 5.5m long I plasterboard joists are "simply fixed supported" with 41mm at screws the ends at 0mm with timber centres blocking to 35mm between GIB the ends Rondo of the steel joists, furring the joists channels at each at side 0mm are seated centres on and 100mm the steel x mm perimeter timber J plates channel bolted fixed at to 1m the centres timber plates, to the concrete the blockwork. furring channels The floor are cavity fixed between to the LVL the I joists joists with is lined RSIC with clips 2 layers at 0mm of 1mm centres.the thick Pink perimeter Batts Silencer of the GIB Mid Noiseline Floor bulk fibreglass plasterboard insulation is sealed The with ceiling GIB comprises: Soundseal 2 layers and the of 13mm joints are GIB paper Noiseline taped and plasterboard stopped with fixed GIB with TradeSet 41mm screws 90 at 0mm stopping centres compound. to 35mm GIB Rondo furring channels at 0mm centres, the furring channels are fixed to inderpendent 0mm LVL joists mounted on 10mm waffel profile rubber pads at 10mm centres with clips at 10mm centres and are not fixed to the perimeter. The perimeter of the GIB Noiseline plasterboard is sealed with GIB Soundseal and the joints are paper taped and stopped with GIB TradeSet 90 stopping compound. Italics are clients wording * LVL Laminated Veneer Lumber ** RSIC Resilient Sound Isolation Clip Frequency f Hz L n 1/3 Octave db Notes:1.#N/A = Value not available. 2. Bold values are used to calculate IIC and Ln,w. 3.< indicates that the true value is lower. Normalized impact sound pressure level, L n, db curve of ASTM E989 reference values. curve of ISO reference values Frequency, f, Hz Rating according to ISO 717-2: Rating according to ASTM E989: L n,w (C I ) = 53 ( -4 ) db Impact Insulation Class = 58 db C I,- = 3 db No. of test report: Ceramic tiles on floor 25 Name of test institute: University of Auckland Acoustics Testing Service. Page 253
72 Floor 26. Normalized Impact sound pressure levels according to ISO 1-6 Date of test: 15-Jan-06 Description and identification of the test specimen and test arrangement: Client: FWPRDC A A light light weight timber floor/ceiling system comprising: 1 Butt x 15mm jointed butt 15mm jointed plywood sheets sheets 2700mm x x 10mm fixed fixed with with mm mm square head screws at at 1mm centres onto 0mm 70mm x 45mm LVL battens joists 45mm at 0mm side down centres. at 4mm The 7m centres long LVL angle joists screwed are "simply to 15mm supported" butt jointed at the plywood ends with sheets timber 2700mm blocking x between 10mm the fixed ends with of mm the joists, square the head joists screws at each at side 1mm are seated centres to on 0mm 100mm deep x mm I joists timber at 4mm plates bolted centres, at the 1m cavity centres between to the concrete the 2 layers blockwork. of Plywood The is floor filled cavity to 65mm between deep the with LVL a mixture joists is of lined % with paving 2 layers sand of and 1mm % sawdust. thick Pink The Batts 5.5m Silencer long I joists Mid Floor are "simply bulk fiberglass supported" insulation the ends The with ceiling timber blocking comprises: between 2 layers the of ends 13mm of the GIB joists, Noiseline the joists plasterboard at each side fixed are seated with 41mm on 100mm screws x at mm 0mm timber centres plates to 35mm bolted at GIB 1m centres Rondo to the steel concrete furring blockwork. channels The at 0mm floor cavity centres between and the the steel I joists perimeter is lined J channel with 2 layers fixed of to 1mm the timber thick plates, Pink the Batts Silencer furring Mid channels Floor bulk are fixed fibreglass to the insulation LVL joists The with ceiling RSIC comprises: clips at 0mm 2 layers centres.the of 13mm GIB perimeter Noiseline of the plasterboard GIB Noiseline fixed with plasterboard 41mm screws is sealed at 0mm with GIB centres Soundseal to 35mm and GIB the Rondo joints are furring paper channels taped and at 0mm stopped centres, with GIB the TradeSet furring channels 90 are fixed stopping independent compound. 0mm LVL joists mounted on 10mm waffle profile rubber pads at 10mm centres with clips at 10mm centres and are not fixed to the perimeter. The perimeter of the GIB Noiseline plasterboard is sealed with GIB Soundseal with a 90mm plaster cove to cornice. The joints are paper taped and stopped with GIB TradeSet 90 Italics are clients wording * LVL Laminated Veneer Lumber ** RSIC Resilient Sound Isolation Clip Frequency f Hz L n 1/3 Octave db Notes:1.#N/A = Value not available. 2. Bold values are used to calculate IIC and Ln,w. 3.< indicates that the true value is lower. Normalized impact sound pressure level, L n, db curve of ASTM E989 reference values. curve of ISO reference values Frequency, f, Hz Rating according to ISO 717-2: Rating according to ASTM E989: L n,w (C I ) = ( -1 ) db Impact Insulation Class = db C I,- = 8 db No. of test report: Bare floor 26 Name of test institute: University of Auckland Acoustics Testing Service. Page 254
73 9 FLOOR COST COMPARISON. The following square metre elemental costs are based generally on the Australian Construction Handbook 05 issued by Rawlinsons and are for Sydney and Melbourne. The cost estimates were done by Ken McGunnigle (MRICS Chartered Surveyor (QS), MCIOB Chartered Builder, MNZIQS Member NZ Institute of Quantity Surveyors, BRANZ Accredited Adviser, MNZIBS, Registered Building Surveyor, MNZIOB Member of NZ Institute of Building). The limitations of the estimated elemental rates are as follows; The rates are for the work in place, ie supply and fix Excludes GST Excludes contractors margin for risk and profit Excludes preliminaries, effect on building foundation costs and time savings for erection. Floor coverings are excluded Painting excluded Floor area taken as 7m x 3.2m in all cases. Acoustical sealant not included Plaster 90mm cove not included Supports onto walls not included. The purpose of the estimated elemental rates is far comparing relative costs of the systems using a standard data base. The table below does not purport to represent tender unit rates by building contractors in the market place. Table 9-1 shows the costings. Note that the cost of the in-situ cast 1mm concrete slab is shown for reference. Also note that the concrete slab costs are very different in Melbourne as compared to Sydney. This is primarily due to the cost of formwork: in Melbourne formwork labour is very unionised compared to Sydney and hence is much more expensive. On the other hand, the cost of timber construction is almost identical in Melbourne and Sydney. Since the elemental cost of the concrete floor is relatively high in Melbourne this would be the place to gain market traction with timber-framed systems. Page 255
74 Floor Description Estimated elemental cost in Sydney per square metre in A$ or comment Concrete Floor 1mm Concrete Floor with hardwall plaster to suffit 4 (321 in Melbourne) 2 Base floor, 0x45 LVL at 0 centres 2 3 3xGib Sound Barrier xPly + batts 4 5 1xPly + mm sand 3 6 1xPly + mm sand/sawdust 4 9 1xPly + 85mm sand/sawdust As floor 2 but with 2 transverse beams and only 5.5m long 18 0 I joists with 2 transverse beams 19 4 layers of Gib Noiseline to ceiling Hebel floor on 0 I joists at 4 centres with 2 transverse beams 21 Hebel floor on 0 I joists at at 4 centres 22 Av 29mm thick alpha gypsum on 12mm polyethylene 23 Av 29mm thick alpha gypsum on 12mm polyethylene with separate ceiling joists 25 Battens/65mm sand sawdust with separate ceiling joists with edges free 26 As floor 25 but with plaster cove Table 9-1. Table of comparative elemental cost. (Note; this table should be read with reference to the floor diagrams chapter, which has section drawings of each floor system.) Page 256
75 Page 257
76 10 PROPERTIES OF MATERIALS USED. The following is a list of the materials used to build the floors and their associated acoustically important properties PANEL PRODUCTS: 15mm 5 ply Ecoply F11 plywood. Nominal Density = 5 kg/m 3 Manufacturer s nominal static bending stiffness 23 Nm 2 along face grain, 684 Nm 2 perpendicular to face grain assuming 10.5 GPa along-grain wood stiffness. Dynamic measurements from one sample showed that along-grain wood stiffness was 13 GPa. Apparent measured dynamic bending stiffness along face grain (from floor measurements) is equivalent to homogenous material with E from 12 to 14 GPa. Vibration loss factor of material assumed to be mm Flooring Particleboard. Nominal Density = 710 kg/m 3 Dynamic Young s modulus (from Insul 4 Material Properties list) = 3.5 GPa. Vibration loss factor of material = mm GIB Sound Barrier Gypsum Fibreboard. Manufacturer s Nominal Density = 10 kg/m 3. Sample measured density = 1070 kg/m 3. Manufacturer s nominal static stiffness parallel to writing on sheet = 4.5 GPa Measured sample dynamic stiffness (at 1.6kHz) parallel to writing on sheet = 6.0 GPa. Measured sample dynamic stiffness (at 1.6kHz) perpendicular to writing on sheet = 5.5 GPa. Measured sample Vibration loss factor = mm GIB Noiseline plasterboard. Manufacturer s nominal density = 962 kg/m 3. Dynamic bending stiffness (from Insul 4 Material Properties list) = 3.7 GPa. Measured vibration loss factor = mm Hebel Floor panels. Density with nominal moisture content = 690 Kg/m 3. Manufacturer s Static Young s modulus = GPa. Vibration loss factor of material (from Insul 4 Material Properties list) = POURED-ON TOPPINGS/SCREEDS. USG Levelrock PS, presanded gypsum concrete. Manufacturers nominal density = 19 kg/m JOISTS. CHH Hyspan LVL. Manufacturer s nominal density = 6 kg/m 3. Manufacturer s nominal static Young s modulus = 13.2 GPa. Apparent dynamic Young s modulus from measurements = 14.5 GPa to 15.5 GPa. Page 258
77 Assumed vibration loss factor = mm CHH Hybeam I-beam (HJ0-63). Manufacturer s nominal linear density = 4.4 kg/m. Manufacturer s nominal static bending stiffness = N m 2. Assumed vibration loss factor = mm CHH Hybeam I-beam (HJ0-90). Manufacturer s nominal linear density = 7.4 kg/m. Manufacturer s nominal static bending stiffness = N m 2. Assumed vibration loss factor = INFILL MATERIALS. 1mm Tasman Insulation Midfloor Silencer. Measured sample flow resistivity = 7227 Rayls/m. Density = 12 kg/m CEILING FIXTURES. RSIC clip. Dynamic Stiffness at Hz under 1 N load (approx equiv to 25kg/m 2 ceiling surface density) = 2000 N/m. Loss factor = 0.1. Gib Rondo Batten. Estimated (from measurements) bending stiffness when attached to plasterboard = N m 2. Page 259
78 11 FLOOR DIAGRAMS AND PHOTOGRAPHS 11.1 THE TEST CHAMBER. This is an illustration of the test chamber in which the floors were built. The chamber is 7m long. Shown in the diagram are the LVL beams which divide the opening so that a shorter span can be used. Note how two separate beams were used so that the joists and the ceiling are separated. Page 2


79 Figure The test chamber without floor view from above. Figure Side view of test chamber, showing entrance doors at right. Page 261
80 11.2 REFERENCE CONCRETE FLOOR (FLOOR 0). A concrete based floor/ceiling system comprising: 1mm reinforced concrete floor with a suspended ceiling comprising: 0mm long 6mm Ø threaded rods fixed to steel plates glued to the underside of the concrete slab at 0mm x 0mm centres, Rondo ceiling clips are screwed to the threaded rods and 35mm GIB Rondo furring channels are held in the clips. The furring channels are screw-fixed at either end to J channels screw-fixed to the 25mm x 245mm timber perimeter plate. 1 lining of 13mm GIB Standard plasterboard is screw-fixed at 0mm centres to the furring channels, the 2mm ceiling cavity is lined with 1 layer of 75mm Pink Batts R1.8 fibreglass insulation. The joints and perimeter are sealed with GIB Soundseal. Page 262
81 11.3 FLOOR 2. Page 263


82 Floor 2; Overview of Plywood deck showing layout of plywood Floor 2; Plywood deck to reinforced concrete edge beam junction Page 264


83 Floor 2; Edge junction between floor and test rig concrete beam Floor 2; General view from below of 7m long 0x45 LVL joists Page 265


84 Floor 2; General view of ceiling system support Floor 2; Ends of joists simply supported on timber ground with solid blocking. Also shown are steel batten, perimeter J channel, RSIC clips and fibreglass sound absorber in ceiling cavity Page 266


85 Floor 2; Shows steel batten spanning 0mm between RSIC clip and steel J channel Floor 2; Junction of ceiling batten to steel J channel on to timber ground over blockwork Page 267

86 Floor 2; Close up of floor joist with RSIC clip to ceiling batten connection Page 268
87 11.4 FLOOR 3 Page 269

88 Floor 3; Overview of gypsum fibreboard deck showing layout. Refer to photographs for Floor 2 for ceiling system details. Page 270
89 11.5 FLOOR 4 Refer to photographs for Floor 2 for ceiling system details. Page 271

90 11.6 FLOOR 5. Page 272


91 Floor 5; View of plywood flooring over 70x45 battens on flat with sand infill Floor 5; Sand infill between 45mm deep battens Refer to photographs for Floor 2 for ceiling system details. Page 273
92 11.7 FLOOR 6 Refer to photographs for Floor 2 for ceiling system details. Page 274
93 11.8 FLOOR 7 Page 275


94 Floor 7; Clamping to ends of floor Floor 7; Close up of holding down bolts to end of clamping beam Page 276

95 Floor 7; View of clamping down to end of floor Refer to photographs for Floor 2 for ceiling system details. Page 277
96 11.9 FLOOR 8 Page 278


97 Floor 8; Cross beam above to support ends of floor joists with separate joist to support edge of ceiling Floor 8; General arrangement of 0 LVL joists and support off cross beam with separate joist to support edge of ceiling Page 279

98 Floor 8; View of cross beam showing joist hangers Refer to photographs for Floor 2 for ceiling system details. Page 2
99 11.10 FLOOR 9 Refer to photographs for Floor 2 for ceiling system details. Page 281
100 11.11 FLOOR 10 Page 282

101 Floor 10; Underside of Floor showing supporting beam at end. Page 283
102 11.12 FLOOR 11 Page 284

103 Floor 11; Underside of Floor. Page 285
104 11.13 FLOOR 12 Page 286


105 Floor 12; View of underside of floor showing four transverse stiffening beams Floor 12; View of cross beam and plywood flooring from above Page 287


106 Floor 12; General view of underside of floor showing four transverse beams and cross beam supporting joists on both sides Page 288


107 Floor 12; Close up of end of steel rod showing 1x1x10mm steel plate with 35x35 square washer, spring washer, washer and nut Floor 12; Shows solid blocking using 0x45 LVL and end of post tension rod on penultimate joist Page 289
108 11.14 FLOOR 13 Page 290

109 Floor 13; Illustrates two transverse beams under floor Page 291
110 11.15 FLOOR 14 Refer to photographs for Floor 2 for ceiling system details. Refer to photographs for Floor 13 for joist system details. Page 292

111 11.16 FLOOR 15 Page 293


112 Floor 15; Ends of post tensioned beams Floor 15; Floor joist to transverse beam junction, shows steel rod below central axis of beam Page 294


113 Floor 15; Simply supported ends of joists with boundary joist continuously supported Page 295


114 Floor 15; Shows 0 deep I joists at 0 centres with two central transverse beams up to penultimate joist Page 296


115 Floor 15; General view of the ends of the transverse beams Floor 15; View of ends of 0 I joists supported on joist hangers off cross beam Page 297
116 11.17 FLOOR 16 Page 298
117 11.18 FLOOR 17 Page 299


118 Floor 17; View of partially full cavity. Floor 17; Side view of partially full cavities. Refer to photographs for Floor 2 for ceiling system details. Page 0
119 11.19 FLOOR 18 Page 1

120 Floor 18; View of full cavities. Refer to photographs for Floor 2 for ceiling system details. Page 2
121 11. FLOOR 19 Refer to photographs for Floor 2 for ceiling system details. Page 3
122 11.21 FLOOR Page 4


123 Floor ; Ends of joist supported on joist hangers off the cross beam Floor ; General view from above of 0 I joists with two transverse beams Page 5


124 Floor ; Close up view of the two transverse beams Floor ; General view of the Hebel floor Page 6


125 Floor ; Junction of Hebel floor to test rig reinforced concrete beam Floor ; General view of the underside of the Hebel floor Page 7


126 Floor ; End of transverse beams Floor ; Hebel floor panel section Page 8


127 Floor ; Hebel floor panel section - 2 Floor ; One end of joists supported on joist hangers off cross beam Page 9
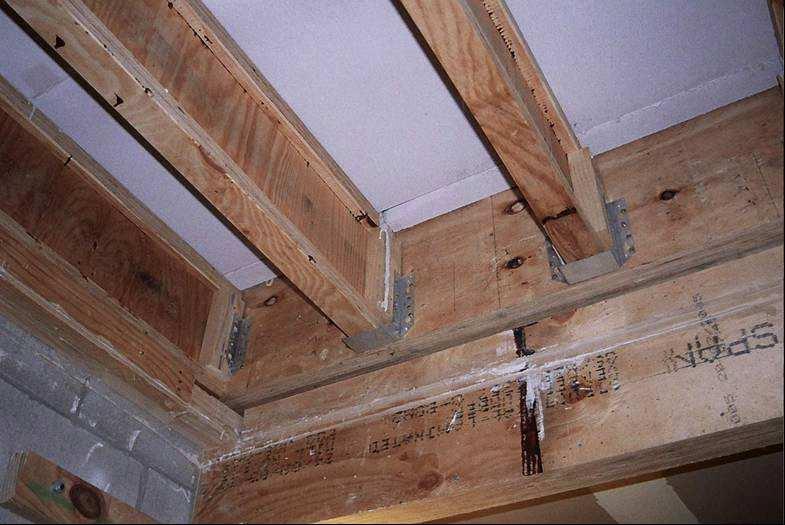
128 Page 310


129 Floor ; One end of joists simply supported on 100x timber ground off blockwork Floor ; View of floor structure before Hebel flooring placed in position Page 311

130 Floor ; End of transverse beam before Hebel flooring in place, shows steel rod on central axis of beam Refer to photographs for Floor 2 for ceiling system details. Page 312
131 11.22 FLOOR 21 Refer to photographs for Floor 2 for ceiling system details. Page 313
132 11.23 FLOOR 22 Page 314


133 Floor 22; First pour of gypsum concrete on polyethylene foam underlay with taped joints Floor 22; Completed gypsum concrete flooring, depth ranged from 10 to 46mm with average of 29mm thick Refer to photographs for Floor 2 for ceiling system details. Page 315
134 11.24 FLOOR 23 Page 316
135 11.25 FLOOR 24 Page 317


136 Floor 24; ceiling separation at sides Floor 24; Ceiling separation at ends Page 318


137 Floor 24; Close up of ceiling separation at corner Floor 24; Close up of Shearflex rubber pads Page 319
138 11.26 FLOOR 25 Page 3
139 11.27 FLOOR 26 10mm Acoustic Sealant Wallboard Adhesive & plaster gap fill 90mm Plaster Cove Wallboard Adhesive Floor 26; Edge detail of coving fixing to ceiling edge. Page 321

140 Floor 26; Coving in corner. Page 322