IOOS Coastal and Ocean Modeling Testbed (COMT)
|
|
|
- Margery Fisher
- 5 years ago
- Views:
Transcription
1
2 IOOS Coastal and Ocean Modeling Testbed (COMT) SLOSH s local meshes fail to capture regional processes. o Response characteristics of a storm surge model influenced by domain size and boundary conditions (Blain et al. 1994). o Large domains important for correctly capturing regional processes and improving model solutions. Shortcomings also associated with poor mesh resolution. o SLOSH is a structured model which limits its degree of localized resolution.


3 The Next Generation SLOSH Grids Developing larger basins with higher resolution to improve surge representation and accuracy. Includes latest topography/bathymetry data for improved representation of coastline and explicit features (e.g., levees, barriers, gaps, passes, and other local features). Explicitly model the impacts of waves in regions of steep-sloped environments (i.e., Puerto Rico/U.S. Virgin Islands surge and wave inundation model testbed). Hurricane Ike (2008)
4

")


5 SLOSH Grid Updates MS7 Grid (175X189) 33,075 Cells MS8 Grid (655X852) 558,060 Cells Grids being updated 1. U.S. Virgin Islands 2. Texas 3. Hawaii 4. South Florida

6 New South Florida Basin Replaces several existing SLOSH grids providing improved (seamless) results over Florida. Improves resolution, especially over greater Miami area. Captures coastally trapped kelvin waves.


 636,000")

7 SLOSH Grid Updates U.S. Virgin Islands Grid (999X1100) 1,098,900 Cells South Florida (424X1500) 636,000 Cells Oahu(382X1100) 420,200 Cells Oahu(818X705) 576,690 Cells


 Minimize unnecessary overlap and use the")


8 Developing Basin Masks Current techniques Utilize SLOSH basin building and surge modeling expertise at NHC/MDL to refine the grids Retain regions for which the basins were designed to cover based on hurricane evacuation studies (HES) Minimize unnecessary overlap and use the high-resolution / center portion of grids Edit on a cell-by-cell basis to retain key features Future work Version 2 (2016): incorporate new SLOSH basins, full data dissemination (NHC website), updated DEM, etc.


9 Example GIS Processing


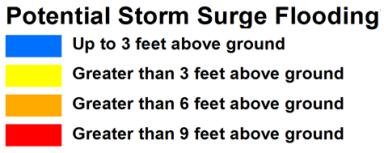
10 Storm Surge Inundation Experimental Inundation Graphic: Potential storm surge flooding for a given storm. SLOSH Maximum of Maximums: Education and awareness tool for anyone living in hurricane-prone coastal areas along the U.S. East and Gulf Coasts. Shows near worst case storm surge flooding (inundation) scenarios.


11 SLOSH MOMs to NYC Evacuation Zones NYC Evacuation Cat NYC 4, Zones Evacuation High / Tide Cat Anomaly 4, Zones High Tide Anomaly


12 Mexico Storm Surge Demonstration Project o o o o Explore the feasibility of using SLOSH within WMO RA-IV: o Initial scoping project in the Yucatan Peninsula due to data availability Collaboration between RSMC-Miami, Florida International University, and the Coastal Processes and Engineering Laboratory of the Sisal Academic Unit of the Engineering Institute of the UNAM Establish a technical foundation for the CIFDP-C Establish a framework for sharing storm surge modeling expertise and data between RSMC Miami and RA-IV member nations


 Developed by:")
13 SLOSH Basin for Yucatan Peninsula Grid expansion into international waters. First ever SLOSH basin for the Yucatan Peninsula. Working to understand IT requirements and data necessary to develop SLOSH within Mexico. Hyperbolic Grid: 529 x 1620 (856,980 cells) Developed by: Wilmer Rey Sánchez (MEX) LIDAR data
14