12th National Conference on Transportation Asset Management July 14 July 17, 2018
|
|
|
- Martha Bishop
- 5 years ago
- Views:
Transcription
 for NJDOT Initial TAMP 1 Harjit S. Bal, P.E.")
1 New Jersey Department of Transportation Division of Bridge Engineering & Infrastructure Management Bureau of Structural Engineering & Bridge Management 12th National Conference on Transportation Asset Management July 14 July 17, 2018 Utilization of AASHTOWare's Bridge Management (BrM) for NJDOT Initial TAMP 1 Harjit S. Bal, P.E. Project Engineer Structural Evaluation & Bridge Management New Jersey DOT Harjit.Bal@dot.nj.gov Tel.: By Josh Johnson Senior Product Manager, Asset Performance Bentley Systems, Incorporated Joshua.Johnson@Bentley.com Tel.:

2 2 Outline Initial TAMP needs Bridge Management System BMS Challenges NJDOT BMS Timeline Responsibilities of NJDOT BMS NJDOT Bridge Elements NJDOT Elements Expert Elicitation NJDOT Elements Deterioration Modeling NJDOT Elements Relative Weights NJDOT Bridge Health Index NJDOT Conversion Profile NJDOT Utility Tree NJDOT Action-Benefit-Cost Model NJDOT Life Cycle Policies NJDOT Risk-Based Analysis Model NJDOT Projects and Program Model

3 3 Initial TAMP needs Out of seven (7) National Goals focus on Infrastructure Condition Maintain Highway Infrastructure Asset System in a State of Good Repair Using Data driven methodology Develop and evaluate Performance Measures Develop and set Performance Targets Manage network at minimum practical cost to Improve and/or preserve Asset conditions Improve Network Performance Implement Risk-based analysis Initial TAMP submitted April 2018 [23USC 150(b)] Safety Infrastructure Condition Congestion Reduction System Reliability Freight Movement and Economic Vitality Environmental Sustainability Reduced Project Delivery Delays
 BMS minimum capabilities Data collection, storage and reporting Predictive (Deterioration) Modeling Benefit-Cost Analysis over life of the assets Identifying short- and long-term budget needs")
4 4 Bridge Management System Bridge Management System (BMS) assists in fulfilling: National Bridge Inspection Standards (NBIS) MAP-21 Legislation Asset Management Plan Rule (23 CFR ) BMS minimum capabilities Data collection, storage and reporting Predictive (Deterioration) Modeling Benefit-Cost Analysis over life of the assets Identifying short- and long-term budget needs Compare Alternate strategies to maximize benefits Recommend Projects for a given program Historical Analysis is a key to support decision making Source: Victory Bridge, NJ at


5 5 BMS Challenges Work within limited resources Objective 1 System information & knowledge Limited history for NBE data Calibrate Modeling capabilities Standardize analysis tools & formulas Calibrate Optimizer Objective 5 Objective 2 Multiple Objectives for decision making utilizing BMS tools Optimal allocation of resources between competing bridges at any given time Logical, quantifiable, data driven, rule-based framework Objective 4 Source: BrM Technical Manual Objective 3

6 6 NJDOT BMS Timeline NJDOT Bridge Elements Inspection Manual 2014 Training and Field Collection initiated Migration of CoRe Elements to NBE Upgrade InspectTech to Version Upgrade Pontis 4.3 to BrM Initial Deterioration Modeling 2016 Upgrade from BrM to BrM First Training on BrM Initial Action-Benefit-Cost Modeling 2017 Calibrated BrM for Initial TAMP Stabilize InspectTech 7.5 to BrM data transfer Web Services Implement Final TAMP in BMS Stabilize BrM and Upgrade to BrM Source: eng/structeval/pdf/bridgeelinsman ual.pdf

 Lifecycle Planning for Future and Planned Projects Risk-Based Bridge-Level, Network-Level Analyses")
7 7 Responsibilities of NJDOT BMS Federal Compliance Data Submittals and Validation as per MAP 21 Act (now FAST Act) NBIP Oversight 23 Metrics for bridges Internal needs Upper Management data requests Maintenance, support, management, and development BMS tools Training for In-house staff, Consultants and Owners Perform Data Analysis Perform Historical Evaluation (Spider chart example) Initiate new projects (Limited and Full scope) Lifecycle Planning for Future and Planned Projects Risk-Based Bridge-Level, Network-Level Analyses Budget forecasting


8 8 Responsibilities of NJDOT BMS Interaction with other systems, data warehouse, Research, Data Sharing Support to Overweight Permits, Load rating, Cost proposals, Inspection Projects Asset Management & Management Reports Bentley s InspectTech CombIS 7.5 AASHTOWare s Bridge Management BrM 5.2.3


9 9 Responsibilities of NJDOT BMS Combined Inspection System (CombIS) NJDOT s customized Bentley s InspectTech Version 7.5 Front End Data Collection Repository of Assets - NBIS Bridges, Minor Bridges, OHSS, HMLP Historical Records Storage & Management Online Inspection Reporting and Workflow AASHTOWare s Bridge Management (BrM) Version Repository of Assets - NBIS Bridges, State Minor Bridges, Tunnels Data Analysis tool for NJDOT Deterioration and Action-Benefit-Cost Modeling Program Optimization & Scenarios Project creation and alignment with STIP


10 10 Responsibilities of NJDOT BMS NJDOT adopted BrM for TAMP Historically used Pontis/BrM for NBI BrM User Group Meetings (BrMUG) Next annual meeting in September 2018 Owned by AASHTO Voting rights for future enhancements Task Force is made of State DOT representatives (40+ States) Additional Benefits of BrM and BrMUG Aligned with other AASHTOWare products Easy to share customized modules between different States Easy to implement initial settings

11 11 Responsibilities of NJDOT BMS Installed BrM Web Server BrM Enterprise version Installed BrM Database Oracle 12c Developed NJDOT Bridge Filters Security setup for admins and users Updated Database Tables Parameters & Data Dictionary USER Used Visual Editor tool for agency modifications Web Services setup for importing data from CombIS 7.5


12 12 Responsibilities of NJDOT BMS Elements and Defects setup Action-Benefits-Cost Network Policies Life Cycle Policies NBI Converter Utility Tree Frozen Projects Program Planning and Optimization Program Settings Budget allocation Performance Target, Scenarios Program Results, Project assignments

13 13 NJDOT Bridge Elements Implemented in BrM as per NJDOT Bridge Element Inspection Manual Expert Elicitation used for Transition Year & Relative Weights NJDOT uses collected element data For condition forecasting for the entire network Each Element Deterioration is considered individually For condition forecasting of each bridge based on Bridge Specific Elements within the bridge Bridge specific Health Index Adjustment Factors for Transition years Protection, Environment, User defined
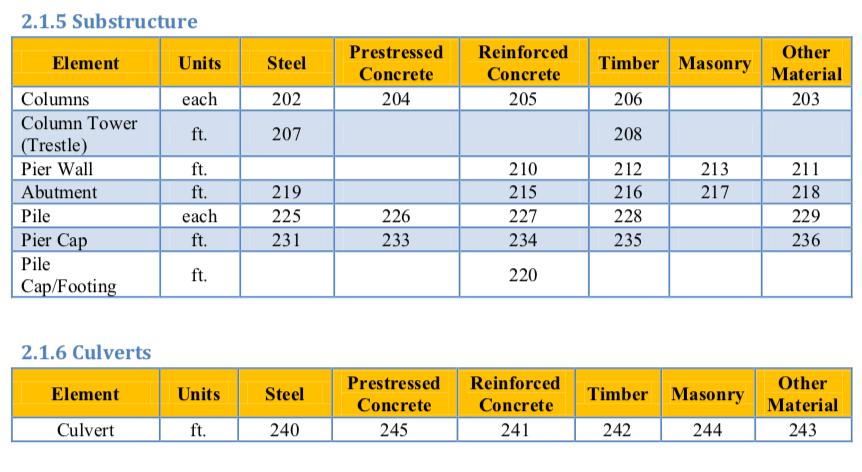
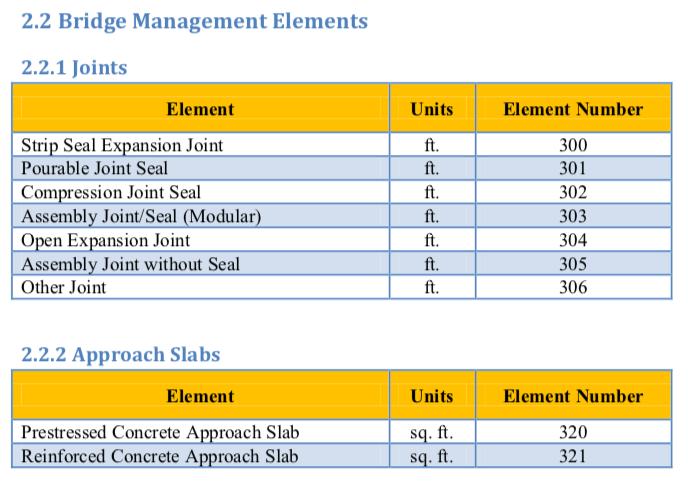
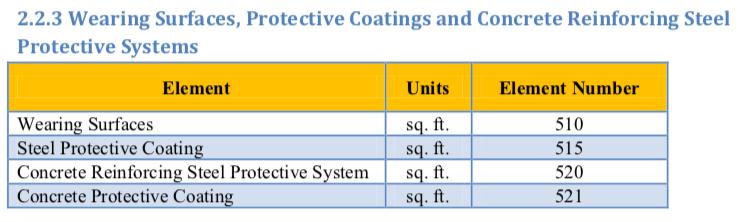
14 14 NJDOT Bridge Elements National Bridge Elements (NBE) Simple, flexible, and effective way to standardize bridge conditions across the nation Easy to quantify in four (4) condition states GOOD (CS 1), FAIR (CS 2), POOR (CS 3), and SEVERE (CS 4) Structure of NJDOT Bridge Elements Inspection Manual NBEs Primary Structural Components DECK, SUPERSTRUCTURE, SUBSTRUCTURE, CULVERT BMEs Joints, Wearing Surfaces, Protective coating systems, Deck/Slab protection systems ADEs NJDOT defined Elements, Protective Systems, or Independent UNITS, QUANTITY MEASUREMENT, DEFECTS, COMMENTARY, Examples Training to in-house staff and Consultants community Implement field collection and recording using CombIS

15 15 NJDOT Bridge Elements

16 16 NJDOT Bridge Elements

")
17 17 NJDOT Bridge Elements ed)

18 18 NJDOT Elements Expert Elicitation

19 19 NJDOT Elements Expert Elicitation Assumed no intervention for Element Deterioration Transition Years Compared with other States and BrM Defaults Included Protective Systems and ADEs Experts from Bridge Inspection, Design, Maintenance Multiple elicitations whenever needed Example: Elem 12 & Elem 510 Deterioration Curves developed using Expert Elicitation
20 20 NJDOT Elements Deterioration Modeling Markovian Model Uses probability theory to model random changes Assumes, the future state depends on the current state Markovian Model can be expressed as a Transition Probability Matrix BrM uses four (4) State Transition Probability Matrix The median number of years that a unit of the element stays in state i, before transition to the next condition state The typical median years to transition for state i


21 21 NJDOT Elements Deterioration Modeling Markovian Model Transition Probabilities are used to forecast condition states for each year in the future Limitations of Markovian Model Element age is not considered Future state depends on the current state only & does not consider any past events such as maintenance or preservation Rate of initial deterioration is too rapid To overcome such limitations Need a separate function that account for improved or had improved conditions Need modifiers or factors that slow deterioration

22 22 NJDOT Elements Deterioration Modeling Weibull Model: A continuous Probabilistic Model, Time, Age of the element Source: BrM Technical Manual
 for CS1 to")


23 23 NJDOT Elements Deterioration Modeling BrM Deterioration Model NOTE: uses Weibull (Modified Markovian) for CS1 to CS2 uses Markovian for CS2 to CS3 CS3 to CS4 Pure Markovian Model is not being used for CS1 to CS2, due to the unrealistic steady deterioration rate Condition State 1 Good Condition State 2 Fair Condition State 3 Poor Condition State 4 Severe

24 24 NJDOT Elements Deterioration Modeling Combined Adjustment Factor All the factors are multiplied together to estimate: An overall adjustment factor Adjust the median years to transition for the element The median number of years that a unit of the element stays in state i, before transition to the next condition state Source: BrM Technical Manual
25 25 NJDOT Elements Deterioration Modeling Combined Protection Factor Models Protective System on the Primary (or Base) Element Increases median years of the base element Value 1.0 Example: A new Protective System will mitigate the existing rate of deterioration and provide better protection to the base element Protective system with a higher deterioration rate and in poor condition state provides no or minimal protection for the base element Source: BrM Technical Manual
,")

26 26 NJDOT Elements Deterioration Modeling Environment Factors NJDOT uses Moderate (3), Severe (4) NJDOT Adopted BrM Default Environments: Source: NJDOT Bridge Element Inspection Manual

27 27 NJDOT Elements Deterioration Modeling Environmental Factors Elements deteriorate at different rates based on the surrounding conditions & exposure Every element has an environmental factor Constant factor associated with a corresponding environment Dry arid climate Vs. Moisture & Salt in a coastal environment

28 28 NJDOT Elements Deterioration Modeling Formula Factor Modifies the deterioration curves for other than Protection and Environment factors User defines their own formulas For example Local Environments Factors for Bearing Elements Limitation Varies as a function of Joint Element versus no Deck Joints Global Environments for Statewide zones Weather and/or Deicing Chemical Zones versus Coastal Zone Northern versus Southern New Jersey Regions Only one formula per element Northern Region Southern Region Source:
29 29 NJDOT Elements Relative Weights Used in Health Index calculation for a bridge Definition: Relative importance of one element to the other elements (within BrM World) Cost-based analysis is performed initially to compare quantities (q) in different units Element Unit Cost (uc) based on Bid Express (BidX) Rutgers University - RIME Team Approaches: (1) (2)
30 30 NJDOT Element Relative Weights Refined by Cluster-based analysis based on Main Material and Design Type 6702 NBIS Bridges analyzed 67 Clusters of bridges based on NBI ITEM 43A (Material) NBI ITEM 43B (Structure Type) Cluster Category Number of Bridges 1 PS Concrete Box Beam-Mult Steel Stringer-Multi-beam PS Concrete Stringer-Multi-beam Wood-Timber Stringer-Multi-beam Steel Cont. Stringer-Multi-beam PS Concrete Slab Wood-Timber Slab Concrete Slab Concrete Cont. Slab Steel Truss-Thru Concrete Culvert Steel Floorbeam Masonry Arch-Deck Concrete Arch-Deck PS Concrete Box Beam-Sing Concrete Frame 142 Partial Total 6321
31 Elm. Key Comparison Description NJDOT Element Relative Weights PS Conc Box Beam- Steel Stringer-Multibeabeam Multi-beam Multi-beam PS Conc Stringer-Multi- Wood-Timber Stringer- Steel Cont. Stringer- Category PS Conc Slab Mult. Approach (1) (2) (1) (2) (1) (2) (1) (2) (1) (2) (1) (2) #Bridges 539 2, Unit Cost 12 Re Concrete Deck Pre Concrete Deck Pre Concrete Top Flange Re Conc Top Flange Steel Deck - Open Grid Steel Deck - Conc Fill Grid Steel Deck - Orthotropic 1, Timber Deck Re Concrete Slab PSC Slab Timber Slab Other Deck Other Slab Steel Clsd Box Gird Pre Clsd Box Girder Re Clsd Box Girder Othr Clsd Web/Box Girder Steel Opn Girder/Beam Pre Opn Conc Girder/Beam Re Conc Opn Girder/Beam Timber Open Girder Other Open Girder/Beam Steel Stringer Pre Conc Stringer Re Conc Stringer Timber Stringer Other Stringer Steel Truss 3,
32 32 Bridge Health Index NJDOT Bridge Health Index Numerical value reflecting the overall condition of the bridge Weighted average of the percentage distribution in each condition state Health Index = Weighted Average of Quantity * Health Index of Each Element Source: BrM Technical Manual

33 33 NJDOT Bridge Health Index Bridge Health Index Example Source: BrM Technical Manual
34 34 NJDOT Conversion Profile Bridge Condition Ratings are evaluated using two philosophies COMPONENT (NBI) Condition Ratings Deck, Superstructure, Substructure, Culvert ELEMENT (NBE) Condition Rating Converter Four (4) Condition States for different elements NJDOT utilizes Element Deterioration based on NBE Condition State Ratings Performance Measures are reported based on NBI Component Ratings BrM Converter translates NBE Condition State Ratings to NBI Component Ratings Classify each element into their functional components Generic, Deck, Superstructure, Substructure


35 35 NJDOT Conversion Profile FHWA Converter too strict to produce reasonable results. Resulting in too many FAIRs NJDOT Converter design to soften around the GOOD and FAIR conditions Helps in correctly getting benefits of Major Rehab work to GOOD than FAIR.

36 36 NJDOT Utility Tree Utility Theory-Quantify the amount of satisfaction Structure of Utility Tree in BrM Goals are represented in the first layer of Utility Tree To maximize Total Utility value Objectives are represented in the second layer of Utility Tree Condition Value- Maximum Structural Condition Life Cycle value- Minimize Life Cycle Cost Mobility Value- Maximize Mobility of Travelers Risk Value- Minimize Risk Criteria is represented in the third layer of Utility Tree Assessment of the objectives Example: Condition is assessed by Element Health indices as well as NBI Components

37 37 NJDOT Utility Tree
38 38 NJDOT Action-Benefit-Cost Model Why Actions are needed? Representation of work to be done on the bridge Proactive strategy rather than reactive Predictive Modeling and Forecasting performance Optimal action at an optimal time Why Benefits are Needed? To claim future credit for a future action Overall goal is to keep the asset in a State of Good Repair To mitigate deterioration Why Cost Modeling is needed? Common unit of measure for comparison is $ MAP-21 requires Minimum Practical Cost These modeling concepts are collectively used in BrM Optimization
39 39 NJDOT Action-Benefit-Cost Model Initial setup include creating seven (7) NJDOT Actions NJDOT approach: Less number of major Actions for initial setup, and More granular Benefit groups Network Level actions created Scope-based actions NJDOT Actions used in BrM for Initial TAMP NJ BRIDGE REPLACE NETWORK NJ DECK REPLACE NJ SUPER REPLACE NJ BRIDGE PRESERVE NJ DECK REHAB NJ SUPER REHAB NJ SUB REHAB Complete Scope - Bridge Replacement Limited Scope Deck and/or Super Replacement Bridge preservation scope Future Needs: Unit Cost/ Override Cost Elem 1 Benefit Include bridge maintenance actions Include more granular preservation actions Focus on bridge level actions also Action Elem N Benefit
40 40 NJDOT Action-Benefit-Cost Model Action Deferment Rules for each of the action Deferment Years for each BrM Action NJ Bridge Replace Network NJ Deck Replace NJ Super Replace NJ Bridge Preserve NJ Deck Rehab NJ Super Rehab NJ Sub Rehab NJ BRIDGE REPLACE NETWORK x x x NJ DECK REPLACE x x x NJ SUPER REPLACE x x x NJ BRIDGE PRESERVE x x x NJ DECK REHAB x x x x x x x NJ SUPER REHAB x x x x x x x NJ SUB REHAB x x x x x x x

41 41 NJDOT Action-Benefit-Cost Model Initial calibration was done by focusing on CONDITION parameter only Four (4) Network Policies implemented using NBI 58, NBI 59, NBI 60, NBI 62 NJ Bridge Replace NJ Deck Replace NJ Super Replace NJ Bridge Preserve Follow-up actions were included based on feasible combinations
42 42 NJDOT Action-Benefit-Cost Model
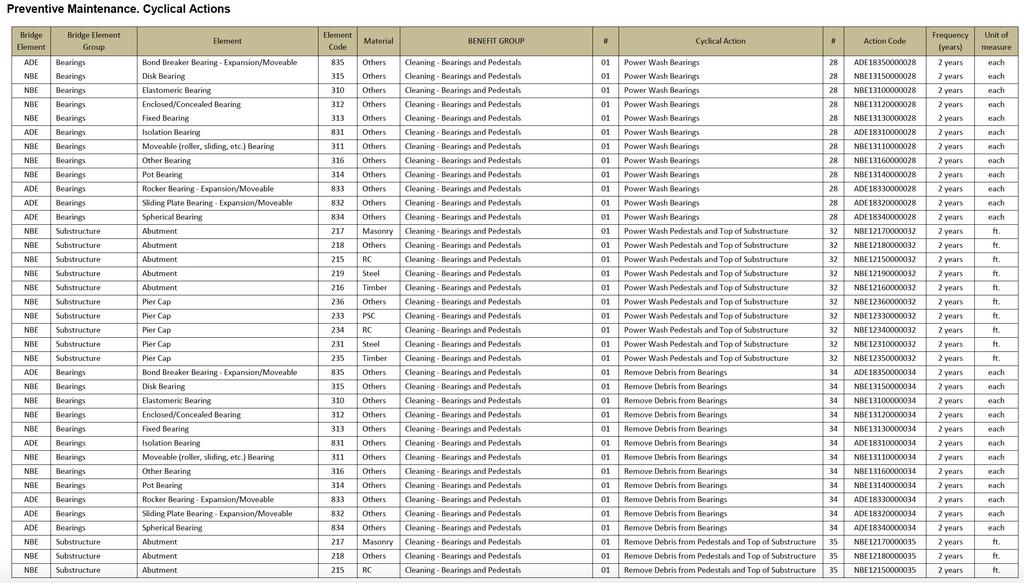
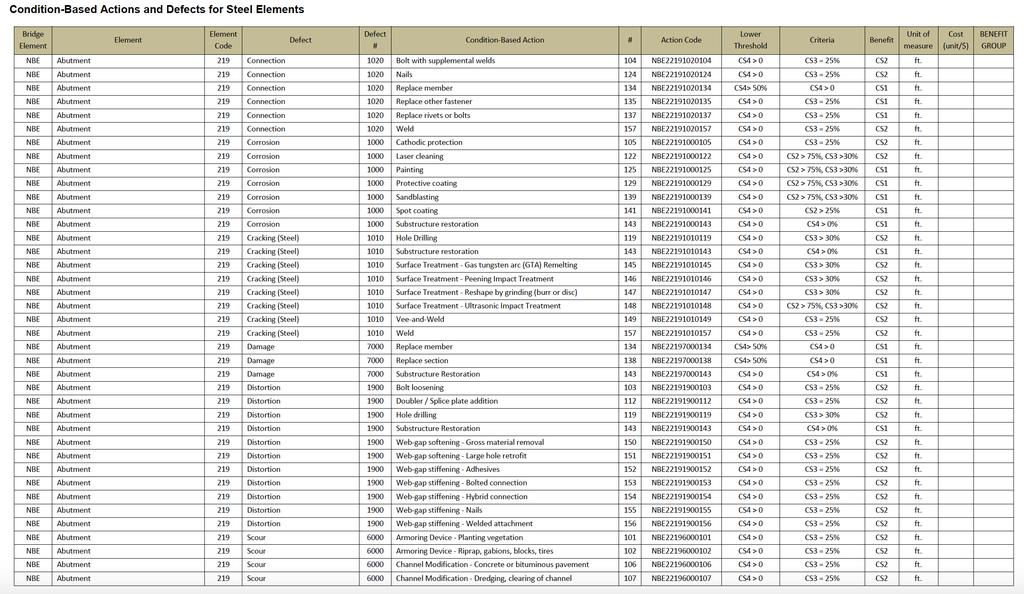
43 43 NJDOT Action-Benefit-Cost Model Benefit Modeling (Initially utilized Rutgers University CAIT Team) Granular benefit groups, Utilized child-linking to already created benefits Future Benefit Group Modeling (ELEMENT and DEFECT Combinations) Benefit Groups for Cyclical Activities Preventive Maintenance Cyclical Activities Condition-Based Actions for Steel Elements Condition-Based Actions for Reinforced Concrete Elements Condition-Based Actions for Pre-Stressed Concrete Elements Condition-Based Actions for Timber Elements Condition-Based Actions for Masonry Elements Condition-Based Actions for Drainage System Elements Condition-Based Actions for Bearings Condition-Based Actions for Joints Condition-Based Actions for Protective System Elements
44 44 NJDOT Action-Benefit-Cost Model
45 45 NJDOT Action-Benefit-Cost Model
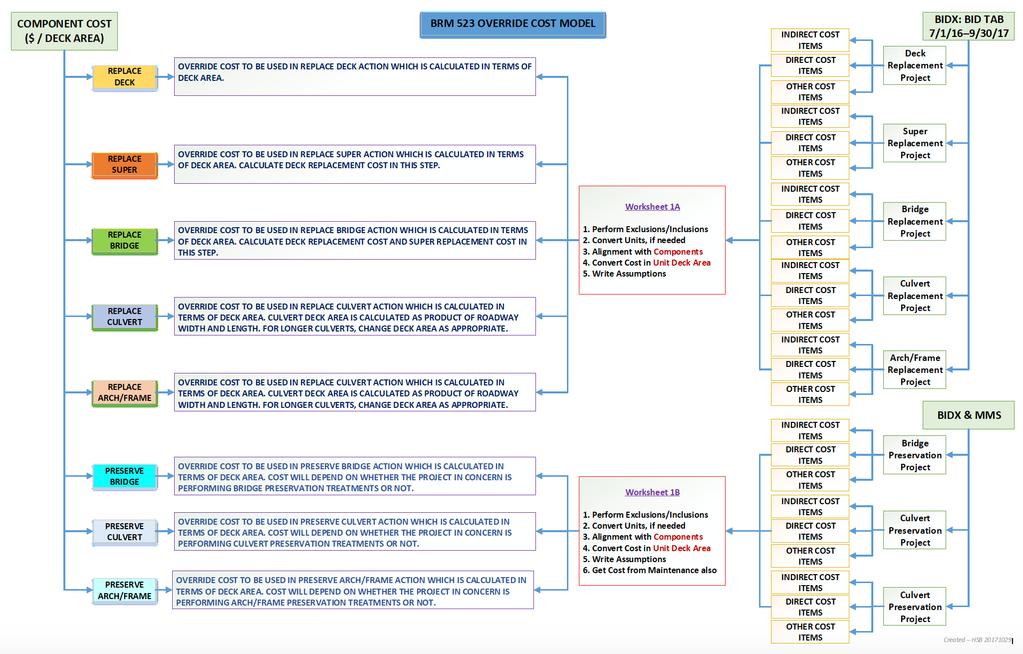
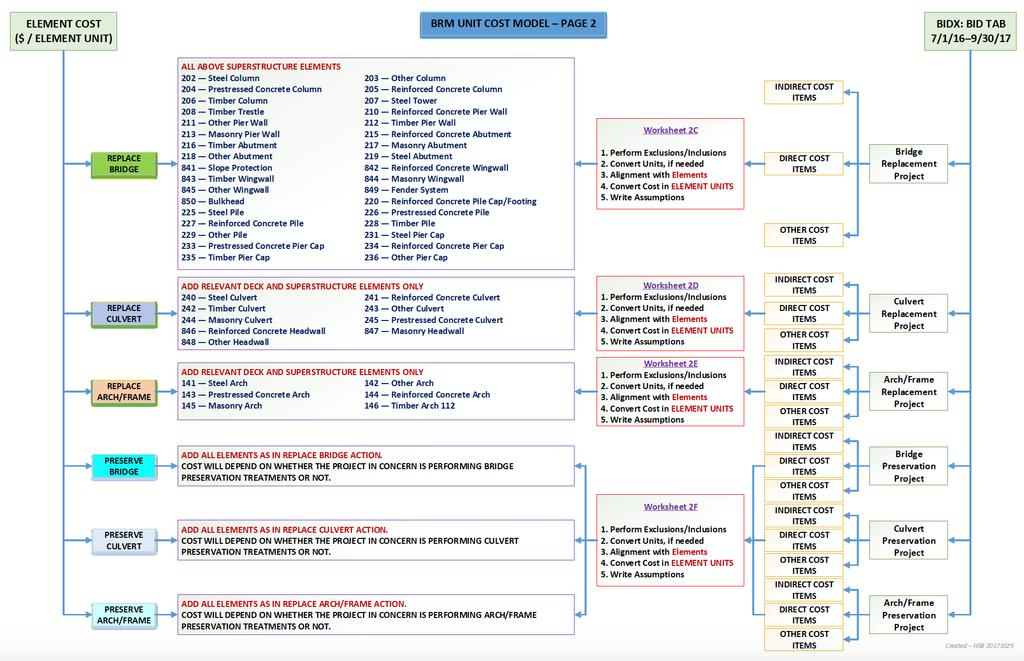
46 46 NJDOT Action-Benefit-Cost Model Initial Cost Modeling setup by using BrM OVERRIDE COST BY DECK AREA For each of the seven (7) NJDOT Action in BrM Analysis done by using actual Construction cost from Bid Express (BidX) Project by project analysis performed Data used from years 2015, 2016, 2017 Component level Costs were evaluated by prorating the total bridge and project cost About 121 bridges were analyzed for component cost evaluation Future Cost Modeling: Element level Unit Costs Construction ITEMS Units versus BrM ELEMENT Units Cost of $1 is same Needs alignment of quantities Validate by utilizing Rutgers University - RIME Team
47 47 NJDOT Action-Benefit-Cost Model
48 48 NJDOT Action-Benefit-Cost Model Initial Action Override Cost by Component level approach NJDOT Actions in BrM Direct Construction Cost in $ per Deck Area SF Indirect Construction Cost in % of Direct Construction Cost Total Construction Cost in $ per Deck Area SF Other Cost in % of Total Construction Cost Total Cost in $ per Deck Area SF BrM 523 Overriding Cost in $ per Deck Area in SF BrM 523 Indirect Cost in % of Overriding Cost NJ BRIDGE REPLACE $1,081 18% $1,278 60% $2,045 $1,672 18% NJ DECK REPLACE $264 19% $314 30% $408 $330 19% NJ SUPER REPLACE $444 21% $538 30% $700 $552 21% NJ BRIDGE PRESERVE $125 10% $138 0% $138 $125 10% NJ DECK REHAB $75 15% $86 0% $86 $75 15% NJ SUPER REHAB $90 15% $104 0% $104 $90 15% NJ SUB REHAB $75 15% $86 0% $86 $75 15%
49 49 NJDOT Action-Benefit-Cost Model
50 50 NJDOT Action-Benefit-Cost Model

51 51 NJDOT Life Cycle Policies Life Cycle Policy is independent of budget constraints, but considers conditions, cost, NPV Preservation & Replacement Policy 5 Policies created by NJDOT Each policy includes multiple LCCA Policy Rules listed in order for implementation LCCA Policy Rules In this case, each rule is assigned to one resulting action Rules are based on NBI Component ratings (Item 58, 59, 60 & 62) LCCA Assign Policies Life Cycle Policies are applied to each bridge asset

52 52 NJDOT Life Cycle Policies
53 53 NJDOT Life Cycle Policies
54 54 NJDOT Risk-Based Analysis Model Initial RBP Tool by Rutgers University CAIT Seismic Liquefaction (Safety: Geotech/Hydraulic) Flood (Safety: Geotech/Hydraulic) Scour (Safety: Geotech/Hydraulic) Vessel Collision (Safety: Geotech/Hydraulic) Seismic (Safety: Structural) Fatigue (Safety: Structural) Construction Details & Conditions (Safety: Structural) Overload (Safety: Structural) Durability (Condition and Durability) Vehicle Collision (Condition and Durability) Vehicular Safety (Operations)


55 55 NJDOT Risk-Based Analysis Model Currently Refined by Rutgers Univ. RIME Team More aligned with BrM Risk Module Includes Probabilistic approach rather than cummulative 2-Dimensional concept Will be used for Bridge-Bridge Risk Assessment in BrM Source: Rutgers University RIME Team (patent pending)

56 56 NJDOT Projects & Program Model

57 57 NJDOT Projects & Program Model

58 58 NJDOT Projects & Program Model Program Input in BrM Program Name, Time period, Bridge Filter Scenarios SOGR versus Constrained NBI Convertor Inflation and Discount rates Network Policies

59 59 NJDOT Projects & Program Model Program Input in BrM cont.. Utility Tree Weight Profiles Condition Life Cycle Mobility Risk Subdivisions NHS Non-NHS

60 60 NJDOT Projects & Program Model Desired Performance Measure/Target Settings in BrM Built-in Performance Measures such as Percent POOR by Deck Area Percent GOOD by Deck Area Best and Worst Value settings Separate settings by subdivisions - NHS and Non-NHS
61 61 NJDOT Projects & Program Model Source: BrM Technical Manual (NJDOT BMS Manual development is in progress) Purpose of Optimization under Program Planning Module in BrM Automatically Generates Project Recommendation by Programs Maximize Utility and Performance Benefits under specific constraints Structure Weights provide flexibility for NJDOT specific calibration for selecting projects and the related performance measures determining the relative importance between bridges NJDOT is currently developing factors for Structure Weight based on Importance, Size, Location
 Projects")
62 62 NJDOT Projects & Program Model Frozen (or already programmed in STIP) Projects

63 63 NJDOT Projects & Program Model Program Results after Optimization Manual adjustment needed to incorporate Frozen Projects Bug Fix in BrM 5.2.3, Structure Weight Formula, Large Deck Area Bridge issue Currently using Updated/Patched version Currently validating the results with real world projects
64 64 NJDOT Projects & Program Model Example of Scenario Explorer SAMPLE only


65 65 Questions Thankyou all Any questions Demo Contributed by NJDOT BMS (BrM Team) -Vijay Sampat, Chandrahas Shah, Muhammad Asif Khan, Bhavesh Patel Josh Johnson and Zac Boyle from Bentley Systems Derek Constable from FHWA