UNIVERSITY SCIENCES BUILDING
|
|
|
- Kristopher Greene
- 5 years ago
- Views:
Transcription
1 UNIVERSITY SCIENCES BUILDING Northeast USA Senior Thesis 2011 Faculty Advisor: Andrés Lepage Kathryn Gromowski Structural Option

2 BUILDING INTRODUCTION SITE MAP New Laboratory/Classroom building Located in Northeast USA 138,000 SF Maximum Height: 94-3 Construction Cost: $50 Million August 2009-September 2011 LEED Gold (version 2.2)
3 PROJECT TEAM Owner: Not Released Architect: Diamond & Schmitt Architects, Inc. Associate Architect: H2L2 Architecture Planning Interior Design General Contractor: Turner Construction Structural Engineer: Halcrow Yolles Associate Structural Engineer: Keast and Hood Co. Mechanical Engineer: CEL International, Inc. Electrical Engineer: CEL International, Inc. Civil Engineer: Stantec Consulting Services, Inc.


4 ARCHITECTURAL FEATURES RENDERINGS Departure from surrounding campus architecture Façade is unique Stone/Aluminum Panels Windows 5-story atrium with biowall

5 EXISTING STRUCTURAL SYSTEM BAY SIZES Cast-in-place concrete pile foundations Bay sizes
6 EXISTING STRUCTURAL SYSTEM FILIGREE SLAB DETAILS Cast-in-place concrete pile foundations Bay sizes Filigree slab construction Structural steel mechanical levels
7 EXISTING STRUCTURAL SYSTEM LATERAL SYSTEM Cast-in-place concrete pile foundations Bay sizes Filigree slab construction Structural steel mechanical levels Cast-in-Place Concrete Shear Walls Braced frames at mechanical levels

8 ROOF HEIGHTS ROOF HEIGHTS PLAN 6 Roof Heights Office Roof Ledge Roof Atrium Roof 5 th Level Mech. Rm. Roof Chiller Room Roof AHU Mech. Rm. Roof
 Geotechnical report found for site on the CSUN campus Very similar to Northeast USA")
9 PROBLEM STATEMENT CALIFORNIA SITE Interest in seismic design New scenario created Building commissioned by California State University, Northridge (CSUN) instead Very close to Northridge fault (Northridge Earthquake in 1994) Geotechnical report found for site on the CSUN campus Very similar to Northeast USA site
10 PROPOSED SOLUTION GOALS 4 Designs undertaken in steel Code Minimum Moment Frame in Northeast USA (NE USA S-3) Code Minimum Moment Frame in California (CA S-3) Immediate Occupancy Moment Frame in California (CA S-1) Code Minimum Moment Frame augmented with Viscous Fluid Dampers to achieve Immediate Occupancy in California (CA S-3 with VFD) Comparison between different designs Original to NE USA S-3 (Concrete vs. Steel in current location) CA S-3 to NE USA S-3 (high seismic vs. low seismic) CA S-1 to CA S-3 (high performance, traditional method vs. minimum performance) CA S-3 with VFD vs. CA S-3 (high performance, high-tech method vs. minimum performance) CA S-3 with VFD to CA S-1 (traditional vs. high-tech)
11 GRAVITY REDESIGN MOMENT FRAME LAYOUT
12 NE USA S-3 SUMMARY STORY DRIFT RATIOS Weight 11,800 k Wind Base Shears N-S Direction 450 k E-W Direction 652 k Seismic Base Shear Both Directions 456 k
13 CA S-3 SUMMARY CA S-3 CONNECTIONS Weight 12,300 k Seismic Base Shear Both Directions 815 k
14 CA S-1 SUMMARY CA S-1 CONNECTIONS Weight 13,500 k Seismic Base Shear Both Directions 849 k
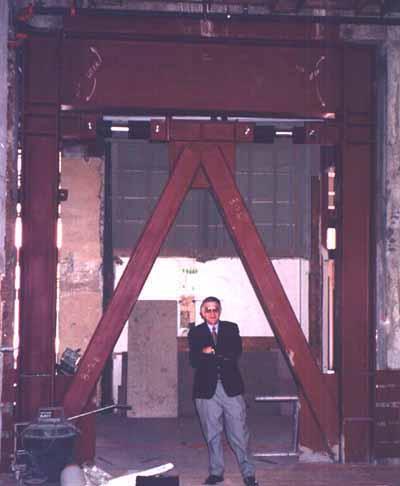

15 VFD INTRODUCTION VFD LAYOUT

16 PRELIMINARY SIZING MODELING PARAMETERS F=Cν α
17 INITIAL SCALING HISTORY APPLICATION Earthquake history records selected and scaled for nonlinear analysis Records selected were recommended in FEMA P695 Scaling was done in a two-step process Histories first applied to CA S-3 model as linear loads to verify earthquake selection Records scaled for 1.5% drifts Histories applied to CA S-3 with VFD model Dampers sized to achieve 0.7% drift

18 FINAL PARAMETERS FINAL SIZES
19 CA S-3 WITH VFD SUMMARY CA S-3 WITH VFD CONNECTIONS Weight 12,500 k Seismic Base Shear Both Directions 815 k

20 CA S-3 VS. CA S-3 WITH VFD CA S-3 CA S-3 with VFD

21 CM BREADTH SUMMARY COMPARISONS NE USA S-3 structure 5.6% less expensive, 50% lighter than original Longer duration unacceptable CA S-3 structure 1.6% more expensive, 4.5% heavier than NE USA S-3 Same duration as NE USA S-3 Cost associated with moving to a seismic region is small
22 COMPARISONS CA S-1 structure is 6% more expensive, 9.7% heavier than CA S-3 structure Impractical method to achieve higher performance CA S-3 with VFD is 1.5% more expensive, 1.5% heavier than CA S-3 structure Very efficient method of increasing performance Cost minimal in comparison to cost of replacing damaged system following an earthquake System very specialized and difficult to design
23 INTRODUCTION Building is now in California Feasibility of a solar photovoltaic system Life Cycle Assessment Payback Period Carbon Footprint (net after one year) Additional LEED points earned Feasibility of a green roof system Life Cycle Assessment Payback Period Carbon Footprint (net after one year) Additional LEED points earned


24 PV DESIGN SOLAR STUDY SHADING IMAGES Carried out using Google Sketchup Critical Days Winter Solstice, Summer Solstice, and Equinox Critical Times Sunrise, Sunset, and 1:00 PM (peak hour) Determined that Office Roof was the only suitable location


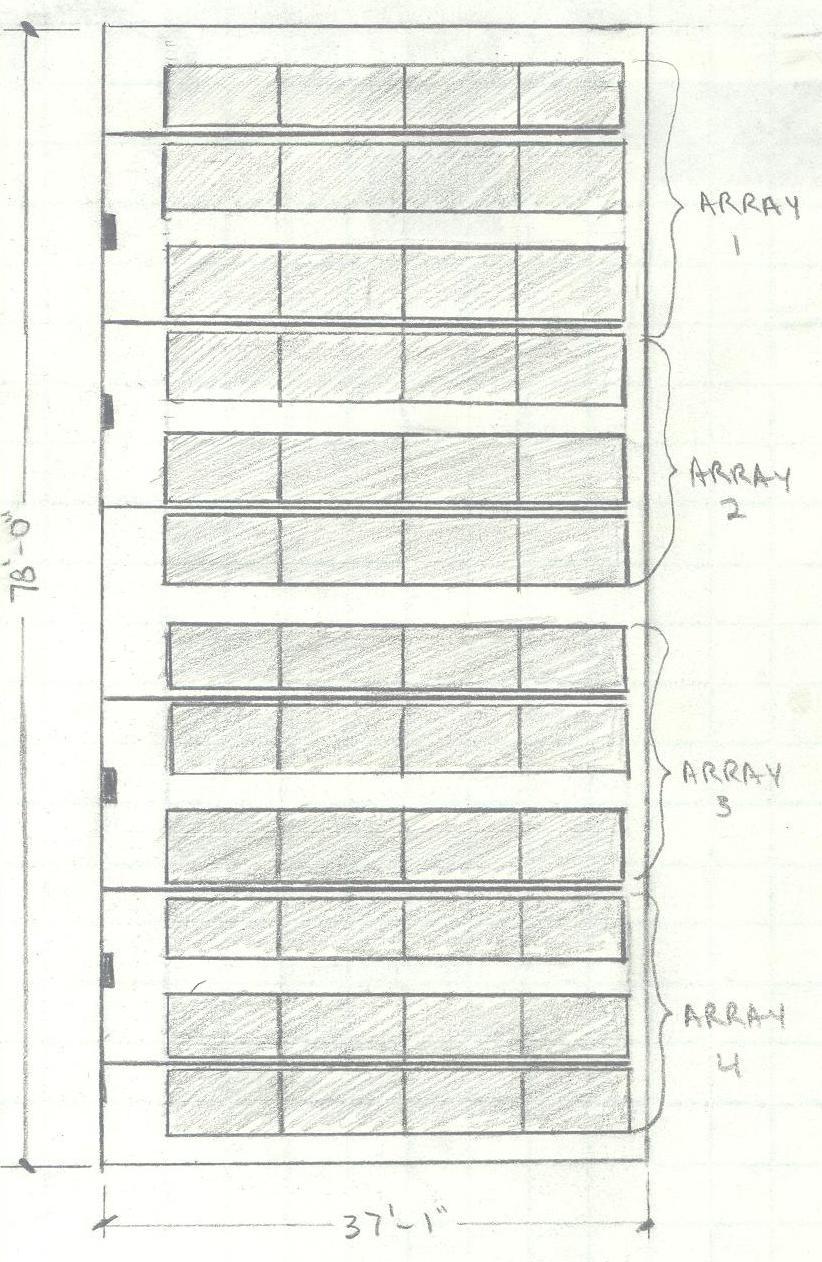
25 PV DESIGN SYSTEM SELECTION PV DESIGN PANELS


26 PV ANALYSIS LIFE CYCLE COST PV ANALYSIS PAYBACK PERIOD
27 PV ANALYSIS OTHER ANALYSES Carbon Footprint 2,570 lb CO 2e Additional LEED points earned 1 credit E&A Credit 2: On-Site Renewable Energy
 GreenGrid")
28 GREEN ROOF DESIGN SYSTEM SAMPLE INSTALLATION Extensive system chosen Shallower, lighter Not accessible, no occupied floors above Modular system chosen Ease of installation Ease of maintenance (both green roof and roof below) GreenGrid Roof

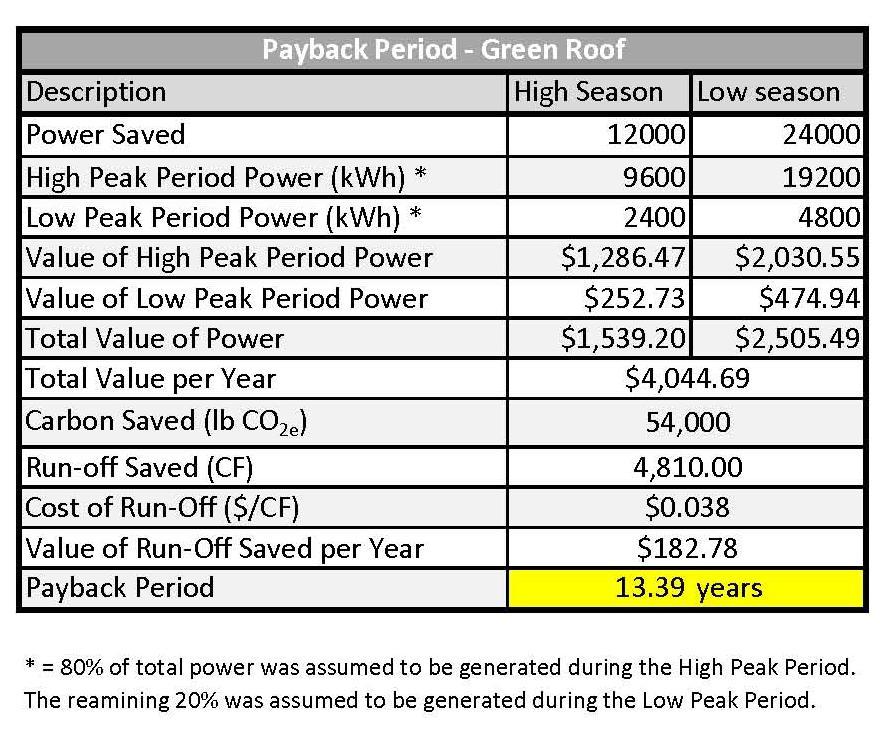
29 GREEN ROOF ANALYSIS LCA GREEN ROOF ANALYSIS - PP
30 GREEN ROOF ANALYSIS OTHER Carbon Footprint 154,500 lb CO 2e to install 54,000 lb CO 2e saved per year 100,500 lb CO 2e net at 1 year Will eventually go negative Additional LEED points earned 1 credit SS Credit 6.1: Stormwater Quantity Control

31 SUSTAINABILITY SUMMARY COMPARISONS LEED systems are the same All other analyses favor green roof
32 ACKNOWLEDGEMENTS Family and Friends Turner Construction Amy Cavanaugh Roger Gentry Scott Frank HGA Architects and Engineers Johanna Harris Paul Asp All AE Faculty and Staff Dr. Andrés Lepage QUESTIONS?