[TECHNICAL REPORT 3] Lateral System Analysis
|
|
|
- Kelly Tate
- 5 years ago
- Views:
Transcription

1 Science Center Research Park 3711 Market St. The Pennsylvania State University Department of Architectural Engineering Senior Thesis Prepared by: November 30, 2009 [TECHNICAL REPORT 3] Lateral System Analysis
2 TABLE OF CONTENTS EXECUTIVE SUMMARY... 4 INTRODUCTION... 5 CODE... 5 CODE / REFERENCES... 5 Drift Criteria... 6 Load Combinations... 6 Wind Load Cases... 7 MATERIAL... 8 CONCRETE... 8 STRUCTURAL STEEL... 8 GRAVITY AND DESIGN LOADS... 9 DEAD LOADS... 9 LIVE LOADS... 9 SNOW LOADS LATERAL LOADS WIND LOADS SEISMIC LOADS EXISTING STRUCTURAL SYSTEM FOUNDATION FLOOR SYSTEM LATERAL SYSTEM LATERAL SYSTEM ANALYSIS Load Path Relative Stiffness Wind Drifts Seismic Drifts Torsion Overturning Moment CONCLUSION
3 APPENDIX A- EXISTING TYPICAL BAY AND DESIGN VALUES APPENDIX B-WIND LOADS APPENDIX C-SEISMIC LOADS APPENDIX D-OVERTURNING AND SPOT CHECKS 42 3
4 EXECUTIVE SUMMARY The Science Center Research Park is a 401,032 GSF mixed-use building and is approximately 144 feet tall. It currently has the largest green roof in the city of Philadelphia. The building includes offices, wet labs, retail space, and a 500 car parking garage. The structure is made up of steel construction, and composite deck. Lateral support is provided by steel braced frames using HSS steel shapes for cross-bracing. The ground floor is a reinforced slab on grade with grade beams, and drilled caissons that support the buildings columns. Technical report 3 is a report is an analysis of the existing lateral system of the Science Center Research Parks building. The purpose is to gain an understanding of how lateral loads are distributed, and to verify that a load path exists. This report uses current standards and the governing standards to analyze the existing Lateral system. It includes modeling using ETABS, and checks on strength, drifts and overturning moments. Topics covered in technical report 3, but not limited to: Gravity and Lateral Loads Load Paths Computer Analysis Drift Overturning Issues Lateral Spot Checks In conclusion, the controlling load combination was found to be: 1.2(Dead) + 1.6(Wind) + 1.0(Live) + 0.5(Roof Live) The controlling wind load case was found to be load case 1 which includes 100% of the North-South or East-West wind loads. Also, all the drifts do to lateral forces were found to be acceptable and were less than the limitations for wind and seismic drifts found in ASCE The overturning moments were found to be offset by the moment cause by the building self weight. The critical shear forces were used in ETABS to calculate the overturning moments for the building. All the member spot checks were found to be acceptable. Lateral member spot checks were done and it was found that the design of the members was acceptable. At the end of this report is an appendix that contains all the calculations for the loads stated above. 4
5 INTRODUCTION The Science Center Research Park is an addition to the growing research/science development in the University City area. The Science Center is the nation s preeminent destination for early-stage life science companies across the globe, said Pradip Banerjee. The building includes offices, wet labs, retail space, and a 500 car parking garage. It is covered by glass curtain wall, stone, and a brick veneer along the Market Street facade. analyzes the existing lateral system for the Science Center Research Park building in order to gain a better understanding of how wind and seismic loads are distributed. Conclusion will be made on the validity of structural members designed for the lateral system. CODE CODE / REFERENCES ASCE 7-05 Minimum Design Loads for Buildings and Other Structures IBC 2006 International Building Code ACI Building Code Requirements for Structural Concrete AISC 13 th Edition Steel Construction Manual Note: The following codes and references were used in the original design and in this report. All references are up-to-date building design standards. 5
6 DRIFT CRITERIA Allowable Building Drift = H/400 Inner-Story Drift Wind = h/400 to h/600 Seismic = 0.015h LOAD COMBINATIONS The following load combinations were used in the combination of factored gravity and lateral loads. These combinations were used for the 3D model analysis done using ETABS. The four different wind load cases stated below were also used when considering these load combinations (Dead) (Dead) + 1.6(Live) + 0.5(Roof Live) (Dead) + 1.6(Roof Live) + (1.0(Live) + 0.8(Wind)) (Dead) + 1.6(Wind) 1.0(Live) + 0.5(Roof Live) (Dead) + 1.0(Seismic) +1.6(Wind) (Dead) + 1.6(1.6(Wind) (Dead) +1.0(Seismic) 6
7 WIND LOAD CASES Case 1: 100 % of the wind forces in the north-south or east-west direction Case 2: 75 % of the north-south or east-west direction applied with torsion Case 3: 75 % of the north-south and east-west direction applied simultaneously Case 3: 56.3 % of the north-south and east-west direction applied simultaneously with torsion Note: The above criteria were taken from ASCE
8 MATERIAL CONCRETE Slabs on grade Slab on steel deck Drilled caissons Foundation walls, piers &grade beams Steel column encasement f c = 4000 psi f c = 4000 psi f c = 3000 psi f c = 4000 psi f c = 3000 psi STRUCTURAL STEEL W Shapes Bars, rods and plates All other structural shapes Pipes Cold-formed hollow structural sections (tubing) High strength bolts Deformed bar anchors Anchor rods ASTM A992 ASTM A36 (UNO) ASTM A36 ASTM A53, Grade B ASTM A500, Grade B ASTM A325 ASTM A706 Low Carbon ASTM A36 Shear connectors (headed) ASTM A108, Grade 1010 to
9 GRAVITY AND DESIGN LOADS DEAD LOADS Concrete Light Weight Concrete Partitions M.E.P. Finishes and Misc. Roof Deck Rigid Insulation 150 pcf 115 pcf 20 psf 5 psf 3 psf 2.6 psf 4 psf LIVE LOADS Corridors, Lobbies & Exits Labs / Offices Garage Mechanical Equip. Rooms Roof 100 psf 100 psf 40 psf 150 psf 30 psf Note: The above loads were used in the original design and in this report. 9
10 SNOW LOADS Snow load were calculated to determine whether the roof design is sufficient to carry the applied snow load. Table 1 contains all the design values required to calculate the flat roof snow load. When the applied snow load was compared to the existing designed snow load it was noticeable that designers had used a larger value. All the design criteria is the same used by the designers, but the designers used a more conservative value for the snow load. Snow drift was not calculated, but it vary depending on the different roof levels of the building. Flat Roof p g 30 psf c e 1.0 (Terrain Category B) c t 1 I 1.0 (Category II) p f 21 psf using pf = 0.7c e c t Ip g (Eq. 7-1) TABLE 1 Snow load design criteria 10
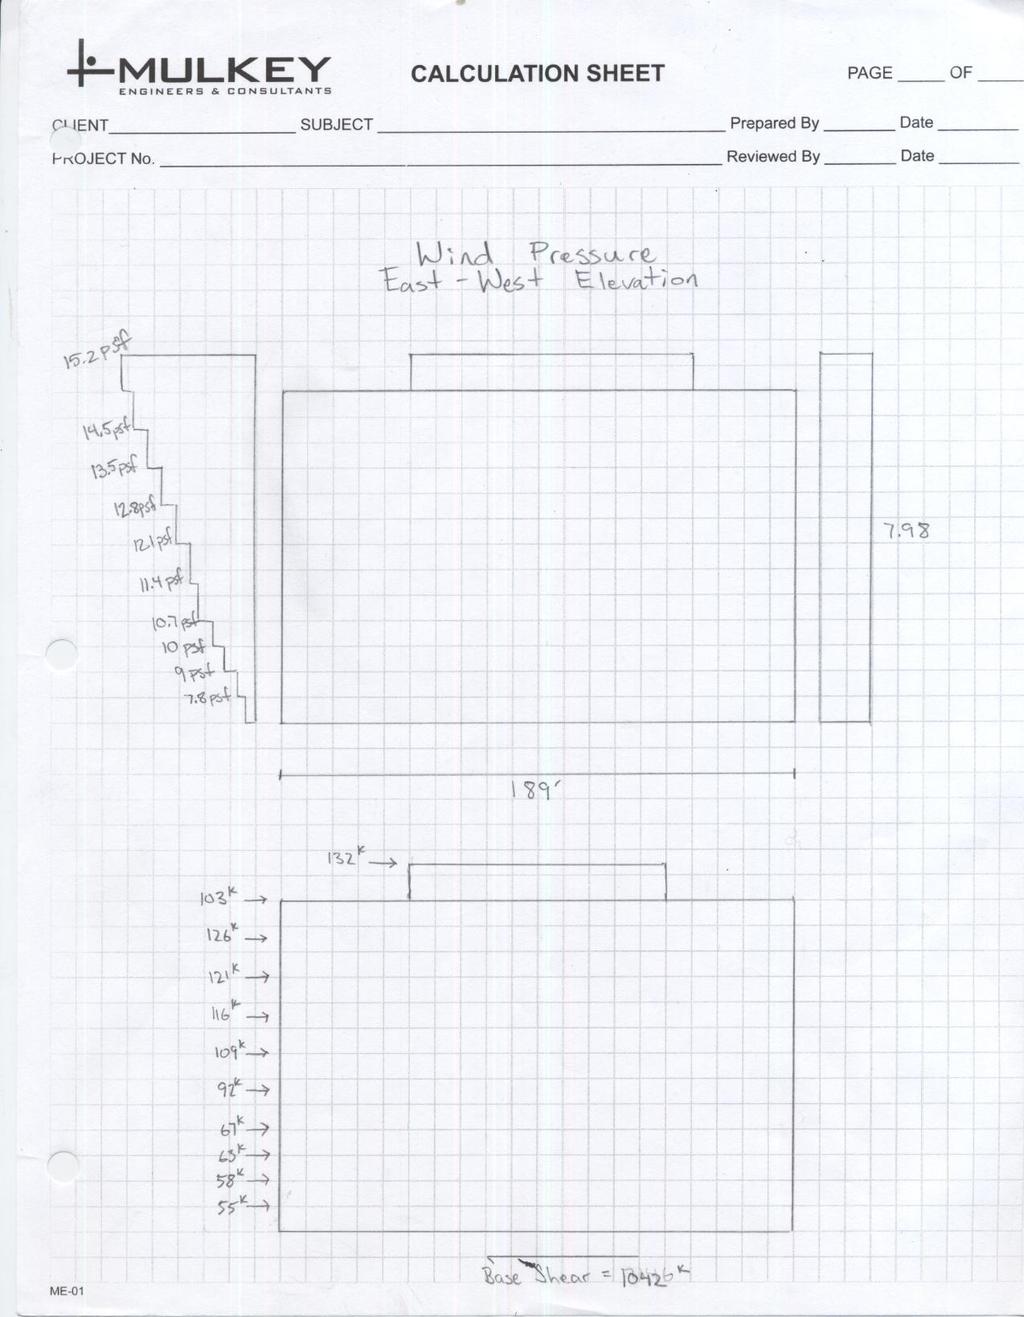
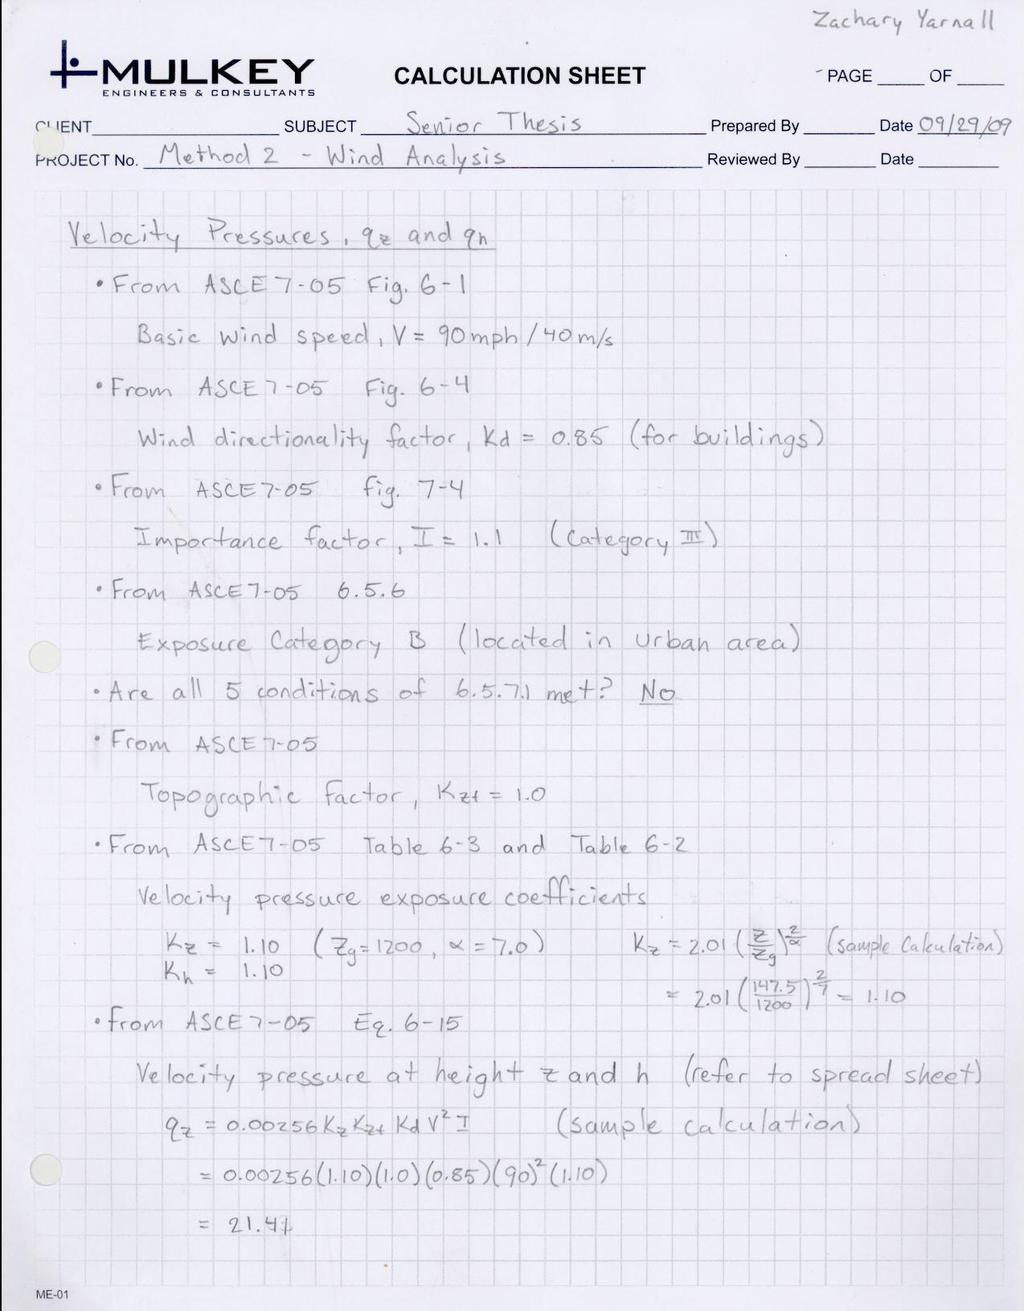
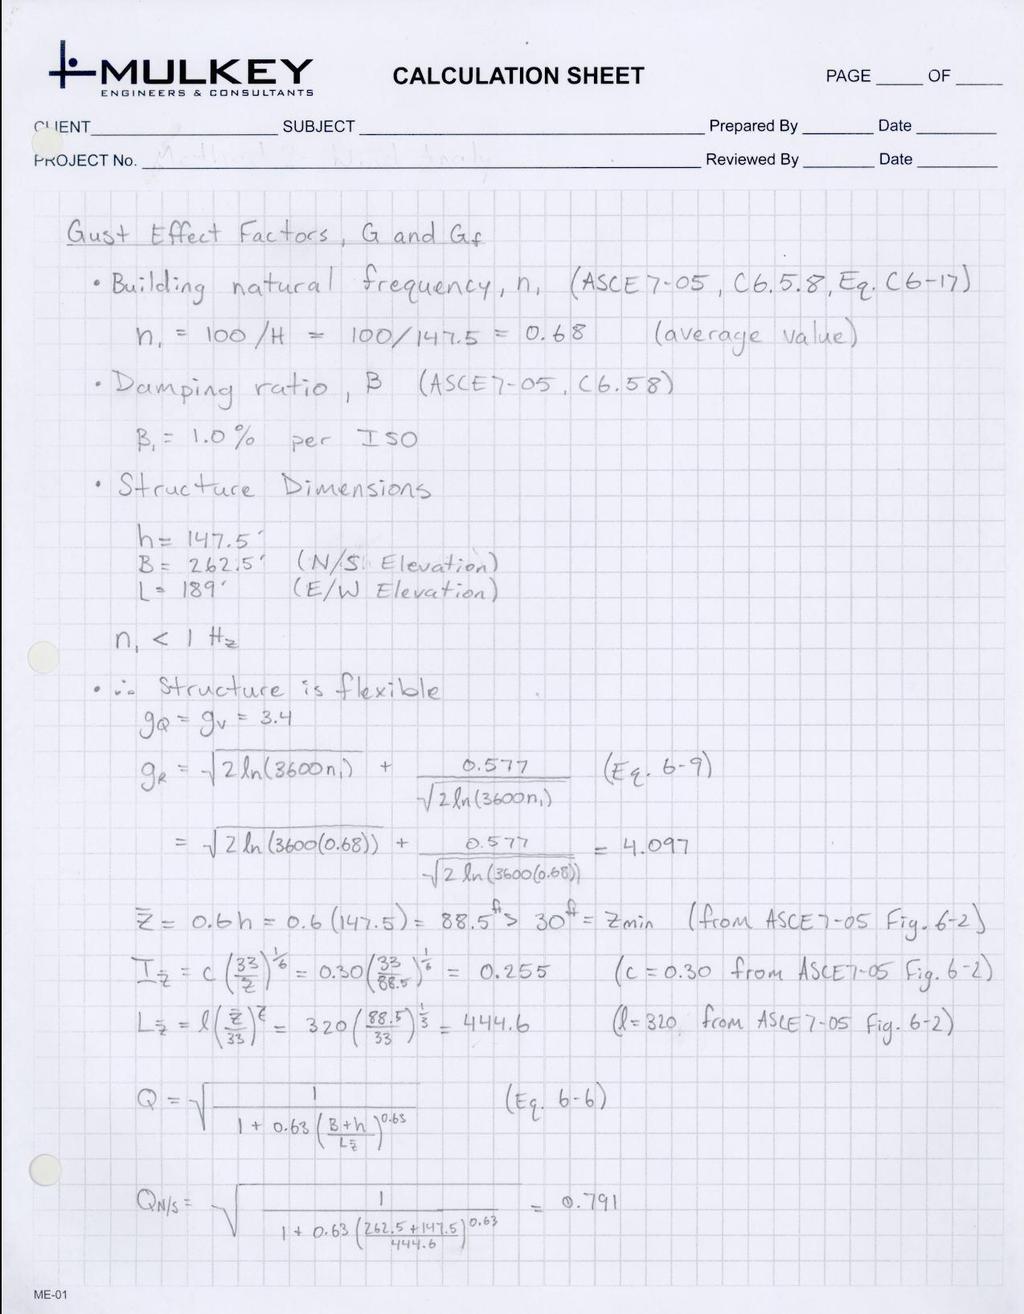
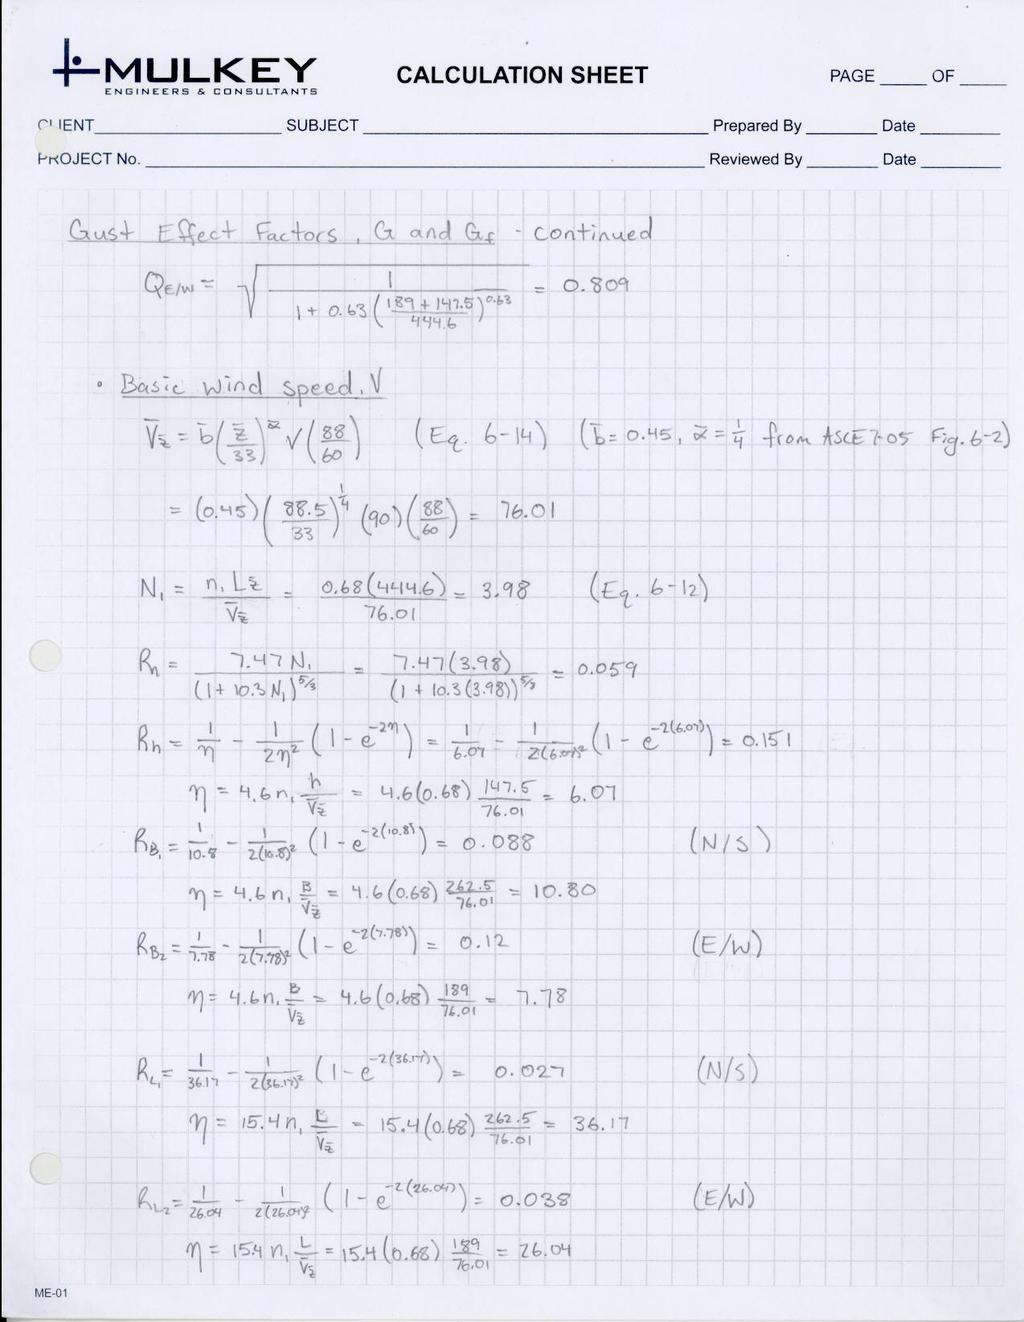
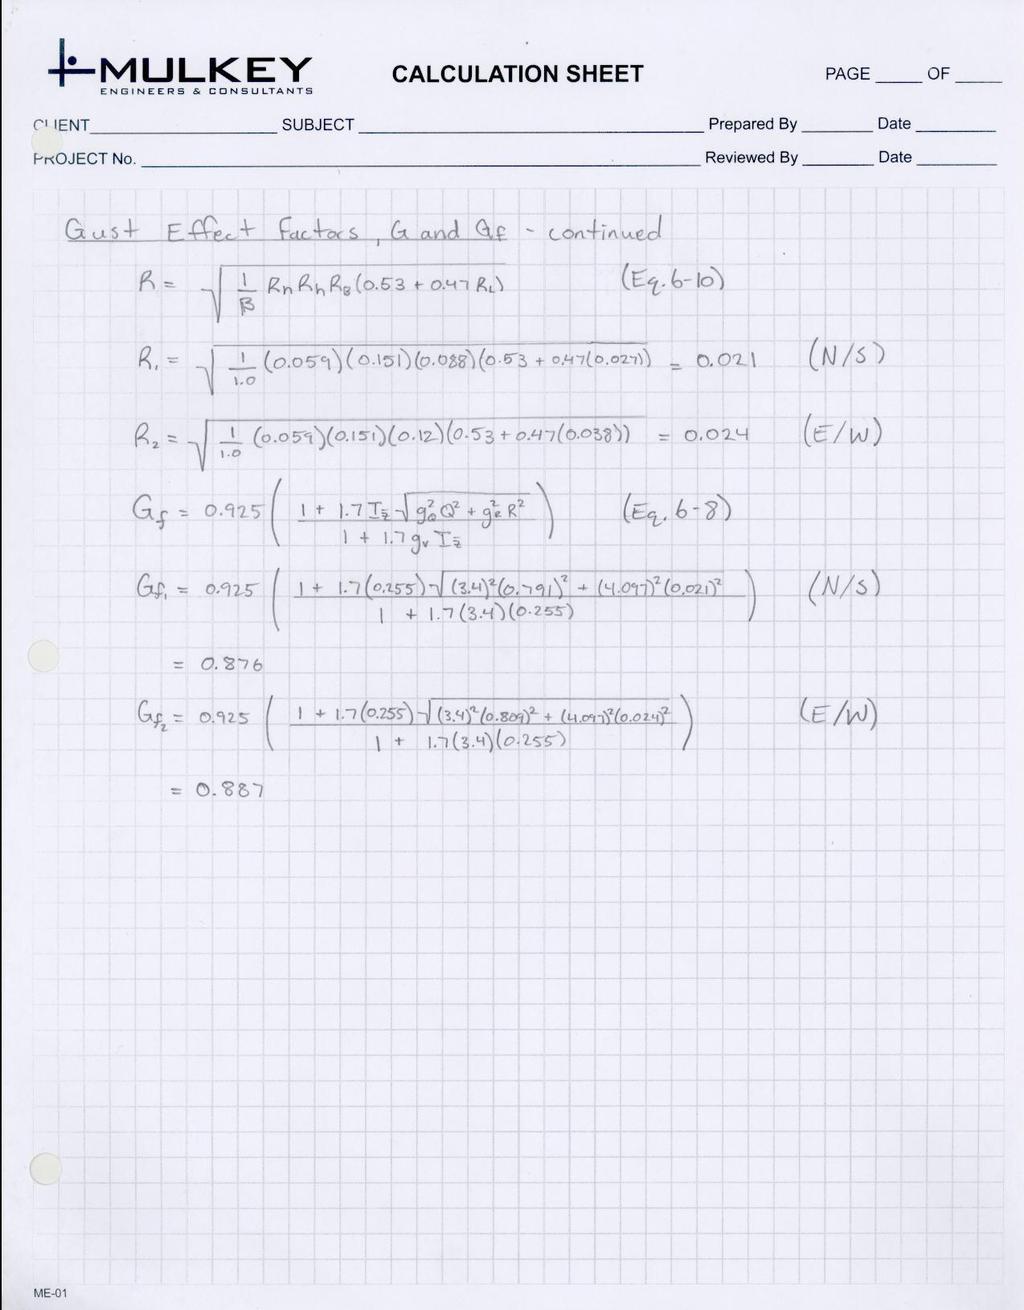
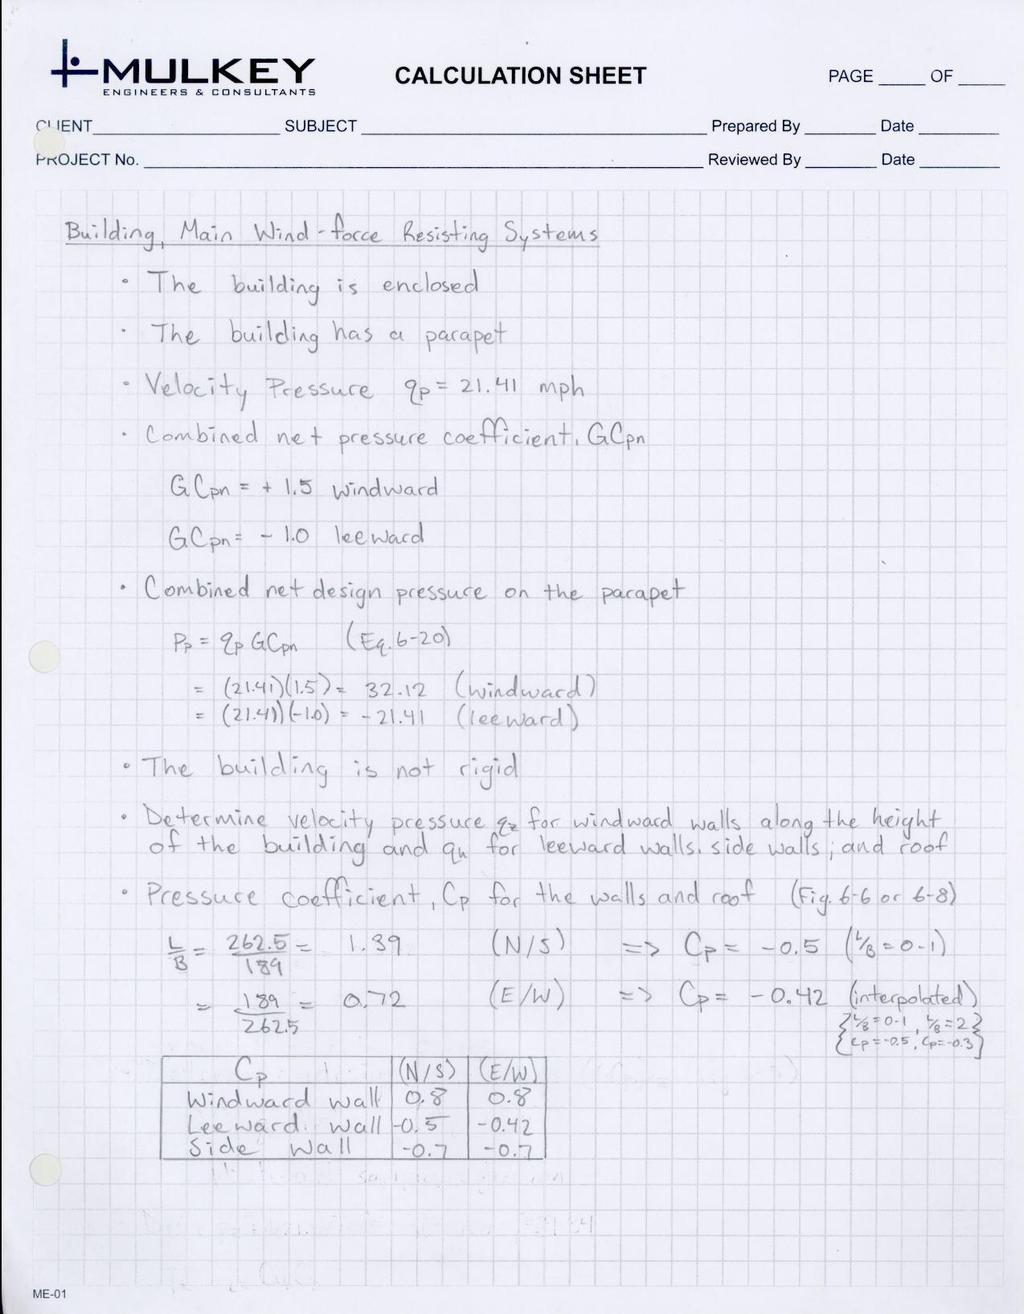
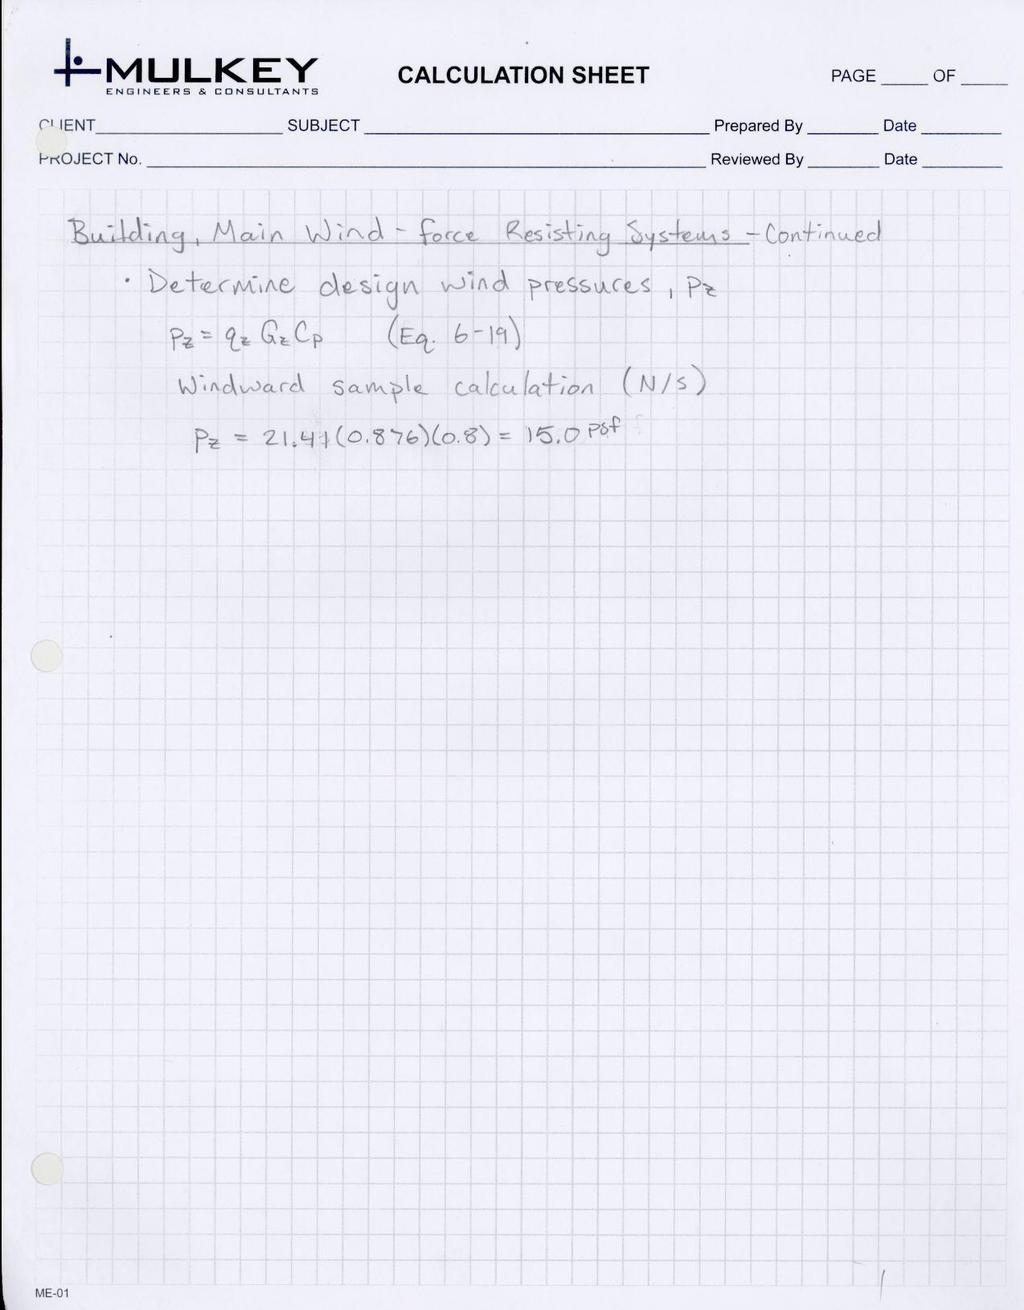
11 LATERAL LOADS WIND LOADS Wind loads were determined using ASCE 7-05 Section 6.5 which describes Method 2. The detailed analysis of the wind loads can be found in appendix B. Below are tables including wind factors and wind loads calculated for north-south and east-west elevations. Level Height Above Ground (ft) Kz qz Wind Pressures N-S (psf) E-W (psf) windward Pent House Roof Level T.O. Parapet Leeward All TABLE 2 Wind Pressure at each level 11
12 Level Height Above Ground (ft) Floor Height (ft) Pent House TABLE 3 Wind Loads: Shear and Moment at each level h/2 above h/2 below Wind Forces Load (kips) Shear (kips) N-S E-W N-S E-W Roof Level T.O. Parapet Total
13 13
14 14
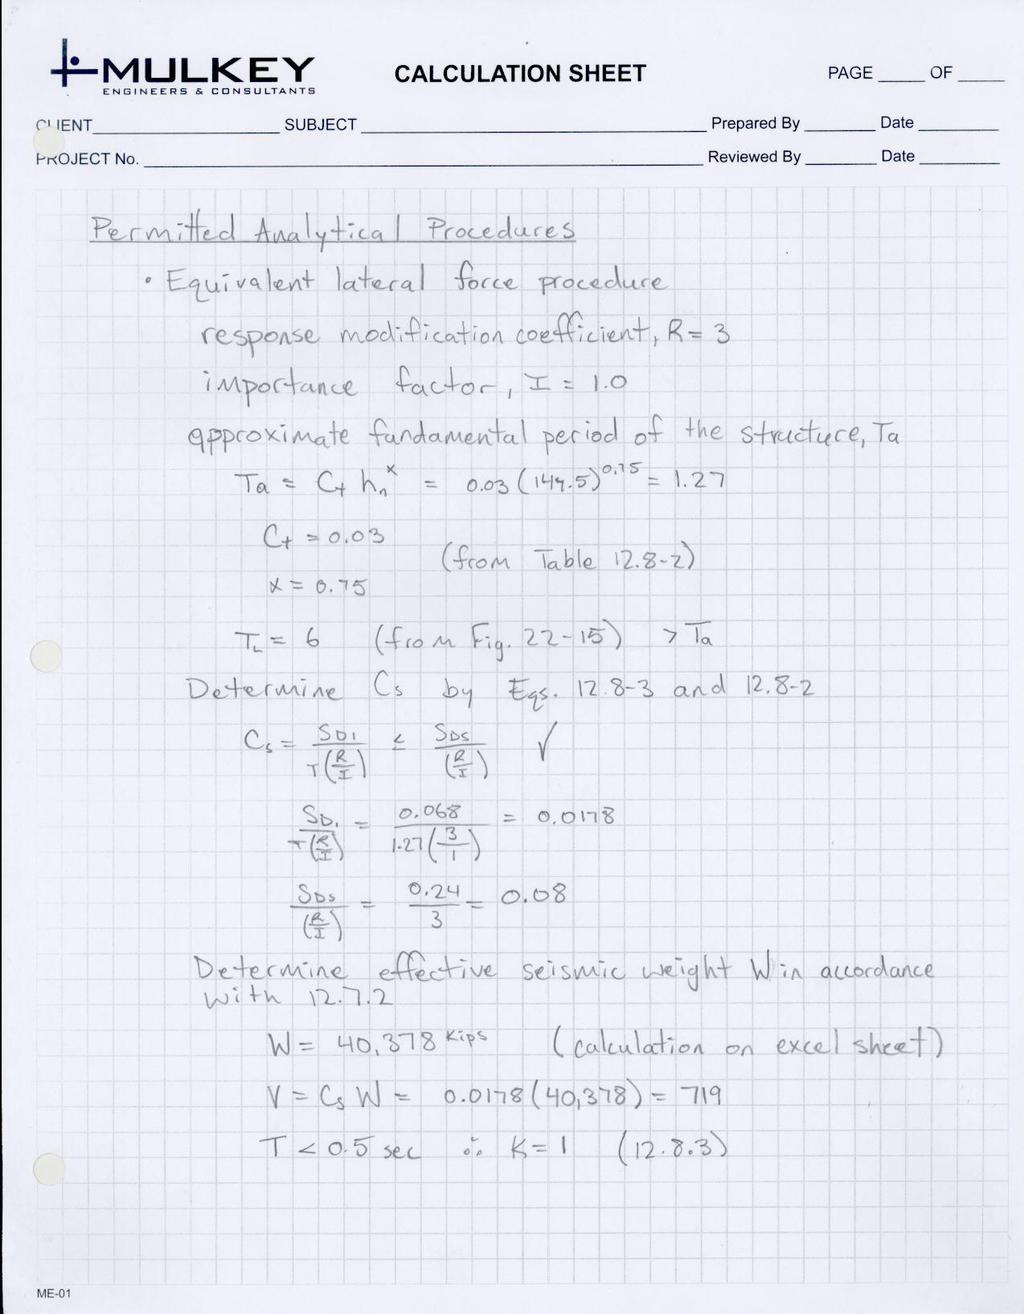
15 SEISMIC LOADS Seismic loads were determined using ASCE 7-05 chapters 11 and 12. The detailed analysis of the seismic loads can be found in appendix C. Building weight was calculated for each floor of the typical steel constructed building. The building weight includes the dead loads that are listed in the tables below. Floor Floor Area (ft 2 ) Approx. Floor Dead Load (t slab *150 pcf) Floor Weight (lbs) h/2 above (ft) h/2 below (ft) Column weight/length total (plf) Column weight= height* weight/length (lbs) Ground st 33, nd 50, rd 50, th 50, th 40, th 34, th 34, th 30, th 30, Pent house 6, Roof pent house level 21, Roof 6, Total TABLE 4 Building Weight Tabulation 15
16 Floor Approx. Beam weight (lbs) Curtainwall (estimated length along perimeter) (ft) Curtainwall height (ft) Curtainwall weight (height*length* 15 psf) Braced frame weight (lbs) Ground 1st nd rd th th th th th th Pent house Roof pent house level Roof Total Total Building Weight kips TABLE 4 Building Weight Tabulation (continued) 16
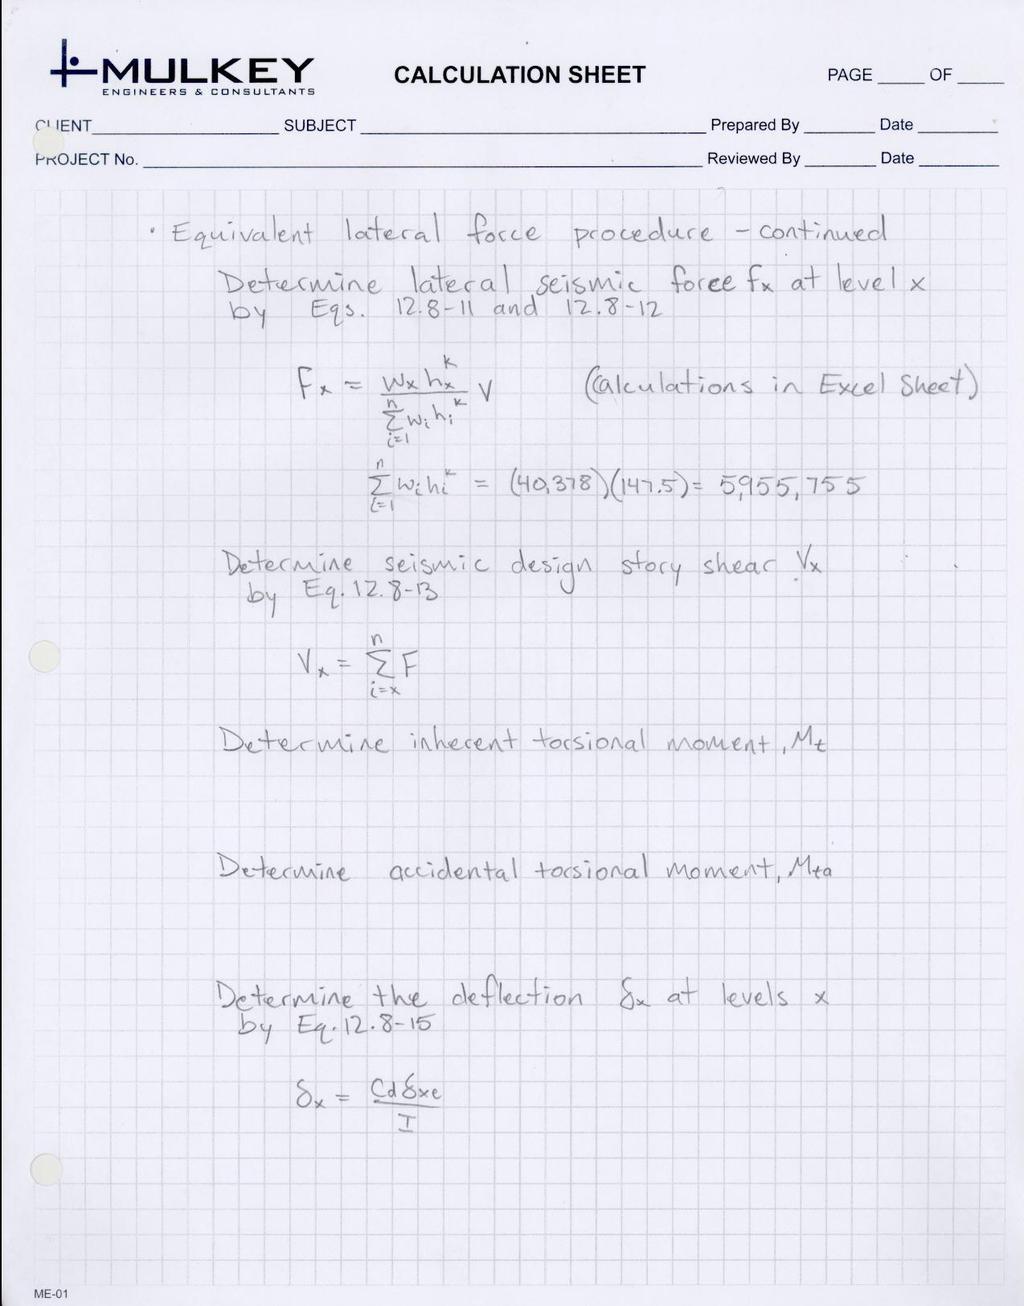
17 Building forces including story and base shears were calculated after the tabulation of building weights. These forces are shown below in table 5. Level Story Weight w x (Kips) Height h x (ft) w x h x k Lateral Force F x (Kips) Story Shear V x (Kips) Moment M x (ft-k) 1st nd rd th th th th th th Penthouse Roof penthouse level Roof Total 1892 TABLE 5 Seismic Load Tabulation 17
18 EXISTING STRUCTURAL SYSTEM FOUNDATION The foundation system is composed of cast-in-place reinforce concrete grade beams and piers. The deep foundation consists of drilled caissons that range from 3 to 5 feet in diameter, and 20 to 30 feet below grade. These caissons can carry loads up to 1900 kips depending on the size. The general thickness of the slab on grade is either 4 or 6inches depending on indication on plans, but is also 12 inches thick in some areas. The columns are also cast-in-place in some areas of the ground floor, but transfer to steel columns. All the concrete in the building has a compressive strength of 4000 psi; except for the caissons and steel column encasements have a compressive strength of 3000 psi. FLOOR SYSTEM The floor system is a composite steel slab system on steel beams with a typical bay size of 31 6 x The typical composite deck is composed of 6 inches of normal weight concrete and gauge composite steel decking with ¾ studs. The floor is supported typically by W 18 x 40 beams and W 24 x 84 girders, but there are large amount of other W - shapes used. The roof consists of gauge steel roof deck supported typically by W 16 x 26 beams and W 24 x 55 girders. Refer to typical bay layout and overall plan such as shown on page 20. LATERAL SYSTEM The lateral system is composed of braced frames strategically placed on each floor. The braced frame can be located in the walls of the main elevator and stairwell core in the center of the building, in some exterior walls, and in the exterior walls of the penthouse. The braces are hollow structural steel members. Typical brace members are HSS 8 x 8 s and HSS 6 x 6 s were used, but several different sizes were used. The shear at the end of the beams is typically 10 kips, unless indicated otherwise on the plans. Also, column splices transmit compression forces in end bearing with a minimum of 15 kips of shear. Two bays of the braced frames in the center core connect into the buildings foundation transfer the shear load. Refer to typical braced frame layout shown on page


19 LATERAL SYSTEM ANALYSIS Graphic of ETABS Model A computer model of the Science Center Research Park building was used to analyze the existing lateral system and the loads applied. An ETABS model was created including only the lateral elements and diaphragms. The reason is simplicity and the reductions of possible errors. The seismic loads were applied to the center of pressure. The ETABS model was used to calculate relative stiffness, wind and seismic drifts, the center of mass and rigidity, and overturning moments. The lateral loads were assumed to be transferred through the diaphragms into the lateral frames, and down to the base of the building. 19 Graphic above: Lateral System Layout

20 LOAD PATH The lateral loads were assumed to be transferred through the diaphragms into the lateral frames, and down to the base of the building where the load is absorbed by the soils. Lateral Loads in the Y-direction (North-South) Lateral Loads in the X-directions (East-West) 20
21 RELATIVE STIFFNESS The relative stiffness for each frame per floor was tabulated using the ETABS model. A 1000 kip force was applied to the center of mass at the top level of the building. In order to calculate the relative stiffness in each frame, section cuts were made using the ETABS model to determine the shear forces. The tables below include the shear forces and tabulation of relative stiffness. It was confirmed that the total of the shear forces at each level roughly equal the story shear of 1000 kips. The relative stiffness was determined by taking the percentage of the 1000 kips that was resisted by the frame examined. 11th Story 10th Story Grid X Force % X Grid Y Force % Y Grid X Force % X Grid Y Force % Y F F A A Total Total th Story 8th Story Grid X Force % X Grid Y Force % Y Grid X Force % X Grid Y Force % Y F F A A Total Total th Story 6th Story Grid X Force % X Grid Y Force % Y Grid X Force % X Grid Y Force % Y F F A A Total Total th Story 4th Story Grid X Force % X Grid Y Force % Y Grid X Force % X Grid Y Force % Y F F A A Total Total
22 3th Story 2th Story Grid X Force % X Grid Y Force % Y Grid X Force % X Grid Y Force % Y F F A A Total Total ST Story Grid X Force % X Grid Y Force % Y F A Total Figures 6 16: Relative Stiffness for frames resisting 1000 kips in the X and Y directions Below is the output from ETABS for the center of mass and the center of rigidity for each level of the building. The coordinates do not change much due to the fact the building does not change radically in shape by level, and the upper stories are located in the center of the building. Center of Mass Center of Rigidity Story XCM (ft) YCM (ft) Story XCR (ft) YCR (ft) STORY STORY STORY STORY STORY STORY STORY STORY STORY STORY STORY STORY STORY STORY STORY STORY STORY STORY STORY STORY STORY STORY Figures 17 & 18: Center of mass and Center of Rigidity 22
23 Story B x (in.) e x (in.) B y (in.) e y (in.) CASE 2 NORTH-SOUTH POS e CASE 2 NORTH-SOUTH NEG e Story F x Fy xccor yccor Story F x Fy xccor yccor CASE 2 EAST-WEST POS e Story F x Fy xccor yccor Story F x Fy xccor yccor Figures 19 23: the effective coordinates for wind case 2 CASE 2 EAST-WEST NEG e 23
24 Story B x (in.) e x (in.) B y (in.) e y (in.) CASE 4 NORTH-SOUTH e x pos e y pos CASE 4 NORTH-SOUTH e x neg e y neg Story F x Fy xccor yccor Story F x Fy xccor yccor CASE 4 EAST-WEST e x pos e y neg Story F x Fy xccor yccor Story F x Fy xccor yccor Figures 24 28: the effective coordinates for wind case 4 CASE 4 EAST-WEST e x neg e y pos 24
25 WIND DRIFTS Wind loads determined in technical report 1 were used in the ETABS model to determine the story drifts. The load case that controlled for wind was load case 1. This load case is 100% of the wind load is applied in the North-South or East-West direction. The controlling load combination for story drift in both directions was load combination 4: 1.2(Dead) + 1.6(Wind) + 1.0(Live) + 0.5(Roof Live) The story and total drifts were checked with accordance to ASCE 7-05 to determine whether or not the deflections were acceptable. The drift limit using the story height can be calculated using this equation: wind = H/400 (from ASCE 7-05) Torsion was taken into account when adjusting the coordinates to the eccentricity found when looking at wind load cases 2 and 4. The results for wind drift in the X and Y- directions were tabulated after running the ETABS model for unfactored wind loads. Below are the wind drifts which all checked out to be acceptable when compared to the drift limitation. 25
26 Controlling Wind Drift: North-South Direction Story Story Height (ft) Story Drift (in) Allowable Story Drift wind = H/400 (in) Total Drift (in) Allowable Total Drift wind = H/400 (in) acceptable acceptable acceptable acceptable acceptable acceptable acceptable acceptable acceptable acceptable acceptable acceptable acceptable acceptable acceptable acceptable acceptable acceptable acceptable acceptable acceptable acceptable Controlling Wind Drift: East-West Direction Story Story Height (ft) Story Drift (in) Allowable Story Drift wind = H/400 (in) Total Drift (in) Allowable Total Drift wind = H/400 (in) acceptable acceptable acceptable acceptable acceptable acceptable acceptable acceptable acceptable acceptable acceptable acceptable acceptable acceptable acceptable acceptable acceptable acceptable acceptable acceptable acceptable acceptable Figures 20 & 30: Allowable wind drifts in the North-South and East-West Directions 26
27 SEISMIC DRIFTS Seismic loads determined in technical report 1 were used in the ETABS model to determine the story drifts. Seismic drift protects against building failure/collapse unlike wind drift which is a serviceability requirement. The drift limitation for seismic drift can be calculated using this equation: seismic = 0.015hsx (from ASCE 7-05) Below are the seismic drifts which all checked out to be acceptable when compared to the drift limitation. 27
28 Controlling Seismic Drift: North-South Direction Story Story Height (ft) Story Drift (in) Allowable Story Drift wind = H/400 (in) Total Drift (in) Allowable Total Drift wind = H/400 (in) acceptable acceptable acceptable acceptable acceptable acceptable acceptable acceptable acceptable acceptable acceptable acceptable acceptable acceptable acceptable acceptable acceptable acceptable acceptable acceptable acceptable acceptable Controlling Seismic Drift: East-West Direction Story Story Height (ft) Story Drift (in) Allowable Story Drift wind = H/400 (in) Total Drift (in) Allowable Total Drift wind = H/400 (in) acceptable acceptable acceptable acceptable acceptable acceptable acceptable acceptable acceptable acceptable acceptable acceptable acceptable acceptable acceptable acceptable acceptable acceptable acceptable acceptable acceptable acceptable Figures 31 & 32: Allowable seismic drifts in the North-South and East-West Directions 28
29 TORSION Torsion for the building can result from a difference in the center of mass and the center of rigidity. The difference between the points is an eccentricity that the loads are applied at. The eccentricity multiplied by the force results in a moment on the building. As stated before the wind load cases 2 and 4 include eccentricities on the wind loads that create torsion on the building. The eccentricity for both these cases is 15 percent of the building s width. ASCE 7-05 describes torsion that is produced by accidental eccentricities for seismic loads. OVERTURNING MOMENT Overturning happens the moment created by the building s self weight does not offset lateral forces on the building. If the building s self weight does not compensate for the moment, the foundation can be designed to counteract the overturning moment. In the design of the foundation, friction from the soil can used to assist the foundation counteract the overturning moment. Below are the overturning moments determined using the ETABS model. Critical story shears applied at the center of mass at each level were used to tabulate the moments at each level, and the moments were totaled to determine the building s overturning moment. Seismic Overturning Moment Story Height Story Overturning Shear (k) Moment (k-ft) Total Moment: Figure 33: Seismic Overturning Moment 29
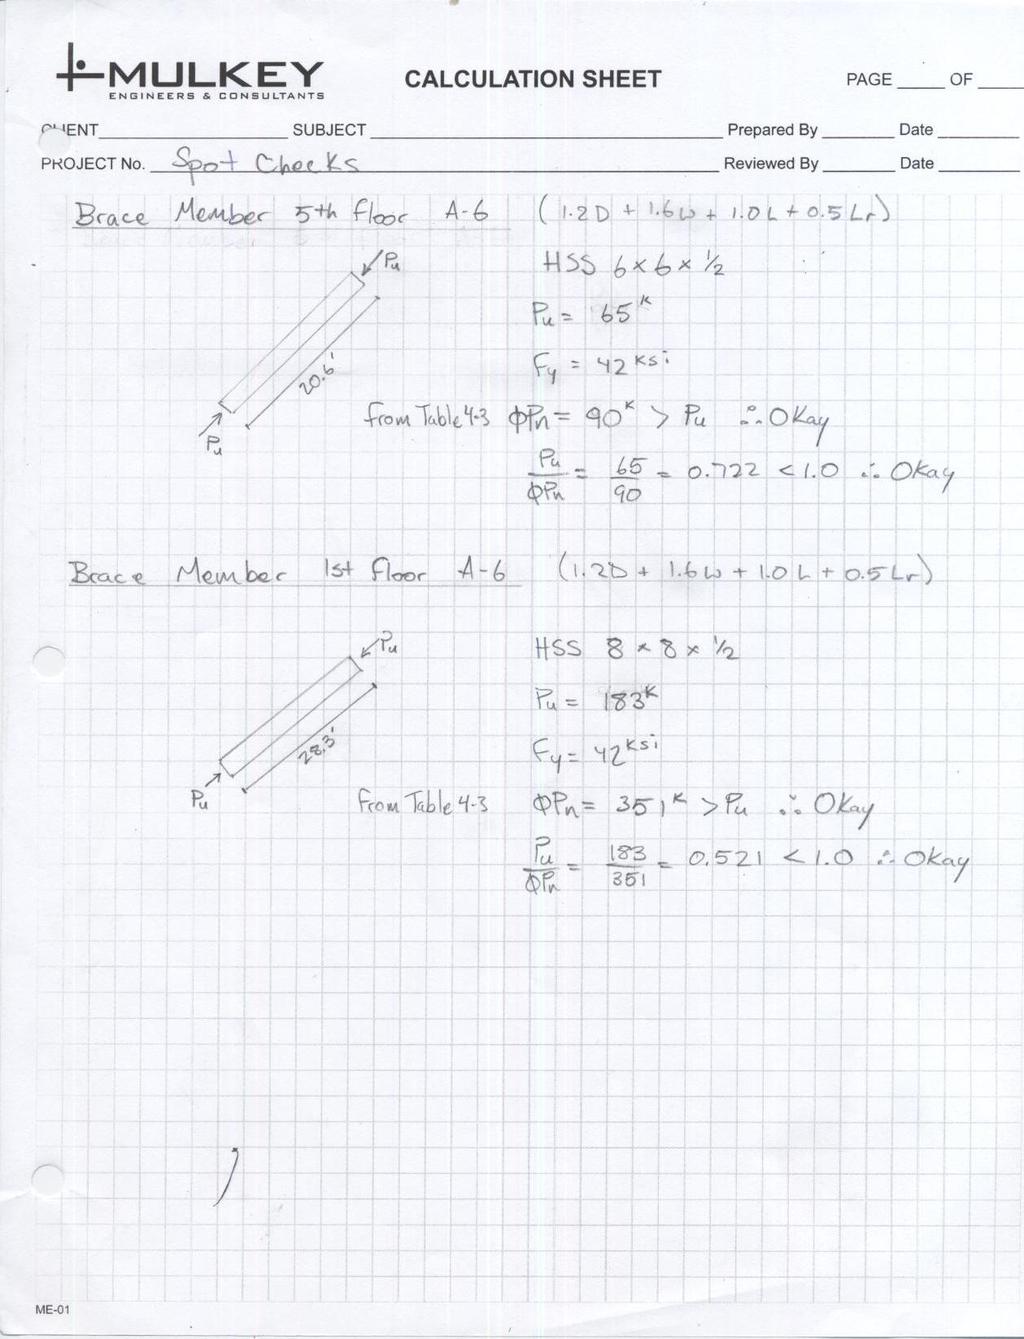
30 Wind Overturning Moment (X / N-S) Story Height Story Shear (k) Overturning Moment (k-ft) Total Moment: Wind Overturning Moment (Y / E-W) Story Height Story Shear (k) Overturning Moment (k-ft) Total Moment: Figures 34 & 35: Wind Overturning Moment in N-S & E-W Directions In result of the calculation of the moment resulting from the building s self weight it is found that there will be no uplift in the foundation. The building self weight compensates for the overturning moment caused by lateral forces. The calculations for dead load moments can be found in Appendix D. Also, spot checks were done on two lateral braces located at the intersection of grid line A and 6. Both members were found to be an acceptable design. 30
31 CONCLUSION The lateral forces including wind and seismic loads were calculated in technical report 1 and used in this report for the analysis of the lateral system. The controlling load combination was found to be: 1.2(Dead) + 1.6(Wind) + 1.0(Live) + 0.5(Roof Live) The calculation of drifts included the unfactored wind loads for case 1 and the unfactored seismic loads. The controlling load combination was also used in the member spot checks. All the drift values were found to be less than the drift limitations stated in ASCE 7-05, which makes the drift displacements acceptable. The drift limitations used are: wind = H/400 and seismic = 0.015hsx The overturning moment was found not to cause any uplift in the foundation. The self weight of the building compensates for the overturning moment cause by lateral forces. Member spot checks were perform on two HSS steel shape braces and two W14 steel shape columns where grid lines A and 6 intersect, and on the first and 5 th floors. The design of the members was found to hold the controlling load combination, which means the design is acceptable. 31

32 APPENDIX A- EXISTING TYPICAL BAY AND DESIGN VALUES Existing Typical Bay (6th Floor) 32
33 Typical Column Schedule 33
34 Braced Frame Schedule 34
35 APPENDIX B-WIND LOADS 35
36 36
37 37
38 38
39 39
40 40
41 41
42 42

43 APPENDIX C-SEISMIC LOADS 43
44 44
45 45
46 APPENDIX D-OVERTURNING AND SPOT CHECKS 46
47 47
48 48