Bridge Evaluation Based on Health Monitoring Data
|
|
|
- Neil Harrell
- 5 years ago
- Views:
Transcription


1 Bridge Evaluation Based on Health Monitoring Data Dana Feng, Ph.D., P.E. Assistant Bridge Design Engineer Administrator


2 INTRODUCTION US 35 Silver Bridge collapse 1967 I-35W Minneapolis Bridge Collapse 2007 FHWA NBIS: 1971 (Bridge inspection and load rating) 2
3 LOAD RATING/DESIGN HISTORY Design Truck Rating Truck Factors Method ASD (1931) H10, H15 ASR H15, 3S2 Single factor Deterministic LFD (1970) HS20 LFR HS20, AASHTO 3, 3S2, 3-3 Different Load factors Deterministic LRFD (1994) HL-93 LRFR (2007) HL-93, AASHTO 3, 3S2, 3-3, SHV Different Load and resistant factors Probabilistic Reliability Index (β) HL-93 = HS20-44 or Tandem klf land load 3
4 LOAD RATING Safe load capacity of a bridge for 5 years Rating Factor RF = φ c φ s φr n γ DC D C1 +D C2 γ DW D W γ LL L L = Ulimate Live load Capacity Ultimate live load effect Bridge rating factor varies with time Accurate Site-specific Deterioration, accident, traffic Remove uncertainties in bridge design 4
5 LITERATURE REVIEW AND INTRODUCTION TO RELIABILITY ASSESSMENT G(R, S) = Resistance load effect = R S P f = P R < S = න P R < S f s ds β = µ g σ g =-Φ 1 (P f ) Limit State function or safety margin Probability of failure Probability distribution of R, S =DL + LL + Misc Normal distribution 5
6 LOAD RATING METHODS Level I: Approximate method for live load distribution analysis Simple; Limited to common bridge types and HS family of trucks; Conservative for most bridges Level II: Finite Element Model increase the live load distribution factor accuracy Level III: Non-destructive Test actual response of an existing structure accounting for design details, construction deviation, deterioration, damage, repair, and current environmental and operational condition Limitation for current load rating methods: Predefined live loads, which were developed from the limited traffic data, may not represent the site-specific live load condition Level IV: Reliability based load rating Site-specific traffic from weight-in-motion system (WIM) Site-specific bridge response from structural health monitoring system (SHM) Reliability analysis 6


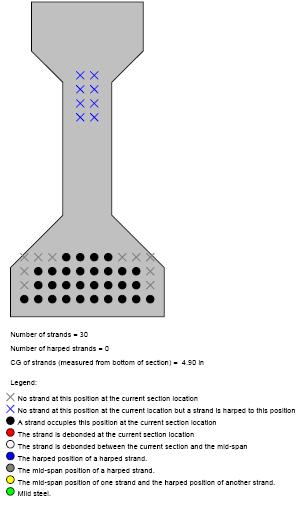
7 CASE STUDY Location: St. Charles Parish, US61 Bridge type: cast-in-place concrete deck prestress-precast concrete girders concrete pile cap pre-stressed concrete piles Built: 1984 Length: 6,006 ft 7
8 AS-DESIGNED RATING (LEVEL I) 8
9 AS-DESIGNED RATING (I) Live Loads Limit States Dead Load Inventory Design Loads Operating Legal Loads Routine Permit Loads Strength Service N/A N/A N/A Live Load Level Rating Factor (RF) Controls HL-93 Inventory 1.34 Service HL-93 Inventory 1.42 Shear HL-93 Inventory 1.96 Flexure Legal Legal 3.14 Flexure Permit Routine 3.11 Flexure 9
 f cr = 0.9f c + 2.33S s (ACI 5-3) Live Load Level Rating Factor (RF) As-designed Rating Factor (RF) As-built Controls HL-93 Inventory 1.34 1.")
10 AS-BUILT RATING (I)-CONCRETE STRENGTH Concrete Strength 240 girder concrete cylinders were tested Design f`c =5.0 ksi; Tested (28 days): mean f`c=6.85 ksi, σ f`c =0.45 ksi=s s ; f`c=6.25 ksi selected f cr = f c S s (ACI 5-1) f cr = 0.9f c S s (ACI 5-3) Live Load Level Rating Factor (RF) As-designed Rating Factor (RF) As-built Controls HL-93 Inventory Service HL-93 Inventory Shear HL-93 Inventory Flexure Legal Legal Flexure Permit Routine Flexure 10


11 FINITE ELEMENT METHOD (LEVEL II) Methods Moment Shear Distribution Factor Finite Element Single lane Multi- Lane Single lane Multi- Lane
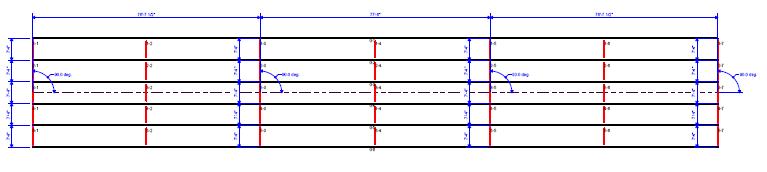
12 RATING BASED ON NDT (LEVEL III) Instrumentation plan: BDI 64 channel dynamic monitoring system: 64 Sensors: 48 extended length strain gauges, 12 LVDT displacement sensors, 4 inclinometers 12


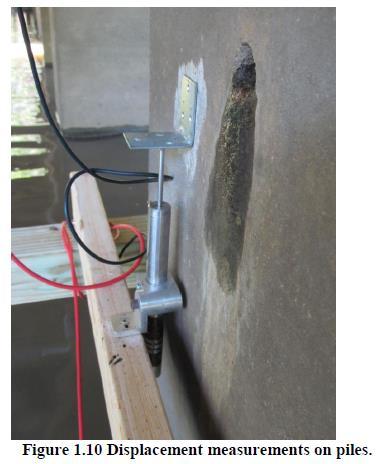
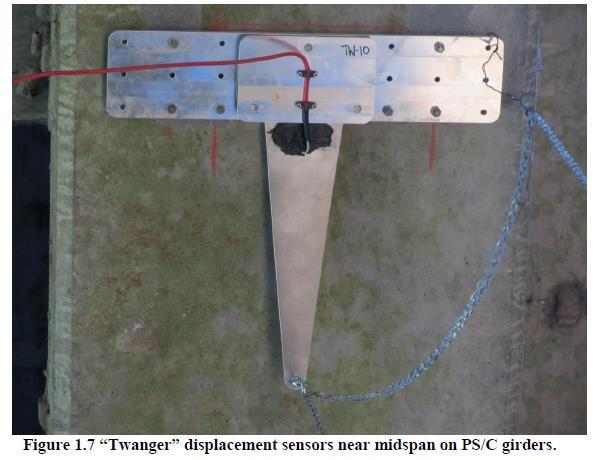
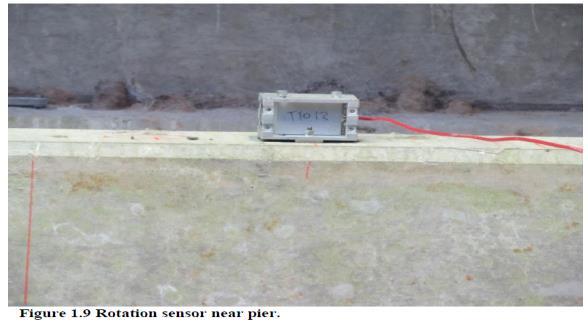
13 extended strain gage, displacement sensor, tilt meter, LVDT 13
14 MODEL COMPARISON E percent = σ ε m ε c 2 σ ε m 2 % E scale = σ max ε m ε c gage σ max ε m gage E correlation = σ ε m ε m ε c ഥε c σ(ε m ε m ) 2 (ε c ε c ) 2 14

 Spc_2-3 4.4 Axle spacing 2-3 (ft) Spc_3-4 28.1 Axle spacing 3-4 (ft) Spc_4-5 4.")
 Wt_1 9100 Axle weight axle 1 (lbs) Wt_2 19600 Axle weight axle 2 (lbs) Wt_3 18700 Axle weight axle 3 (lbs) Wt_4 19300 Axle weight axle 4 (lbs) Wt_5")
15 WIM BASED RATING (LEVEL IV) IRD piezoelectric WIM Two lanes, Two loops 11/17/2013 Description Timestamp 5:50:34.47 AM Record Record number Travel Lane: 4 driving lane, 3- passing lane Lane Number 4 Month 11 Day 17 Year 13 Hour 5 Minute 48 Second 37 HunSec 47 VehNum Vehicle Number Number Of Axles 5 Class 9 FHWA truck class Gross Weight GVW in pounds Length 60.1 Total length (ft) Speed 55.9 Speed in mph Spc_ Axle spacing 1-2 (ft) Spc_ Axle spacing 2-3 (ft) Spc_ Axle spacing 3-4 (ft) Spc_ Axle spacing 4-5 (ft) Spc_5-6 0 Axle spacing 5-6 (ft) Spc_6-7 0 Axle spacing 6-7 (ft) Spc_7-8 0 Axle spacing 7-8 (ft) Spc_8-9 0 Axle spacing 8-9 (ft) Spc_total 50.4 Total spacing (ft) Wt_ Axle weight axle 1 (lbs) Wt_ Axle weight axle 2 (lbs) Wt_ Axle weight axle 3 (lbs) Wt_ Axle weight axle 4 (lbs) Wt_ Axle weight axle 5 (lbs) Wt_6 0 Axle weight axle 6 (lbs) Wt_7 0 Axle weight axle 15 7 (lbs) Wt_8 0 Axle weight axle 8 (lbs) Wt_9 0 Axle weight axle 9 (lbs)

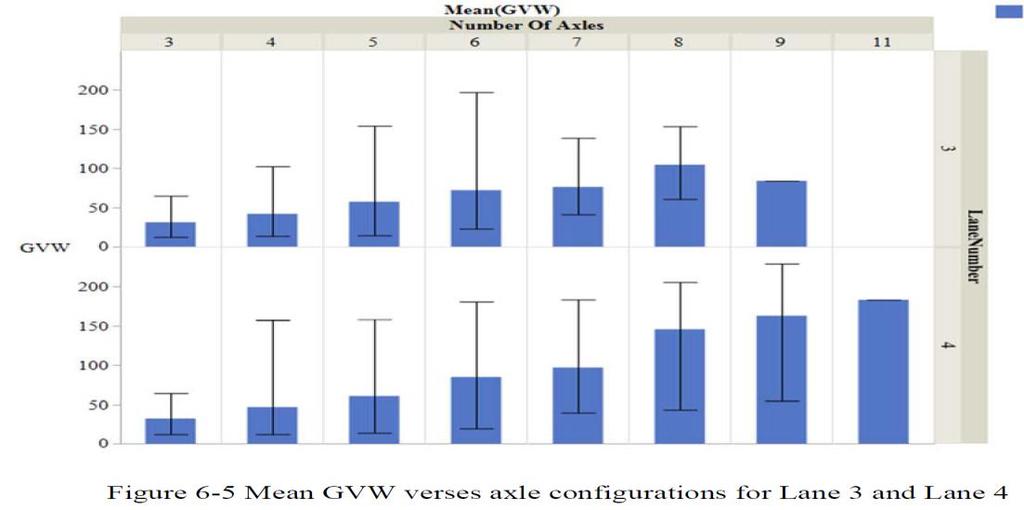
16 TRAFFIC PATTERN 16
17 TRAFFIC SEASONAL VARIATION (HOURLY) 17

 18")

18 LEGAL TRUCKS (<100 kip) 18


, 1.")
19 MULTIPLE-PRESENCE staggered side-by-side following N Mean Std Dev Min Max CV Legal and permit loads MP=0.23% < 6.67% (AASHTO), 1.5% (NCHRP 12-76) 19
20 MAXIMUM PROJECTED LEGAL WEIGHTS WIM_recorded 5 years 20 years 75 years One Lane Lane Lane Two Lane Average


21 MAXIMUM PROJECTED PERMIT TRUCK 21
22 SITE-SPECIFIC TRUCK LOAD RATING (LEVEL I) Legal Load Permit Load Truck Type Number of Axles RF-Flexure RF-Shear Site-Specific Site-Specific Site-Specific Site-Specific LA Legal Site-Specific Site-Specific Site-Specific Site-Specific Site-Specific Site-Specific Site-Specific LA Permit
23 SHM BASED LOAD RATING (LEVEL IV) 23
24 RESPONSE-BASED RATING BENEFITS The rating is for the actual observed loads and load distribution. The rating accounts for the in-situ truck multi-presence and live load impact implicitly. The rating is based on the actual bridge behavior, including the secondary member and nonstructural element effects. The rating considers the actual bridge conditions, such as boundary conditions, the actual damage conditions and structural damage if it exists, such as concrete cracks and section loss. The method can reduce the effort and assumptions needed for finite element modeling RF = ε R γ DL ε DL γ LL ε LL_max = ε LL_all γ LL ε LL_max λ LL T = ε LL_max t = T max ε 1, ε 2, ε n 1.0 ε = M ES Projection factor 24
 5-year projection factor λ LL = 1.05 COV=4.4% RF=4.")
25 Daily maxima PEAK STAIN STATISTICAL DISTRIBUTION AND PROJECTION (BLOCK MAXIMA) Gumbel Projected_ 5 year = με Recorded=134.3 με Frechet Projected_ 5 year = με Recorded=134.3 με Load Rating Six months of data is recommended Gumbel and 5% tail is selected Lmax= (upper 95%) 5-year projection factor λ LL = 1.05 COV=4.4% RF=4.40 (legal and permit trucks) 25
26 SITE-SPECIFIC LIVE LOAD DISTRIBUTION FACTOR LDF = n(εes) j n ; (εes) i σ i=1 LDF site = (1 + LDF COV ) (LDF mean ) LL max = (LDF) (L max ) Site-Specific Live LDF= 0.25 (0.472) (S) LDF= 0.45 (0.652) (M) Span Girder Strain N Mean Std Dev Max COV 1 Strain Strain Strain Strain Strain Strain Strain Strain Strain Stain Strain Strain
27 RELIABILITY ANALYSIS AND IN-SITU LIVE LOAD FACTORS Reliability Index β = R nλ R 1 2V R 1 ln 1 2V R µ S =10.9 R n V R λ R 1 2V R 2 +σ S 2 Live load COV V LL = V measure + V conversion + V projection +V dana = (5.4%) 2 + 5% % 2 + 2% 2 = 8.9% Calibrate live load factor Z = R DL RF LL Rating Factor RF = 1.0 when β = 2.5 RF = R nλ R 1 2V R 1 ln 1 2V R β R n V R λ R 1 2V 2 R +σ 2 S μ DL = 4.26 μ LL Site live load factor γ LL = φ c φ s φr n γ DC D C1 +D C2 (RF)(L L ) = 1.10 (Legal), 1.00 (Design), 1.05 (Permit) 27
28 COMPARE WITH LEVEL I AS-DESIGNED RATING Level I Level II Level III Level IV Load Type Rating Level State Limits Distribution Factors FEM NDT WIM SHM 5.0 ksi 6.25 ksi Strain β HL-93 HL-93 HL-93 Inventory Inventory Inventory Service- III Tensile Strength- I Shear Strength- I Flexure HL-93 Operating Strength- I Flexure Legal Permit Legal Routine Strength- I Flexure Strength- I Flexure * 1.51* N/A * 2.23* N/A * 1.42* * 1.43*
29 METHOD ADVANTAGE 1. Utilizes the site-specific ambient traffic instead of the pre-defined trucks. 2. The measurement of structure element in-service responses directly to represent the actual bridge response under ambient live loads in order to reduce the uncertainties in modeling, dynamic factors, and live load distribution factors. 3. This research makes use of reliability analysis to derive the site-specific LRFR live load factors. 4. Different projection methods have been investigated, and one method is recommended for maximum live load and maximum strain projection. 5. Long term data provide the accuracy 6. Site-specific material 7. FE modeling and calibration for future rating 29
30 THANK YOU! 30