Seismic Interference The perspective of the site surveys
|
|
|
- Gyles Bond
- 5 years ago
- Views:
Transcription

1 Seismic Interference The perspective of the site surveys Thomas Elboth Sept, 2012

2 Seismic Interference Survey A B Site-survey perspective Up to 100km How to remove

3 Fugro Survey AS Responsible for Site Surveys in Norwegian waters Operates together with our sister company in Aberdeen 6 survey vessels Does approx 30 site and route survey reports yearly


4 Why Do Site Surveys? Site surveys are performed to minimise the risk of harm to personnel and equipment, and to protect the natural environment. The objective of any site survey is to identify all possible constraints and hazards from man-made, natural and geological features which may affect the operational or environmental integrity of a proposed drilling operation OGP Guidelines for the conduct of offshore drilling hazard site surveys, 2011

5 Why do a site survey Meet requirements Authority regulations Ptil: Aktivitetsforskriften KLIF guidelines Sjøfartsdir: Ankringsforskriften Operator policy Rig Insurance requirements Minimize your costs Avoid over engineering Avoid costly unwanted incidents
 Engineering activity on the")
6 You should do a site survey before Drilling a well Laying pipelines and cables (route survey) Engineering activity on the seabed

7 Typical potential hazards Unknown infrastructure, boulders, corals, spounges m Shallow gas, shallow waterflow,.. Soil Instability, stiff soils Boulders..


8 What tools are used Control the potential hazards Minimize cost Fit for purpose planning Comply with requirements Authority regulations Ptil: Aktivitetsforskriften KLIF guidelines Sjøfartsdir: Ankringsforskriften Operator policy Rig Insurance requirements


9 Tools for seabed survey Side scan sonar and multibeam Investigate natural/ manmade features/ obstructions on the seabed: Cables/ pipelines, boulders and torpedos..
10 Tools for sub seabed survey To investigate sub-seabed hazards and soil instability sub-bottom profilers (e.g. pinger, sparker and mini air gun) digital high resolution multi-channel 2D seismic Typical acquisition parameters site survey: - Active streamer length : 1200 m - Dist. between groups : 12.5 m - No. of groups : 96 - Sampling rate : 1 ms - Recording length : 2.5 sec - Shot point distance : 12.5 m - Streamer depth : 2.5 m (± 0.5 m) - Source towing depth : 2.5 m (±1 m) - Depth sensors on each section
11 Seismic Interference Survey A B Site-survey perspective Up to 100km How to remove
12 Time-sharing Statistics from Fugro Survey: 1. North Sea March 2012, 5% of operational time 2. North Sea autumn 2011, 10% of operational time 3. North Sea North summer 2011, >20% of operational time
13 SI-Solutions Traditional: New solution: Timesharing Ignore SI. Attenuate in processing Problem: Cost Problem: Does not always work Advantage: Perfect results Advantage: Low cost The third option: Plan ahead and coordinate, to avoid timesharing
14 Site-Survey vessels Versatile: If on standby, they can do: Sea-bottom profiling Geotechnical surveys Environmental surveys Typical short lines Can take advantage of line-changes Need to plan ahead Small: Often difficult to agree on time-sharing Unclear rules Time-share pr vessel or pr operating company in an area??? Sometimes difficult to obtain accurate info on seismic activity in an area
 Left : Difficult to attenuate Right: Easy to")
15 Onboard QC/processing Only basic QC is standard on site survey vessels Advanced QC or full onboard processing can help evaluate if SI is acceptable or not Direction Amplitude Time And one other nice thing (next slide) Left : Difficult to attenuate Right: Easy to attenuate
16 Onboard QC/processing Site-survey shot-point interval: ~3s Conventional seismic shot-point interval: 8-15s Sort data to CMP Apply de-noising algorithms to remove the SI SI Site-survey data sorted to CMP-domain
17 Seismic Interference Survey A B Site-survey perspective Up to 100km How to remove
18 General approach to remove SI 1. Transform and/or sort the data into a domain where we can separate SI from the seismic data. 2. In this new domain: Remove the SI. 3. Transform and/or sort the data back to the normal (shot/cmp) domain. The challenge is to identify the most suitable domain where the denoising should take place!
19 The story We present a few examples on how Fugro Seismic Imaging through careful processing have removed SI Specialized software modules and processing flows

20 Case 1: Conventional seismic data Strong SI + some swell-noise. SI comes from the front, and has similar move-out as the data. SI is visible on all shots. Shot-gathers
21 Parameters : Seismic Interference removal 1. Mild swell-noise attenuation in CO-domain using Fugro Statistical de-noising methods. 2. Make a model of the SI from the data using a Stationary Wavelet transform: Apply NMO to shot record Transform shot records using a Stationary Wavelet transform Mute the SI (examples will follow) Transform data back to time-frequency, keeping the SI Remove NMO Apply Random noise attenuation to improve the model of SI Output SI model 3. Subtract the output model 2. from the Input data Output shot with SI removed. 5. Additional swell-noise/si attenuation

22 1. Shots : Input


23 After final noise attenuation


24 Difference


25 1. Stack : Input

26 4. Stack : After noise attenuation
27 Difference
28 Case 2: Site-survey data Examples from site-survey processing in the North and Barents Sea. The flows are based on combining Tau-p muting and Fugros statistical denoising methods.

29 Shot gathers SEISMIC INTERF WITH OPPOSIT DIP SEISMIC INTERF WITH DIFFERNT DIP SEISMIC INTERF WITH SAME DIP AS DATA AREA NOISE WITH DATA DIP ON CONSECUTIVE SHOTS

30 Gathers after Tau-P mute SEISMIC INTERF REMOVED WITH TAUP MUTE SEISMIC INTERF NOT EFFECTED WITH MUTE NOISE ATTENUATED BUT STILL PRESENT

31 Difference
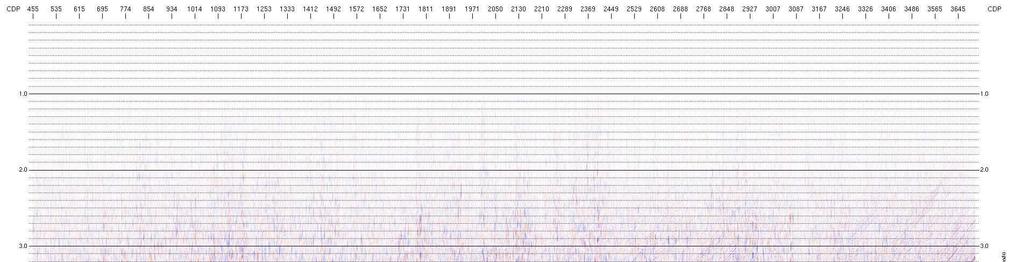
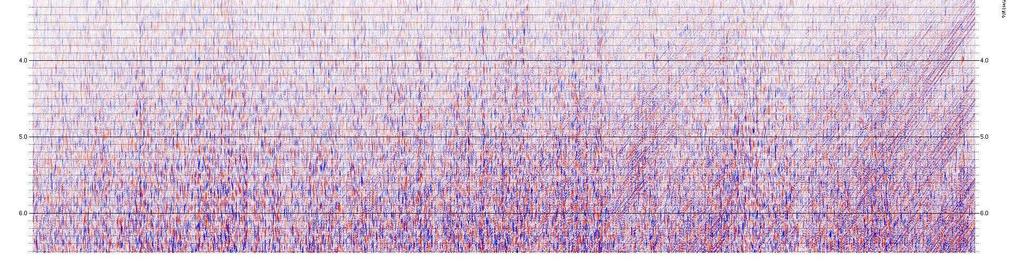
32 CDP s after Tau-p mute

33 CDP s after Fugro statistical de-noising

34 Difference
35 A new algorithm Transform the DATA into a domain where we can separate the NOISE from the SIGNAL 1. Tau-p transform 2. Statistical de-noising In this new domain, remove the NOISE Transform the de-noised DATA back to the time-domain Combinations of the algorithms above + sorting to make the SI random. (Elboth et.al. EAGE 2009) Getting the best of both worlds!


36 An advanced SI removal algorithm: INPUT In tau-p SI p-value Before, after and difference from TFDN on common-p gathers. Algorithm: Apply a tau-p transform on the gathers Sort the tau-p gathers into common-p, and identify where the SI is Apply TFDN on the common-p gathers Sort back to tau-p Transform data back to t-x Result: Before, after and difference from TFDN on tau-p gathers


37 TFDN + tau-p SI removal Before After Diff Site-survey data drowning in SI from a large 3-D vessel 37


38 SI in the near future In some ways, SI removal looks a bit like deblending. Problems: We do not control when the SI arrives. We do not control where it comes from. HOWEVER, Example of deblending
39 The idea for better SI-removal By iterating carefully, we can gradually separate SI and DATA Algorithm after Maraschini et. al. (EAGE 2012)

40 This type of INTERFERENCE might be difficult to handle.
41 Summary Can we drop timesharing when we have SI? In most cases YES, (but need advanced onboard QC to be sure!) The short shot-point interval of site surveys compared to conventional seismic is advantageous when we want to attenuate SI Great need to plan/coordinate surveys to avoid unproductive standby Site survey vessels can often do other types of activity when they are on seismic standby due to SI
42 Thank you