PERFORMANCE BASED PRACTICAL DESIGN
|
|
|
- Cori Norman
- 5 years ago
- Views:
Transcription


1 PERFORMANCE BASED PRACTICAL DESIGN

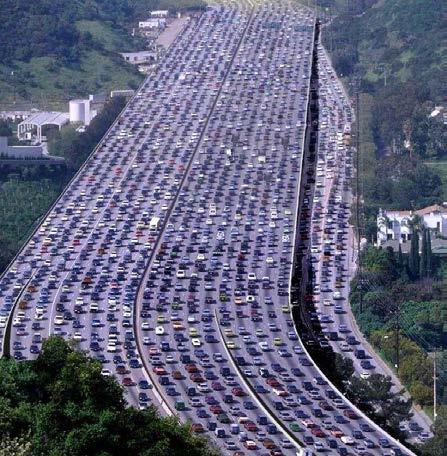


2 DOT S FACE INCREASING CHALLENGES

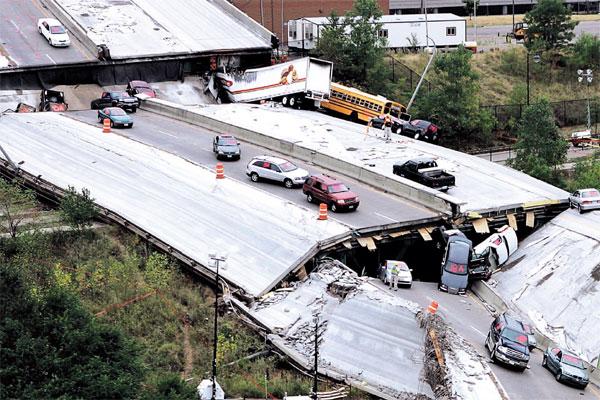
3 ENGINEERING CULTURE We learned from those who taught us how and why we follow the standards There are valid reasons that tell us we now need to work differently: Funding Staff Resources Aging infrastructure Environmental considerations Availability of reliable data and information Technology
4 WHAT IS PBPD? PBPD is a decision making approach that helps agencies better manage transportation investments and serve system-level needs and performance priorities with limited resources.
5 PBPD IS NOT: New Policy, Regulation, or Requirement Opportunity to disregard long-term needs: For short term cost savings Overlooking future development Compromising on safety, user needs (bike, ped, etc.), or accommodation of freight to save money
6 COMMON THEMES OF PBPD: Project decisions are based on critical examination of geometric elements Select/size elements that serve priority needs Reduce or eliminate those that don t Utilizes relevant, objective data to inform decisions Choices made to serve project priorities while trying to save money Project savings benefit System Needs
7 NOTABLE ATTRIBUTES PBPD focuses on performance improvements that benefit both project and system needs. Agencies make sound decisions based upon performance analysis. By scrutinizing each element of a project s scope relative to value, need, and urgency, a PBPD approach seeks a greater return on infrastructure investments.


8 PBPD OVERLAPPING Context Sensitive Solutions Value Engineering System Performance
9 PRACTICAL DESIGN EXAMPLE Existing Typical 9 Lanes 3 Shoulders Proposed Initial Typical 12 Lanes 4 Paved Shoulder 4 Aggregate Shoulder 11 Lane 2 Paved Shoulder 1 Aggregate Shoulder
10 Pavement Design Practical Design Savings Item Original Cost Practical Cost Savings Reduce driving lane from 12' to 11' $3,600,000 $3,300,000 $300,000 Minimize Underdrain Depth and locations $120,000 $60,000 $60,000 Shoulder Design Reducing shoulder Aggregate width 4' to 1' $160,000 $40,000 $120,000 Reduce to 3:1 Side Slopes and V-bottom ditches $775,000 $525,000 $250,000 Utilities Relocate 8" gas line to lower elevation $3,000,000 $500,000 $2,500,000 Move OH utilities inside Clear Zone: Reduce trees to be removed $232,000 $132,000 $100,000 Reduce area of mitigated wetlands $500,000 $400,000 $100,000 Reduce number of mitigated trees $50,000 $10,000 $40,000 Structures Modify instead of replace most large structures $700,000 $200,000 $500,000 Structure Removal $120,000 $20,000 $100,000 Minimizing Cover Depth at Crest Curves $40,000 Structure Backfill $60,000 $20,000 $40,000 TOTAL PROJECT SAVINGS: $4,150,000

11 PERFORMANCE BASED PRACTICAL DESIGN EXAMPLE
12 PERFORMANCE BASED PRACTICAL DESIGN EXAMPLE

13 PERFORMANCE BASED PRACTICAL DESIGN EXAMPLE


14 TEST YOUR GUESS: RECONFIGURING FREEWAY FOR CAPACITY How would you choose to reallocate the width for adding a lane? 16

15 TEST YOUR GUESS: RECONFIGURING FREEWAY FOR CAPACITY Out of alternatives 1-5, which predicted crash performance comes out on top? Alternative No. of General Purpose Lanes NoBuild 3 Inside Shoulder Width 12 Lane Width Outside Shoulder Width Alt Alt Alt Alt Alt Full Build
16 K at least one fatality occurs A at least one disabling injury occurs B at least one evident, non-disabling injury occurs C at least one possible injury occurs PDO Out of no alternatives injury occurs 1-5, but which property predicted damage crash in excess of performance the state s minimum comes reporting out on top? threshold occurs TEST YOUR KNOWLEDGE: RECONFIGURING FREEWAY FOR CAPACITY Which One Would You Choose? Alternative No. of General Purpose Lanes NoBuild 3 Inside Shoulder Width 12 Lane Width Outside Shoulder Width Estimated Crash Statistics Estimated average crash freq. during Study Period, crashes/yr: Total K A B C PDO Alt Alt Alt Alt Alt Full Build

17 Case Study: Evaluation of PennDOT I-70 Project using IHSDM


18 Case Study Alt. 3: Local road improvements (No Interchange) Alt. 2a: New Interchange
19 Case Study


20 Is this a Rutting Issue? A Cross-Slope Issue? Or Some Combination of Both?


21 Hydroplaning Speed (mph) Hydroplaning Predictive Analysis Results Section Length (ft) Rainfall Intensity: 6 in/hr Rainfall Intensity: 6.972in/hr Speed Limit

22 LIDAR WITH DRAINAGE PATH LENGTH MODELED

23 FIXING THIS IS COMPLICATED ESPECIALLY WHEN BRIDGES ARE INVOLVED

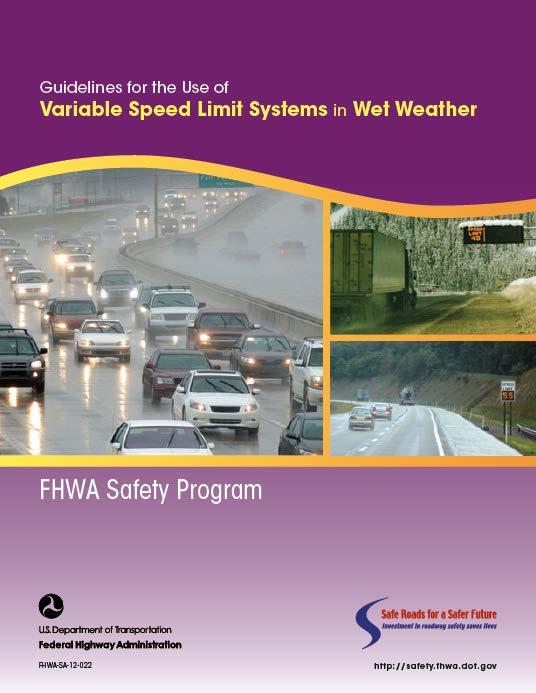
24 Variable Speed Limits
25 RISK AND UNCERTAINTY Usually we tend to focus on a single value or set of estimates to describe our projections into the future What about error? How sensitive are our results to potential changes in input? What sort of confidence can we assume? What is the probability of success?
26 WHEN YOU CONSIDER THE RISK OF BEING OFF ON YOUR PREDICTED PERFORMANCE CALCULATIONS What if the following assumptions are off? Traffic data Crash predictions User costs Construction/materials costs The chances the alternative will UNDERPERFORM the calculated B/C is greater than 89%. The chances the alternative will outperform the calculated B/C are about 10% Calculated Benefit/Cost
27 ALL ENGINEERING CHOICES HAVE TRADE-OFFS Which One Would You Choose? Below Design Criteria Meets or Exceeds Design Criteria Value (Operations, Safety, Efficiency etc.) Same Value, Lower Cost Minimum Standards Same Cost, Better Value Cost 29


28 TEST YOUR KNOWLEDGE: WIDENING FREEWAY FOR CAPACITY Which One Would You Choose? Out of alternatives 1-5, which predicted crash performance comes out on top? Alternative No. of General Purpose Lanes NoBuild 3 Inside Shoulder Width 12 Lane Width Outside Shoulder Width Estimated Crash Statistics Estimated average crash freq. during Study Period, crashes/yr: Total K A B C PDO Alt Alt Alt Alt Alt Full Build

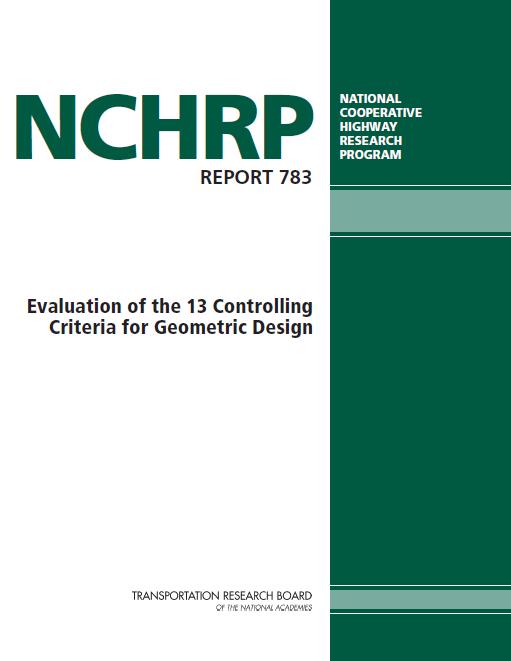
29 KEY REPORTS


30 THE 13 CONTROLLING CRITERIA ARE PROPOSED TO CHANGE 32
31 FHWA proposes to eliminate the following controlling criteria: Bridge Width Vertical Alignment Lateral Offset to Obstruction To improve clarity, FHWA proposes to rename the following existing controlling criteria: Horizontal Alignment Horizontal Curve Radius Grade Maximum Grade Structural Capacity Design Loading Structural Capacity
32 Controlling Criteria FHWA Proposes To Retain for Roadways on the NHS With a Design Speed Equal to or Greater Than 50 mph (80 km/h): 1. Design Speed* 2. Lane Width 3. Shoulder Width 4. Horizontal Curve Radius 5. Superelevation 6. Stopping Sight Distance 7. Maximum Grade 8. Cross Slope 9. Vertical Clearance 10.Design Loading Structural Capacity* *Design Speed & Design Loading Structural Capacity is proposed to apply to all NHS roads regardless of Design Speed Comments must be received on or before December 7, 2015
33 FHWA WILL BE A GOOD PARTNER FHWA is prepared to support States as they develop projects with a system performance mindset using data-driven methods
34 QUESTIONS