2nd GMES FORUM January 2003 ESA-ESTEC, Noordwijk, NL
|
|
|
- Beatrix Lamb
- 5 years ago
- Views:
Transcription
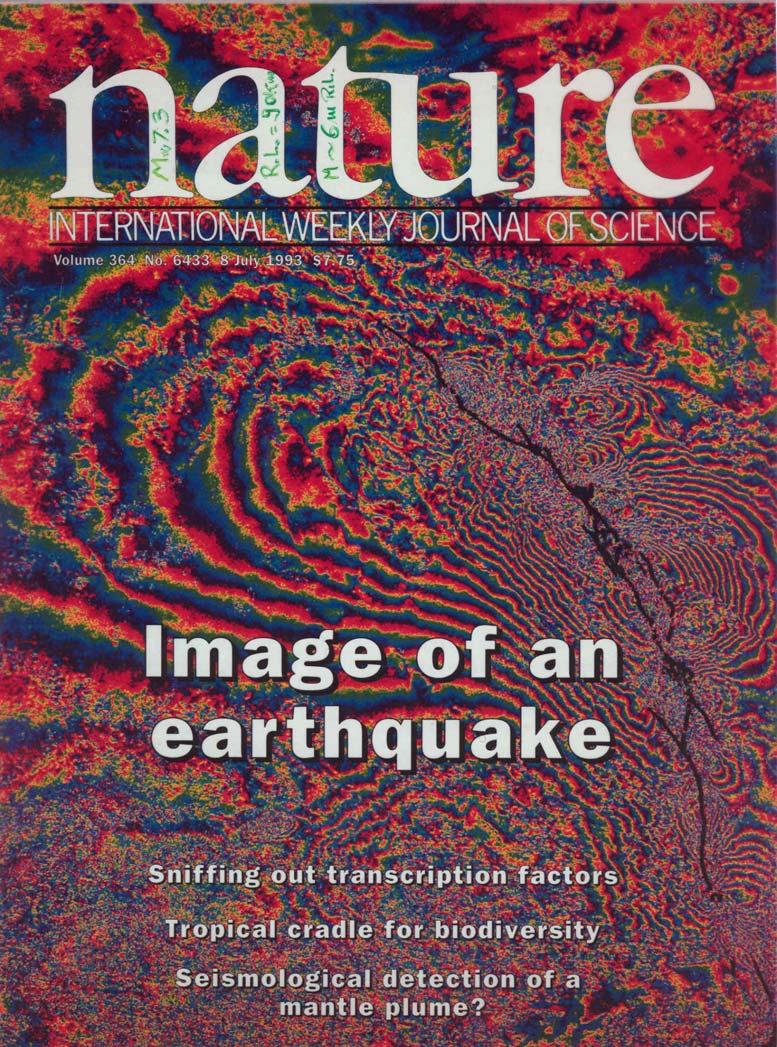
1 2nd GMES FORUM January 2003 ESA-ESTEC, Noordwijk, NL Large land deformation due to natural phenomena such as earthquakes and subsidence and implication on the natural resources Giorgio Cesari Director APAT Environmental Protection Agency and Technical Surveys of Italy
2 Effects Intensity (MSK) (MCS) -Cracks in saturated soil and/or loose alluvium up to 1 cm, - in saturated soil and/or loose alluvium a few cm, - in saturated soil and/or loose alluvium up to 10 cm, - in saturated soil and/or loose alluvium a few dm up to one m - on road backfills and on natural terrigenous slopes over 10 cm - on the dry ground or on asphalted roads -Faults in terrigenous terrains and in rocky terrains -Liquefaction and or mud volcanoes and/or susidence -Landslides in sand or gravel dykes - in terrigenous slopes -Rockfalls -Clouding in the closed water bodies and formation of waves -Water bodies new formation -Flooding -Water level variation of the groundwater level and the flow rate of springs VI VIII IX X VII - IX VII XI XI - XII IX X VII X VI XI IX XII VII IX VIII XII X XII V - X VIII X VIII X XI XI X XI VII X - XI X XI VII VIII XII X VII - X Summary table of the effects on the ground described in the intensity scales
 Magnitude")
 10")
3 Colfiorito (26/09/1997) Magnitude 6.0 Fault rupture length (km) 10 Dislocation (cm) 8 8 cm

 50 Dislocation")
4 Irpinia (23/11/1980) Magnitude 6.9 Fault rupture length (km) 50 Dislocation (cm) cm
")


5 Boiano (26/07/1805) Magnitude Fault rupture length (km) Dislocation (cm) cm
6 Magnitude Surface rupture (km) Average deformation (cm) Moment magnitude (Mw) Data from Wells and Coppersmith (1994) (nil values filtered out) Surface rupture length (km) Scaling laws for earthquakes
")


7 Landers (28/06/1992) Magnitude Fault rupture length (km) Dislocation (cm)
8

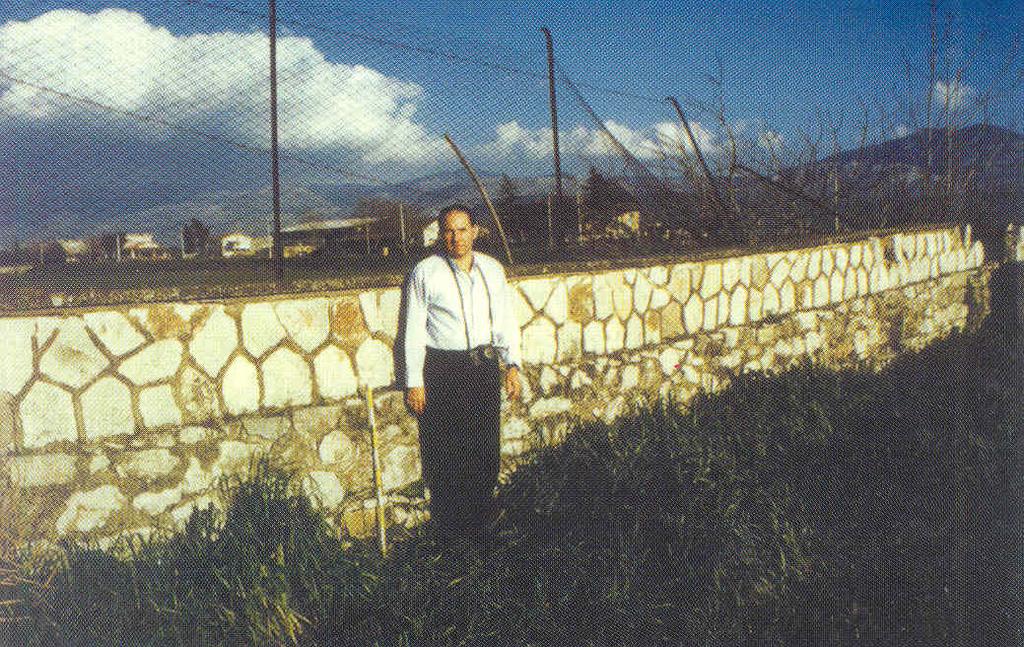
9 LAND SUBSIDENCE Bench mark S661 southwest of Mendota (S. Joaquin Valley, California). The bench mark site subsided 9m from 1925 to 1977, because of intensive withdrawal of ground water. Signs on the power pole indicate the respective positions of the land surface in 1925, 1955 and 1977.
10 Causes of land subsidence (Freeze, 2000) Type Natural Anthropogenic Result Compaction of surficial soils Rapid local subsidence Long-term regional subsidence Rapid local subsidence due to subsurface mining Long-term regional subsidence due to withdrawal of fluids Cause Hydrocompaction of dry soils on initial wetting Compaction of organic soils on drainage Sinkholes in karst terrain Collapse features over salt Compaction of basin sediments Tectonic influences Collapse of underground coal mines, salt mines, limestone mines Impact of engineered underground openings such as tunnels Groundwater withdrawals Oil and gas production Geothermal development Mine dewatering
11 Consequences of Land Subsidence and Overpumping of Groundwater Prolonged and extended flooding by river- and/or seawater. Loss of lagoonal ecosystems and habitat Saltwater intrusions into freshwater estuaries and acquifers Soil salinization Damage to the infrastructure such as to the foundations of buildings, roads, bridges and buried pipelines. Also protrusion above the land surface of the heads of water wells occurs. Disturbance and deterioration of the drainage system (canals and sewerage systems) because of the development of a subsidence bowl(s) with no natural damage. Coastal erosion
12 Different methods of measuring land subsidence (USGS, 2000) METHOD Component displacement Resolution 1 (millimeters) Spatial density 2 (samples/survey) Spatial scale (elements) Spirit level vertical line-network Geodimeter horizontal line-network Borehole extensometer vertical point Horizontal extensometer: Tape horizontal line-array Invar wire horizontal line Quartz tube horizontal line GPS vertical horizontal network InSAR range ,000-10,000,000 map pixel 3 1 Measurement resolution attainable under optimum conditions. Values are given in metric units to conform with standard geodetic guidelines. (One inch is equal to 25.4 millimeters and 1 foot is equal to millimeters.) 2 Number of measurements generally attainable under good conditions to define the spatial extent of land subsidence at the scale of the survey. 3 A pixel on an InSAR displacement map is typically 40 to 80 meters square on the ground.

13 Synthetic Aperture Radar (SAR) Interferometry is a powerful technique that enables the measurement of smallscale surface deformation using the European Space Agency (ESA) satellites ERS-1 and ERS-2. Subsidence map of the Cesena-Forlì region for the time period The levelling line used for validation is also shown. (ERS Data Copyright ESA 1999, Processing by GAMMA) Comparison of the subsidence rates from levelling surveys and SAR along one levelling line. Levelling data courtesy of the Municipality of Ravenna.
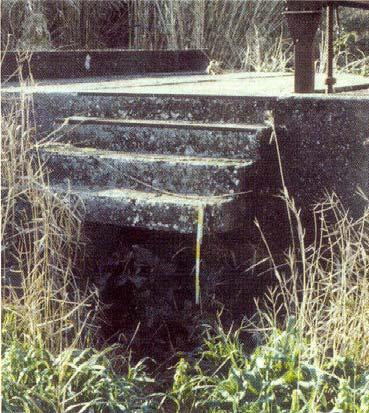
14 Subsidence in the Pontina Plain
15 Examples of benefits, costs and risk costs for Government Land-use Planning Agency (modified from Freeze, 2000) Benefits - Social benefits associated with land-use management policies (total economic value to industry, agriculture, tourism etc..) - Income from permits, taxes and fines - Settlements from litigation Capital Costs and Operational Costs - Cost of construction and operation of public damage prevention works (if any) - Cost of administering management policies - Cost of litigation Risk Costs Associated with Land Subsidence - Social costs associated with failure of management policies (total economic loss due to physical damage, loss of agricultural production, impact on tourist industry etc..) - Cost of compensation of impacted parties
16 APAT-ARPA environmental agency system and land subsidence problems The collection, validation and homogeneization of subsidence data at national and local scale is one of the main issue of an agency system like APAT ARPA The database will provide the necessary data: to understand the real impact of the subsidence; to know the measures adopted to mitigate the subsidence risk at local scale; to identify what areas prone to subsiding need to be monitored. Main problems are a proper network between the central (APAT) and local (ARPA-APPA) institutions is still missing; available data are disseminated among a great number of local authorithies (land reclamation consortia, municipalities, privates, etc). At present, only some regional agency (ARPA Emilia-Romagna) has prepared a specific GIS database implemented and updated with subsidence data.
17 Socioeconomic strategies for coping with land subsidence due to groundwater withdrawal (modified from Freeze, 2000) Management Policies Reduced pumping Enhanced recharge Land-use planning Building codes Activity - Development of regional water-supply strategy - Establishment of regional groundwater management authority with power to control pompage - Inclusion of enhanced recharge in regional water managment strategy - Development of regional land-use plan - Resiting: pumping wells; endangered buildings and facilities - Zoning:groundwater-use exclusion zones; construction restrictions in subsiding areas; setback provisions from earth fissures, collapse zones - Guidelines for construction in areas of land subsidence