Polymer Overlays of New Bridge Decks. Kyle Riding, Ph.D., P.E. Robert J. Peterman, Ph.D., P.E. Andy Shearrer
|
|
|
- Amber Daniels
- 5 years ago
- Views:
Transcription
1 Polymer Overlays of New Bridge Decks Kyle Riding, Ph.D., P.E. Robert J. Peterman, Ph.D., P.E. Andy Shearrer
2 Kansas Polymer Overlays Epoxy Polymer Overlays 2 part epoxy Flint aggregate Epoxy protects the bridge deck from water and chloride intrusion Flint provides abrasive surface Typically used as a bridge preservation strategy


3 Pictures courtesy of Dave Meggers Overlay Placement


4 Pictures courtesy of Dave Meggers Overlay Placement
5 CONDITION Typical Overlay Schedule as a Repair Good Assessment Start Work Poor TIME
6 CONDITION Typical Overlay Schedule as a Repair Good Assessment Start Work Poor TIME
7 CONDITION Typical Overlay Schedule as a Repair Good Assessment Start Work Poor TIME
8 CONDITION Typical Overlay Schedule as a Repair Good Assessment Start Work Poor TIME
9 Project Statement Polymer overlays have been used in Kansas for over a decade on existing bridges Now being specified on new construction How long after wet curing should pass for adequate bond? Current KDOT specification call for 14 days wet cure followed by 21 days dry cure Several weeks delay
10 Utah 14 day wet cure, 28 days after placement Some manufacturer's do moisture tests of the concrete decks to make sure it's cured and dry No additional special provisions, spec
11 Pennsylvania We are like Utah, we wait for the deck to go through one winter prior to placing the epoxy overlay. The epoxy overlays are able to bridge over cracks. Thus by letting the deck go through a cold cycle, we are confident that most cracking has occurred. If the epoxy overlay is placed prior to cracking, we are fairly confident that the deck cracking will reflect up through the epoxy overlay. Tom Macioce, P.E. Chief Bridge Engineer, PA DOT
12 Virginia Waited 28 days and used curing compound. Research indicates that the highest bond strengths can be achieved by waiting 28 days for most of the mix water to react with the cement. We wait for the concrete to age 28 days. If we want to do the overlay earlier we construct test patches and test for bond strength and if we get > 250 psi and failure in the concrete we allow placement of the overlay. Michael Sprinkel, P.E. Associate Director, VDOT
13 Wisconsin 14 day wet cure, 28 days after placement The polymer overlay spec requires the moisture content in the deck to be less than 4.5% when measured by an electronic moisture meter and cannot show visible moisture after 2 hours when measured in accordance to ASTM D4263. William Dreher, P.E. Structures Design Chief, WisDOT ASTM D4263 plastic sheet method
14 Other DOT s Illinois-7 day wet cure, 28 days after placement New York-same as required strength Most DOT s did not place polymer overlay on new bridge decks by design


15 Test Program Slab Dimensions
16 Mix Designs Low-Cracking 25% Fly Ash Control 550 lb Cement w/c = % Coarse Aggregate ¾ Limestone 40% Fine Aggregate 800 ml/kg cement of Water Reducer 550 lb Cement 25% Fly Ash w/c =.5 60% Coarse Aggregate ¾ Limestone 40% Fine Aggregate 0 ml/kg cement of Water Reducer Needed 550 lb Cement w/c =.5 60% Coarse Aggregate ¾ Limestone 40% Fine Aggregate 600 ml/kg cement of Water Reducer
17 Slab Matrix (180 slabs) Concrete Type (60 per) Control w/c =.5 Wet 100% RH 14 Days (60 per) Dry 50% RH (45 per) 40 F 3 Epoxy (30 per) E-Bond 526 (1) 7 Pro-Poxy (2) Low- Cracking 73 F Flexolith (3) 14 Sikadur (4) 25% Fly Ash 100 F 21 Mark 154 (5)


18 Testing Procedure Concrete Placement Placing concrete Forms made to accommodate handles along the bottom of the short edge Thermocouple wire is placed 1 in below the surface


19 Testing Procedure - Curing Cure concrete Wet cure for 14 days in 40, 73, or 100F Remove from wet cure and wrap slab in plastic Place in 73F, 50% RH room to dry cure

20 Overlay Placement Sand Blast Surface KDOT specifies a surface roughness of 6-7 according to ICRI Only a 3-5 was obtainable with equipment Moisture Test Take 6 moisture readings across the surface Place 1 st and 2 nd course of overlay


21 Testing Procedure Post Curing Day 1 Sand Blast Surface Moisture Test Take 6 moisture readings across the surface Place 1 st and 2 nd course of overlay

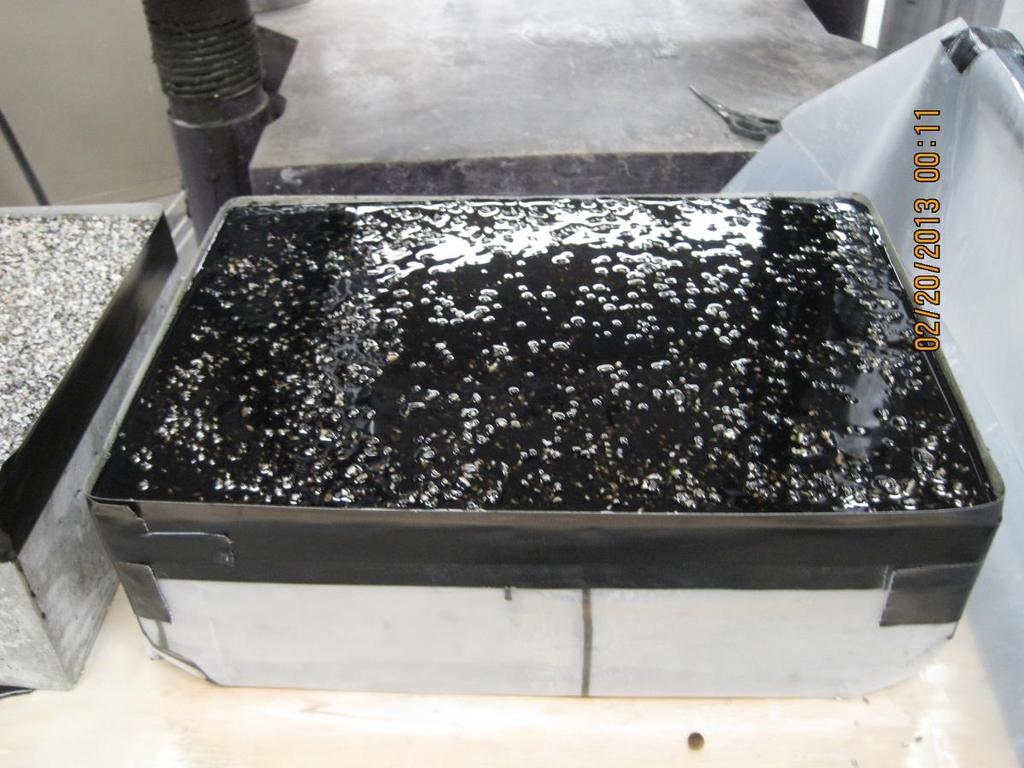
22 Overlay Placement- 1 st Layer
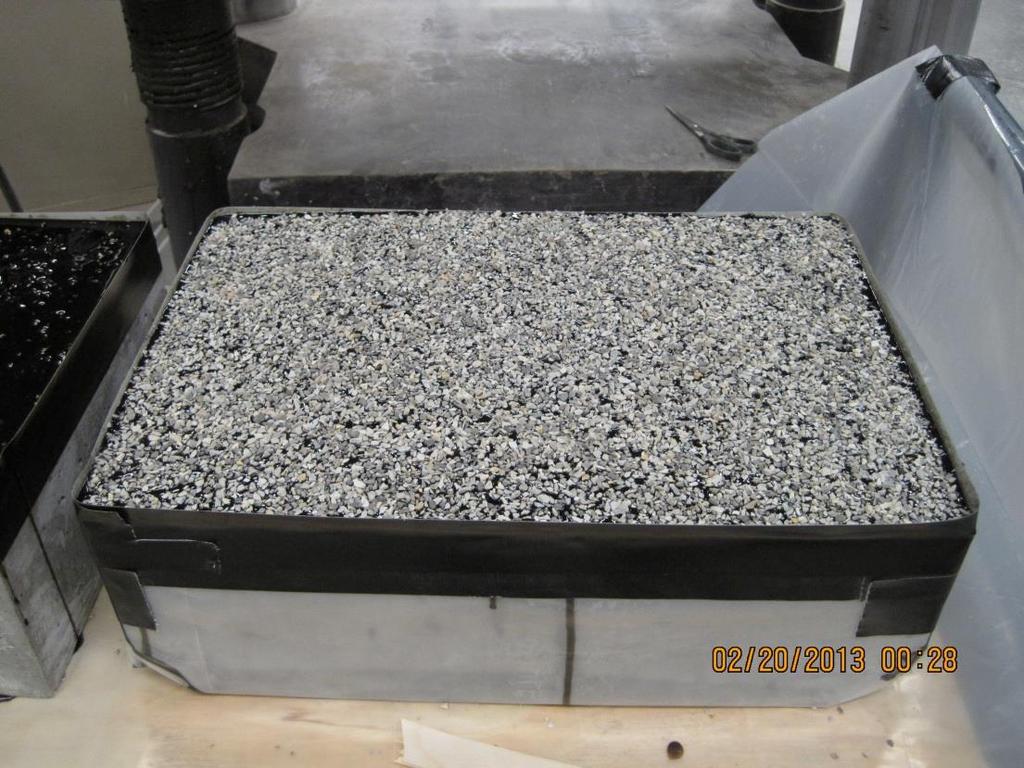
23 Overlay Placement- 2 nd Layer

24 Testing Procedure After Curing Day 2 Drill 8 cores to 1/2 inch deep in concrete Place adhesive and mount pull-off caps Fill cores with silicone caulk

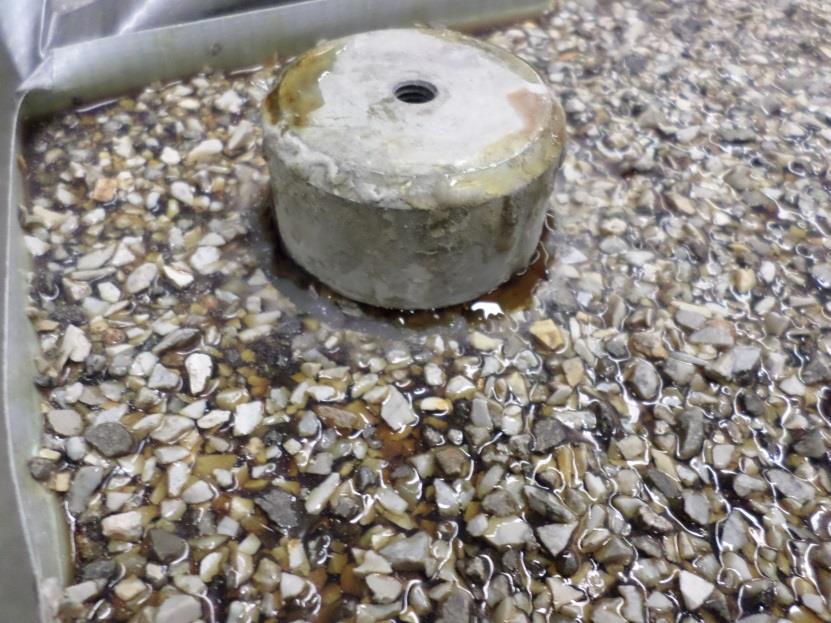

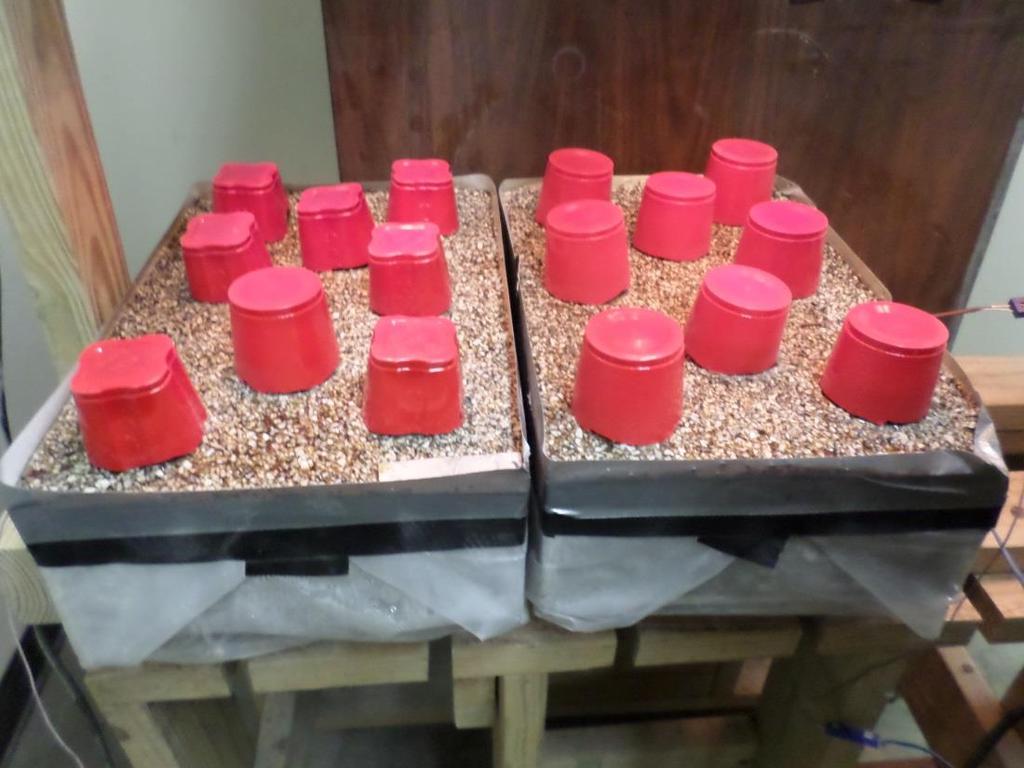
25 Mount Pull-Off Caps


26 Testing Procedure After Curing Day 3 Heat slabs with heat lamps to F at 1 inch below surface Once slabs reach internal temperature of F, perform hot pull-off tests Allow slabs to return to room temperature and perform cold pull-off tests

27 Heat Slabs
28 Testing Procedure After Curing Day 3 Cylinders tested for compressive strength 2 at 14 day wet cure 2 per slab at pull-off
29 Moisture Readings
30 Dry Cure Time (Days) Overall Overall Moisture Percentages Percentage Decrease from Previous Percentage Decrease from Previous (Per Day) Percentage Decrease from 3 Day Moisture % % -0.14% -0.55% % -0.46% -3.76% % -0.04% -3.99%
31 Moisutre % 7.0 Moisture Readings: Concrete Type CONTROL LOW-CRACKING FLY ASH Dry Cure (Days)
32 Moisutre % Moisture Readings: Pre and Post Sand Blasting for Fly Ash Concrete FLY ASH PRIOR TO SAND BLASTING Dry Cure (Days)
33 Moisture % Moisture Readings: Pre Sand Blasting for the Fly Ash Concrete Categorized by Wet Cure Temperature F 73 F 100 F Dry Cure (Days)

34 Additional Testing Batched smaller concrete specimen to dry at 200 F Compare moisture meter readings to moisture content determined by weight
35 Moisture % Moisture Contents of Heat Dried Specimen 8.0% 7.0% 6.0% 5.0% 4.0% 3.0% Specimen 2: Moisture by Weight Specimen 4: Moisture by Weight Specimen 2: Moisture Meter Specimen 4: Moisture Meter 2.0% 1.0% 0.0% Time (hours)
36 Additional Testing Slabs drying for 21 days were subjected to moisture meter readings throughout drying period Moisture readings taken same from procedure earlier Show what individual slabs looked like during drying
37 Moisture % Time Progression of Moisture Readings for Selected Slabs F F F F F F F F F Dry Cure Days
38 Pull-off Results
39 Note on Slab Labels C st value refers to Concrete Type C (control), L (low-cracking), F (fly ash) 2 nd value refers to wet cure temperature 40 F, 73 F, or 100 F 3 rd value refers to dry cure time in days 3, 7, 14, or 21 days 4 th value refers to epoxy used for overlay 5 different epoxy brands used
40 Note on Slab Labels Hot and Cold pull-offs hot pull-offs Pull-offs performed when internal temperature of concrete is F cold pull-offs Pull-offs performed after 24 hours when internal temperature of concrete has returned to room temperature (~73F)


41 Types of Failures There are five types of failures: Type 1 Failure in the concrete at a depth greater than or equal to ¼ inch over more than 50% of the test area. Type 2 Failure in the concrete at a depth less than ¼ inch over more than 50% of test area. Type 3 Separation of the polymer overlay from the concrete surface. Type 4 Failure within the polymer overlay. Type 5 Failure of the test adhesive. Taken from KDOT s KT-70 Type 1 Type 2 Type 3 Type 4 Type 5
42 Pull-off (psi) 500 Pull-offs Test Results Hot Temperature Room Temperature Dry Cure Time (Days)
43 Dry Cure Time (Days) Pull-off Hot Temperature Percentage Percentage increase from increase from Pull-off Room Temperature Percentage increase from previous Percentage increase from 3 days (psi) previous 3 days (psi) % 13.8% % -2.1% % 40.0% % 4.0% % 43.1% % 9.4%
44 Pull-off (psi) 500 Hot Pull-offs: Concrete Type CONTROL LOW-CRACKING FLY ASH Days after Wet Cure
45 Pull-off (psi) 500 Room Temperature Pull-offs: Concrete Type CONTROL LOW-CRACKING FLY ASH Days after Wet Cure
46 Pull-off (psi) 500 Hot Pull-offs: Wet Cure Temperature F 73 F 100 F Days after Wet Cure
47 Pull-off (psi) 500 Room Temperature: Wet Cure Temperature F 73 F 100 F Days after Wet Cure
48 Pull-off (psi) Hot Pull-offs: Epoxy Type E-Bond 526 Pro-Poxy Type III DOT Flexolith Sikadur 22 Lo Mod Mark Days after wet cure
49 Pull-off (psi) 500 Room Temperature Pull-offs: Epoxy-Polymer Overlay E-Bond 526 Pro-Poxy Type III DOT Flexolith Sikadur 22 Lo Mod Mark Days after wet cure


50 Additional Testing Epoxy Tension Test Check for epoxy softening at higher temperatures Pull-off test results conducted at 73 F twice the strength of tests conducted at 122 F
51 Tensile Force 73 F 122 F Force (lbf) Comments Force (lbf) Comments Test Test Not full coverage Test Not full coverage 2940 Test Test Broke prior to testing Average of all tests Average of tests with full coverage
52 Moisture Conclusions Moisture readings taken prior to sand-blasting decreased significantly with time Moisture readings taken after sand-blasting decreased only slightly with time Greatest moisture decrease occurred between 7 and 14 days
53 Moisture Conclusions (cont.) Concrete surface dried out initially Moisture from within the concrete replenished the moisture on surface during drying The surface moisture is not the only reading needed
54 Pull-off Test Conclusions Pull-off results were nearly double when tested at 73 ± 5 than at pull-off tests showed much higher strength gain when given extra time (>40% gain) 73 ± 5 pull-off tests showed smaller strength gains (<10%)
55 Pull-off Test Conclusions (cont.) Pull-off test results did not correlate well with the moisture readings As noted previously, internal moisture replenished surface moisture Pull-off test results affected by more than just the surface moisture readings
56 Recommendations Place overlay between 10 and 14 drying days Pull-off strength increased most between 7 and 14 days Moisture decreased the most between 7 and 14 days Surface moisture was unable to predict pull-off strength More tests to see how internal moisture in concrete dries
57 Thank you all for coming! Questions?