Analytical Study on Input Shear Forces and Bond Conditions of Beam Main Bars of RC Interior Beam-Column Joints
|
|
|
- Christiana McDonald
- 5 years ago
- Views:
Transcription


1 Analytical Study on Input Shear Forces and Bond Conditions of Beam Main Bars of RC Interior Beam-Column s T. Kashiwazaki Chiba University, Japan C. Jin MIDAS IT Japan Co.,Ltd., Japan H. Noguchi Kogakuin University, Japan SUMMARY: The seismic performances of RC structures under seismic forces were especially affected by the bond conditions of beam main bars through a beam-column joint. Then it was very important to establish the rational design method considering with the relationships between input shear forces and bond conditions of beam main bars of RC interior beam-column joints. In this study, non-linear analyses using a three-dimensional finite element method (3-D FEM) were carried out in order to understand the relationships between input shear forces and bond conditions of beam main bars of RC interior beam-column joints. As for the relationships between story shear force and story drift angle, FEM analytical results gave a good agreement with experimental stiffness, maximum story shear force, hysteresis loops and failure modes. And strain distributions of beam main bars though a joint were accurately evaluated by considering appropriate analytical bond models. Keywords: Reinforced concrete structure, Beam-column joint, Finite element method, Nonlinear analysis 1. INTRODUCTION The seismic performances of RC structures under seismic forces were especially affected by the bond conditions of beam main bars through a beam-column joint. The bond deteriorations of beam main bars through a joint, moreover, may be caused by the input shear forces from adjacent beams and columns. Then it was very important to establish the rational design method considering with the relationships between input shear forces and bond conditions of beam main bars of RC interior beam-column joints. Axial force:n=294 kn In this study, non-linear analyses using a three-dimensional finite element method (3-D FEM), which is very useful to get the rational solution of 3-D stress conditions, were carried out in order to understand the relationships between input shear forces and bond conditions of beam main bars of RC interior beam-column joints. Story height Span =1400mm 2000mm 2. OUTLINES OF ANALYSYS 2.1. Reference Specimens 2-D16 2-D16 3-D16 2-D13 Reference specimens for this 3-D FEM analysis were selected from the previous experimental study. This test was carried out by Sawada K., Kishimoto N., Hayashi S. and Kamimura T. Column section (250mm 250mm) Beam section(250mm 180mm) Figure 1. Shape and bar arrangement of specimens

 (SD295) (USD685) Stirrup -D6@80(SD345) Bond index 2.5 2.5 4.")
 368 751 401 335 Young's modulus (N/mm")
, Hong J. (Hong. 2009), Kashiwazaki T. (Kashiwazaki. 2008) and Noguchi H. (Noguchi. 2008). The following non-linear constitutive models were included in this 3-D FEM program.")
2 (Sawada. 2006). Main parameters of this test were input shear force and bond conditions of beam main bars through a joint. Shape and bar arrangement of specimens is shown in Fig. 1. Properties of specimens and material properties were shown in Table 1 and 2, respectively. Three reference specimens failed in beam flexural failure, joint shear failure after beam flexural yieldings and beam flexural failure after concrete compressive failure at critical section in the tests, respectively. Table 1. Properties of specimens Specimen Main bar 2-D16 3-D16 2-D13 Beam (SD295) (SD295) (USD685) Stirrup -D6@80(SD345) Bond index Column Main bar 12-D16(SD245) Hoop -D6@50(SD345) Beam-column p w (%) 0.30 τ py /vб B Table 2. Material properties of concrete and reinforcement Reinforcement Main bar in a beam Main bar in a column Stirrup and hoop D16 D13 D16 D6 Yield strength (N/mm 2 ) Young's modulus (N/mm 2 ) Comp. strength of concrete (N/mm 2 ) б B = Analytical Models This analytical study was carried out using 3-D FEM program developed by Yu Y. (Yu. 2005), Hong J. (Hong. 2009), Kashiwazaki T. (Kashiwazaki. 2008) and Noguchi H. (Noguchi. 2008). The following non-linear constitutive models were included in this 3-D FEM program. Concrete was represented by 8-node solid elements. It was modeled as orthotropic material, based on the hypoelastic formulation, using the equivalent uniaxial strain concept proposed by Darwin-Pecknold, modified by Murray et al.. Saenz model was used for ascending compressive stress-strain relationships of concrete. After cracking in concrete, tension-stiffening model proposed by Shirai et al. was assumed. Strain of beam main Comp. zone of beam Compression Center Tension Tenssion strain Ten. zone of beam Main bar in beams Figure 2. Bond elements through a joint

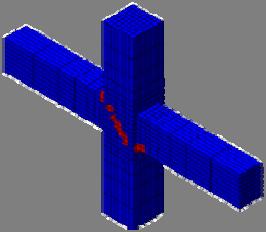
3 Reinforcement was modeled by 2-node linear elements. Modified Menegotto-Pinto model was used for stress-strain relationships of reinforcement. As for bond between longitudinal reinforcement and concrete, Morita-Kaku model was used. Bond elements through a joint were shown in Fig. 2. Material properties of bond through a joint were shown in Table 3. Table 3. Material properties of bond through a joint Specimens Zone of bond link Elastic bond stiffness (N/mm 2 ) Secondary bond stiffness (N/mm 2 ) Bond stress at break point (N/mm 2 ) Max. bond stress (N/mm 2 ) Comp. of beam Comp. of joint Center of joint Tension of joint Ten. of beam Comp. of beam Comp. of joint Center of joint Tension of joint Ten. of beam Comp. of beam Comp. of joint Center of joint Tension of joint Ten. of beam Figure 3 shows finite element idealization and boundary conditions. 3. ANALYTICAL RESULTS 3.1 Story Shear Force Story Drift Angle Relationships Figure 4 shows the relationship between the story shear force and the story drift angle for each specimen under cyclic and monotonous loading. The locations at which crushing has occurred (at ultimate strength) in each specimen are displayed to the upper left of the load displacement relationships. In this study we find that concrete has experienced crushing in regions in which the strain exceeds a level obtained by unconfined compression testing, which corresponds to crushing strength. The corresponding regions are displayed in red. In all specimens, good correspondence was observed in relation to initial stiffness. This also implies that good correspondence was observed in relation to ultimate strength. All specimens produced a thin, reverse-s-shaped loop due to cyclic loading applied after the main reinforcements yielded. In the results for cyclic loading for specimens and, the decrease in strength after ultimate strength was overestimated. y Axial force Shear force Displacement Roller Positive loading z Pin x Pin Negative loading Figure 3. Finite element idealization and boundary conditions
")
")


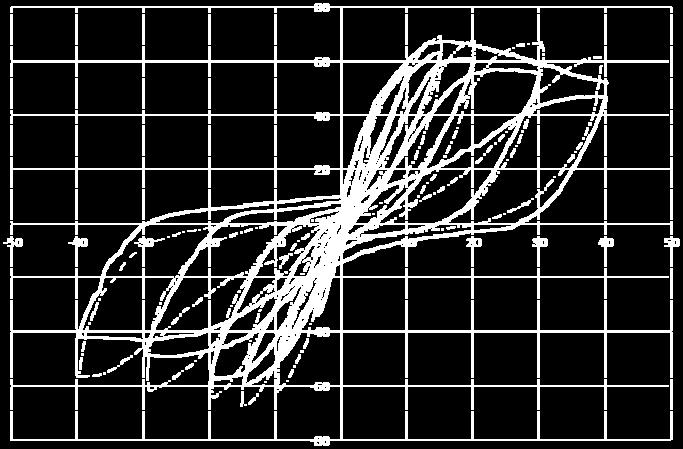
4 Story drift angle(r 10-3 ) Story drift angle(r 10-3 ) Story shear force(kn) Story shear force(kn) Story shear force(kn) Story drift angle(r 10-3 ) Figure 4. Relationships between story shear force and story drift angle


5 In specimen, in which the shear input is smaller, the beam main reinforcements experienced yielding before ultimate strength. As with the experimental results, the joint reinforcements and the main column reinforcements did not yield to the end. Also, concrete at beam bases experienced crushing immediately after the beam main reinforcements yielded, and experienced a decrease in strength at a point earlier than in the experiment. In specimen, in which the shear input is larger, the beam main reinforcements experienced yielding before ultimate strength. Then a decrease in strength was observed, and the joint reinforcements subsequently experienced yielding. In specimen, in which high-strength reinforcements were used for the beam main reinforcement, crushing was observed in the concrete compression region at beam bases before ultimate strength. The beam main reinforcements yielded at ultimate strength. Crushing phenomenon at the beam bases subsequently developed, causing a decrease in strength. The crushing is thought to occur due to high-strength reinforcement causing an increase in the length of slip-out of the beam main reinforcements from the joint, along with the stretch length of the reinforcements, which results in increased deformation of the joint. As for crushing conditions of concrete, in specimen the extent of the crushing reached the interior of the joint, and that is where the joint failure occurred. In contrast, in specimens and the crushing regions were concentrated in the beam and column ends. From these results we determined that specimen is a beam flexural failure-type, specimen is a joint failure type after beam flexural yielding, and specimen is a beam flexural crushing type, as also seen in the experimental results. It also follows from the above that although the decrease in strength after ultimate strength in the cyclic analytical results is somewhat more pronounced than in experimental results, the analysis was able to accurately reproduce the experimental load displacement relationships, including stiffness, ultimate strength, hysteresis loop, and failure mode. 3.2 Strain Distributions in a Beam Main Bar through a Figure 5 shows a comparison of the strain distributions in the beam top bar through a joint with experiment at ultimate strength. Both the size and the gradient of the main reinforcement strain show a good correlation in specimens and. All specimens saw an increase in the beam main Distance from column center(mm), R=1/250rad Distance from 柱中心からの距離 column center(mm), (mm) R=1/100rad Distance from column center(mm), R=1/250rad Distance from column center(mm), R=1/250rad Distance from column center(mm), R=1/100rad Distance from column center(mm), R=1/67rad Distance from column center(mm), R=1/100rad Distance from 柱中心からの距離 column center(mm), (mm) R=1/67rad Distance from column center(mm), R=1/50rad Figure 5. Strain distributions in a beam main bar through a joint


6 reinforcement strain on the tension side in the critical section of the joint at the main reinforcement yield. In all specimens, the main reinforcement strain within the joint on the compression side shifts from compressive to tensile strain. Under cyclic loadings, the main reinforcements thereby slip relative to the surrounding concrete, generating bond degradation along the main reinforcements and causing thin, reverse-s-shaped hysteresis loops. In specimen, good analysis-experiment correspondence is observed for R=1/250 rad and R=1/100 rad. However, for R=1/100 rad and R=1/50 rad, the strain was higher in the tension side and lower in the compression side than in the experimental results. Although in the experiment the main reinforcement strain in the compression side shifts from compressive to tensile strain, in the analysis, the main reinforcement strain remains compressive even at larger story drift angles, leading to strain properties that differ between FEM and experiment. This is due to the fact that large values were used for secondary bond stiffness and the maximum bond stress of the bond element in the joint region in order to obtain a stable analysis. There is room for further investigation in this regard. 3.3 Average Bond Stresses in a Beam Main Bar within the Figure 6 shows the relationship, for each specimen, between the average bond within the joint region and the strain in the beam main bars on the tension side at the joint end. For all specimens, the relationship is shown until yielding in the beam main bars on the tension side at the joint end. For specimens and, the initial bond stiffness and the decline point were moderately overestimated in relation to experimental values. However, a decrease in stiffness was observed after flexural cracking in the column in all instances. It is thought that bond characteristics were insufficiently modeled, resulting in a delay relative to experimental results in the occurrence of flexural cracking in the column. Since it is difficult to precisely evaluate the time at which column flexural cracking occurs using the smeared crack model, we consider instead the status of the cracking at the drift angle when column flexural cracking was observed experimentally (Figure 7). In this study we assumed that cracking occurred when the tensile principal strain exceeded the strain at tensile strength of concrete. Cracking is shown by circles. A circle whose color is closer to red indicates a greater cracking width. The tilt of the circles indicates the direction of cracking. Average values at the integration points in each of the elements were used. The analysis of cracking at the point in time in which column flexural cracking was observed experimentally shows that column flexural cracking occurred gradually in the joint tensile region along the direction of the beam main bars. :Column flexural crack() Yield strain of beam main bar () Average bond stress (MPa) Yield strain of beam main bar (, ) Strain in a main bar (μ) Figure 6. Relationships between average bond stress and strain in a main bar


7 Column flexural crack Column flexural crack Column flexural crack R = 1/400 rad R=1/600 rad R=1/120rad Figure 7. Crack distributions in a joint at column flexural crackings Beam flexural crack Beam flexural crack Beam flexural crack Column flexural crack Column flexural crack Column flexural crack shear crack shear crack shear crack Figure 8. Crack distributions in a joint at yielding of beam main bar 3.4 Crack Distributions in a Crack distributions in a joint at yielding of beam main bar were shown in Fig.8. It can be seen that the analysis using the smeared crack model was capable of satisfactorily evaluating the beam flexural cracking, column flexural cracking, and joint shear cracking. 3.5 Stress Contours of Concrete Figure 9 shows the compressive principal stress contour on the perpendicular cross-section of the joint. Note that when R=1/400 rad, the compressive principal stress for specimen spread across a wide range, since specimen had a greater shear input than specimens and. For specimen, the beam ends were subjected to greater stress due to bond degradation as deformation progressed. However, since the beam main reinforcements yielded at an early stage, stress onto the joint was small, resulting in crushing in the beam ends. R=1/400rad R=1/130rad R=1/100rad R=1/75rad R=1/63rad Figure 9. Minimum principal stress in joint vertical section

8 In specimen, as the deformation progressed, the concrete compression region expanded as a result of bond degradation, reducing the distance between the centers of compression and tension in the beam and increasing the damage in the joint. Since specimen had poor bonding, at a given drift angle, less Story drift angle ( 10-3 rad) shear force due to a truss mechanisms was acting on the joint Figure 10. shear force and story drift angle relations than in specimen. Stress transmission, principally due to strut mechanisms concentrated in a narrow region within the joint. Although there was an increase in the shear force applied to the concrete after bond degradation, since a smaller amount was inputted into the joint, the shear force was primarily concentrated in the beam ends. Bond degradation caused crushing of concrete at ends of RC members and pinching of the hysteresis profile, thereby reducing the energy absorbing capacity of RC members and making realistic design difficult. For this reason, sufficient care must be taken to prevent crushing in an instance in which high strength reinforcements are used. 3.6 Input Shear Force Story Drift Angle Relationships input shear force (kn) Figure 10 shows the joint input shear force story drift angle relationships. The joint input shear force was obtained from the net force of integral values of the concrete shear force generated at the height of the center of the panel, and the bonding force was obtained from the difference of stresses in the beam main bar at the both beam critical section. It can be seen that the burden on concrete increases due to bond degradation as deformation progresses. 3.7 Accumulated Consumption Strain Energy Input Shear Force() Input Shear Force() Input Shear Force(BH-LS) Bond Force() Bond Force() Bond Force (BH-LS) Shear force affected by concrete The strain energies in the concrete elements were calculated for each integration point. The accumulated consumption strain energy for the RC was quantitatively evaluated by adding reinforcement elements to the energy of the concrete elements. Figure 11 shows the proportion by which the accumulated consumption strain energy is shared between different members. The proportion of energy burdened on the column is substantially uniform between all specimens. In specimen, in which the shear input is larger, as deformation progresses after main reinforcement yield, the proportion of energy burdened by the joint predominates, demonstrating that joint failure has occurred. In specimen, the proportion Main reinforcement of Beam yielding 100% 80% 60% 40% 20% Column Bond in joint Bond in beam Beam Main reinforcement of Beam yielding Column Bond in joint Bond in beam Beam Main reinforcement of Beam yielding Column Bond in joint Bond in beam Beam 0% Figure 11. Ratio of accumulated consumption strain energy of each member
9 burdened by the joint after the main reinforcement yield does not change significantly, and the proportion burdened by the column increases. In specimen, neither the proportion burdened by the joint nor that burdened by the column change significantly. There is a moderate increase in the proportion burdened by the joint at large deformations. The results described above demonstrate that the analytical and experimental results generally correspond well in relation to the state of damage and the failure mode. Table 4 shows the proportion by which the accumulated consumption strain energy is shared in specimens and at the point of main reinforcement yield. As shown, it can be seen that the proportion by which the accumulated consumption strain energy due to joint bonding and column bonding is shared is similar between specimens and at the point of main reinforcement yield. Table 4. Ratio of accumulated consumption strain energy Specimens Column Beam Bond in beam Bond in joint 17% 42% 4% 20% 17% 7% 51% 5% 21% 16% 4. CONCLUSIONS In this study, non-linear analyses using a three-dimensional finite element method (3-D FEM), which is very useful to get the rational solution of 3-D stress conditions, were carried out in order to understand the relationships between input shear forces and bond conditions of beam main bars of RC interior beam-column joints. From the detailed investigations, the following conclusions can be made: (1)As for the relationships between story shear force and story drift angle, FEM analytical results gave a good agreement with experimental stiffness, maximum story shear force, hysteresis loops and failure modes. (2)Strain distributions of beam main bars though a joint were accurately evaluated by considering appropriate analytical bond models. (3)Average bond stresses of beam main bars though a joint were decreased by the developments of flexural cracks in a column. It will be caused by the deteriorations of concrete confinement effects at the tensile zone in a joint. (4)Effects of input shear force and bond conditions to stress transfer mechanisms in a joint were analytically discussed by compressive principal stress contours of concrete. (5)Accumulated consumption strain energy of each member in beam-column joints was considered in order to investigate the failure process. ACKNOWLEDGEMENT We are grateful to Prof. Hayashi S. of Tokyo Institute of Technology in Japan and Prof. Kamimura T. of Shibaura Institute of Technology in Japan for providing the precious experimental data. REFERENCES Sawada, K., Kishimoto, N., Hayashi, S. and Kamimura, T. (2006). Influence of joint shear force and bond index on bond behavior of beam bars in joint. Proc. of the Japan Concrete Institute. 28:2, (in japanese). Yu, Y., Kashiwazaki, T. and Noguchi, H. (2005). 3-D FEM analysis of seismic performance evaluation of RC columns subjected to reversed cyclic shear. Proc. of the Japan Concrete Institute. 27:2, (in japanese). Hong, J., Kashiwazaki, T. and Noguchi, H. (2009). Study on shear strength of RC beam-column joints by 3-D
10 FEM analysis. Proc. of the Japan Concrete Institute. 31:2, (in japanese). Kashiwazaki, T. and Noguchi, H. (2008). Blind analysis of RC beam-column joints subjected to multi-axial combined loadings using 3D nonlinear FEM. Fourteenth World Conf. on Earthquake Engineering. Paper No , 6pps. Noguchi, H., Kashiwazaki, T. and Hong, J. (2008). FEM analysis of three-dimensional interaction of RC frames subjected to multi-directional cyclic loading, Fourteenth World Conf. on Earthquake Engineering. Paper No , 8pps.