Abstract. Bulb Tee girders provide a practical, efficient means of spanning the large
|
|
|
- Aubrey Atkins
- 5 years ago
- Views:
Transcription
1 Abstract LACKEY, PAUL E. An Investigation of Bridge Deck Overhang Falsework Systems Installed onto Bulb Tee Girders. (Under the direction of Dr. Emmett Sumner.) Bulb Tee girders provide a practical, efficient means of spanning the large distances required in today s bridge designs by utilizing large moments of inertia to withstand the massive moments created in the spans. A bulb tee girder possesses a wider, thinner top flange than conventional precast concrete cross-sections. Previous research suggests the thin top flange of an exterior bulb tee girder in the bridge deck overhang falsework system to fail in punching shear and concrete bearing/spalling at premature loads. Meadow Burke Products, Inc. has manufactured an innovative falsework hanger for use with thin flange girders such as the bulb tee. The hanger utilizes a bearing plate to distribute the vertical loads on the top flange. Experimental full scale testing of the innovative hanger on a bulb tee girder was completed as the first phase of this study. The hangers were installed onto a 63 in. North Carolina Department of Transportation (NCDOT) Modified Bulb Tee (MBT) girder and loaded by a hydraulic load cylinder at a 45 degree angle. The behavior and ultimate strength of the hanger and top flange of the girder were recorded. Phase two of the experimental study consisted of testing the overhang falsework system with support brackets attached to the Meadow Burke hangers. The support brackets were loaded vertically utilizing hydraulic load cylinders. The load distribution behavior of the bracket and ultimate loading capacity of the system were recorded. Both phases of the experimental study concluded that a punching shear failure will occur in the top flange of the girder at a consistent loading.
2 Subsequent analytical studies were carried out in an attempt to predict and emulate the results seen in the experimental testing. The analytical study consisted of finite element models and ACI code provisional analysis for punching shear. The finite element models developed are able to accurately predict the behavior and ultimate strength of the system. ACI code for punching shear does not accurately predict the punching shear capacity of the MBT girder flange.
3
4 Dedication This thesis is dedicated to my parents. Without their love, support, and encouragement it would not not been possible to achieve my goals. ii
5 Biography Paul Lackey was born on February 23, 1983 and raised in Pfafftown, NC. He attended North Forsyth High School and graduated in In 2001, he enrolled at North Carolina State University where he graduated in 2005 with a Bachelor s of Science degree in Civil Engineering. He continued his academic pursuits in 2005, enrolling into the graduate school at NCSU to obtain a Master of Science degree in Civil Engineering. Upon completion of an M.S. degree Paul plans to continue to work towards a Professional Engineer s license. Paul is a registered E.I.T. in the state of North Carolina. iii
6 Acknowledgements I would like to acknowledge Meadow Burke Products, Inc. for providing the funding and support for this project. I would like to thank my advisor and committee chair, Dr. Emmett Sumner, for his guidance and support throughout the completion of my graduate studies. The opportunity to work on this project with him is greatly appreciated. Thanks go for all of the wisdom, support, and encouragement he provided. Also I would like to thank Dr. James Nau and Dr. Sami Rizkalla for kindly serving as members of my advisory committee. I would like to thank fellow graduate student Chemin Lim for his assistance through the completion of the laboratory testing. His hard work and dependability are greatly appreciated. I would like to thank the staff at the CFL for their assistance throughout the completion of the project; Jerry Atkinson, Lee Nelson, and Amy Yonai. I would like to thank God for providing the strength and ability to complete this accomplishment. iv
7 Table of Contents List of Tables.... vii List of Figures..viii PART I INTRODUCTION/BACKROUND 1. Introduction Background Bridge Deck Pouring Process Overhang Falsework System Components Purpose of Study Objectives Scope Contents of Thesis Literature Review Overview Related System Behavior Punching Shear Flexure in Slabs Punching Shear vs. Flexural Behavior Girder Torsion and Eccentric Loading Bridge Overhang Falsework System Research Current Code Provisions Punching Shear ACI Code Torsion ACI Code Manufacturer Testing Need for Research PART II JOURNAL PAPER II.1. Introduction/Background.. 20 II.2. Experimental Study II.2.1 Introduction to Test Program. 24 II.2.2 Test Specimens II.2.3 Test Setup II.2.4 Test Procedure II.2.5 Experimental Test Results.. 34 II.3. Analytical Study.. 41 II.3.1 Overview II.3.2 Code Provisional Study.. 41 II.3.3 Finite Element Modeling v
8 II.4. Conclusions/Recommendations. 49 II.5. REFERENCES Part III SUPPLEMENTAL DETAILS III.1 Analytical Investigation Details III.1.1 Overview III.1.2 Finite Element Study. 51 III.1.3 ACI Code Provisional Study. 60 III.1.4 Bracket Load Distribution Analysis. 64 III.1.5 Hanger Behavior Analysis III.1.6 Analytical Investigation Conclusions III.2 Tension Tie Bar...73 III.2.1 Introduction to Future Research 73 REFERENCES. 75 APPENDIX A 6m-1-M Test Summary Sheets APPENDIX B 9m-1-H Test Summary Sheets APPENDIX C 9m-2-M Test Summary Sheets APPENDIX D 12m-1-H Test Summary Sheets APPENDIX E 12m-2-M Test Summary Sheets 107 APPENDIX F 6m-HF85-OL-4 Test Summary Sheets. 115 APPENDIX G 6m-HF85-OI-4 Test Summary Sheets APPENDIX H 9m-HF96-OL-6 Test Summary Sheets 134 APPENDIX I 9m-HF96-OI-5 Test Summary Sheets APPENDIX J 12m-HF96-OL-5 Test Summary Sheets APPENDIX K 12m-HF96-IL-5 Test Summary Sheets APPENDIX L ANACAP A-12m-H Test Summary Sheets. 174 APPENDIX M ANACAP A-12m-M Test Summary Sheets 179 APPENDIX N ANACAP A-6m/9m-H Test Summary Sheets APPENDIX O ANACAP A-6m/9m-M Test Summary Sheets vi
9 List of Tables Part II Table II.2.1 Phase I Test Parameters..25 Table II.2.2 Phase II Test Parameters.25 Table II.2.3 Experimental Test Program Results 35 Table II.3.1 Experimental vs. ACI Predicted Punching Shear Strength. 43 Part III Table III.1.1 ANACAP Test Matrix Table III.1.2 ANACAP Results Summary.. 59 Table III.1.3 Estimation of Punching Shear Values...64 Table III.1.4 Sample Load Component Data.. 66 Table III.1.5 Percent Difference between Static Analysis and Measured.. 66 Table III.1.6 First Yield Summary for Vertical Deflection Behavior. 70 Table III.1.7 Hanger Horizontal Displacement Values.. 71 vii
10 List of Figures Part I Figure 1.1 Formwork for a Bridge Deck Figure 1.2 Screed Frame... 3 Figure 1.3 Screed Runner. 3 Figure 1.4 Bridge Deck Overhang Falsework System Components 4 Figure 1.5 Hanger Attachment Methods for Concrete Girders. 5 Figure 1.6 Illustration of Torsion on Exterior Girders.. 7 Figure 1.7 Tie Bar Location within Overhang Falsework System... 7 Part II Figure II.1.1 Components of Bridge Overhang Falsework System 21 Figure II.2.1 6m Hanger Details. 26 Figure II.2.2 9m Hanger Details.26 Figure II m Hanger Details Figure II.2.4 Attachment of Hanger Figure II.2.5 Meadow Burke HF-85 Bracket.. 28 Figure II.2.6 Meadow Burke HF-96 Bracket.. 28 Figure II.2.7 Dimensions and Reinforcement of a NCDOT 63 MBT Girder...29 Figure II.2.8 End Supports of the Support/Brace System Figure II.2.9 Details of the loading system for Phase I Tests. 31 Figure II.2.10 Details of the loading system for Phase II Tests.. 32 Figure II.2.11 Bracket Load Components Figure II.2.12 Typical Failure Sequence.37 Figure II.2.13 Flexural Crack and Spalling of Concrete.38 Figure II.2.14 Ultimate Punching Shear Failure. 38 Figure II.2.15 Typical Vertical Flange Displacement Plot. 39 Figure II.3.1 Model Area Figure II.3.2 Rebar Pattern, Loading Components, Dimensions Figure II.3.3 ANACAP Crack Potential Contour at Approximately 6,000 lbs.. 47 Figure II.3.4 ANACAP Deflection Results vs. Full Scale Test Results. 48 Figure II.3.5 ANACAP Strain Contour at Critical Load 48 Part III Figure III.1.1 ANACAP Stress Capacity across an Open Crack 53 Figure III.1.2 Stress-Strain Curve of 270 Grade, 7-wire LF Prestressing Strand Figure III.1.3 Prestressing Reinforcement Bi-linear Representation.. 55 Figure III.1.4 ANACAP Model Area.56 Figure III.1.5 Model Dimensions and Rebar Layout.. 57 Figure III.1.6 Boundary Conditions of ANACAP Model...57 viii
11 Figure III.1.7 A-12m-H Crack Pattern at 6,900 lb. Applied Vertical Load Figure III in. Thick top flange ANACAP Model 60 Figure III.1.9 ACI Method for Punching Shear Perimeter. 61 Figure III.1.10 Measured Punching Shear Cone Figure III.1.11 Bracket Lifting Behavior 65 Figure III.1.12 Moment Summation Location 66 Figure III.1.13 Alternative Moment Summation Location. 67 Figure III.1.14 Hanger Behavior Analysis Description.. 68 Figure III.1.15 Bearing Plate Analysis Location 69 Figure III.1.16 Dimensions of Hanger Bending Plate Analysis. 70 Figure III.1.17 Horizontal Displacement Behavior 71 ix
12 AN INVESTIGATION OF BRIDGE DECK OVERHANG FALSEWORK SYSTEMS INSTALLED ONTO MODIFIED BULB TEE GIRDERS 1.1 Background PART I CHAPTER 1 INTRODUCTION Properly designed bridge deck overhang falsework systems are essential to the safe construction and proper functionality of any bridge construction project. A bridge deck is the concrete driving surface poured approximately one foot thick directly over top of the steel or concrete girders. To efficiently utilize the strength of the concrete deck and girders, the exterior girders are positioned to provide a deck overhang which typically varies from 27 in. to 57 in. During placement of the deck concrete, the plastic concrete requires temporary formwork to support it until it has time to cure. To form the sections in between adjacent girders, stay-in-place (S.I.P) steel deck forms are typically installed. The S.I.P. forms are permanent throughout the life of the bridge. For the bridge deck overhang at the two exterior girders, a bridge deck overhang falsework system is used. The system is responsible for supporting the plastic concrete, screed loads, and other live load such as construction workers during construction of the bridge deck. The system is removed after the curing of the concrete. Figure 1.1 shows the cross section of a bridge, giving an explanation of the different formwork required to form the bridge deck. 1
13 Utilizes Overhang Falsework Bridge Deck Utilizes S.I.P. Forms Figure 1.1: Formwork for a Bridge Deck 1.2 Bridge Deck Pouring Process The top surface of a concrete bridge deck is shaped using a piece of machinery known as a screed. The screed is made up of a frame which spans the entire roadway width of the bridge and a runner which travels back and fourth laterally along the frame. The frame is preset to the required crown and super elevation of the bridge roadway. As the concrete is pumped onto the bridge deck, the runner travels back and forth along the frame to shape the deck while the entire frame is gradually navigated longitudinally down the bridge. Screeds run along screed rails which are supported by the overhang falsework system. Figure 1.2 illustrates a typical screed frame used in the concrete deck pouring process. Figure 1.3 illustrates the screed runner which travels along the screed frame as the concrete is pumped from the truck. 2


14 Frame Rail Figure 1.2: Screed Frame Runner Figure 1.3: Screed Runner 1.3 Overhang Falsework System Components The vertical loads on the overhang falsework system during the construction of the deck are typically supported by the exterior girder through an attached hanger as 3
15 illustrated in figure 1.4. Attached to the hanger by a coil rod is a bracket which provides the lateral length support required for the concrete deck as well as a temporary construction walkway and a screed rail used throughout the deck curing process. Between brackets, timber joists are installed to create the load supporting surface. Walkway/Rail Screed Rail Concrete Deck Slab Hanger Formwork Bracket Figure 1.4: Bridge Deck Overhang Falsework System Components The method of attaching the hanger to the girder varies by girder type. For steel girders two methods of attachment can be used: welding or clamping. For concrete there are also two main attachment options: a through flange method, or an edge of flange method (see figure 1.5). An edge of flange hanger is either cast into the girder during its production, or is attached to an anchor that is cast into the girder during production. 4
16 a) Edge of Flange Hanger b) Through Flange Figure 1.5: Hanger Attachment Methods for Concrete Girders Eccentric loading from the falsework system creates torsion on the exterior girder. In order to counter balance the torsional effect, a series of tie bars and struts are typically used between the exterior and adjacent girder. A tension tie bar runs laterally from the top of the exterior girder to the top of the adjacent girder overtop of the S.I.P. forms. A compression strut is then typically installed diagonally between the two girders to resist the torsional effect. Other brace patterns could also be used dependant upon expectant rotational forces and preference of the design engineer. 1.4 Purpose of Study An adequate, economically designed overhang falsework system is important to not only save money and materials, but also to prevent the possibility of human injury. The purpose of the presented research project, funded by Meadow Burke Products, Inc., is to take needed steps to ensure that bridge deck overhang falsework systems installed onto bulb tee girders are safe and economical. 5
17 Bridge deck overhang falsework systems require three main load components as previously described: hanger, bracket, and timber flooring. The ultimate load behavior of the bracket and timber flooring can be obtained through analytical and experimental testing and will be consistent for the configuration in use with any girder type. The hanger however will provide varying system strength depending on the girder type it is to be used with. Precast bulb tee bridge girders are becoming increasingly popular for use in bridge designs across the nation due to their ability to provide a resourceful, effective means of spanning large roadway distances by utilizing designs which develop large moments of inertia. The design of a bulb tee girder differs from a traditional tee beam by the presence of a pentagonal shaped base and a tapered top flange. A typical bulb tee girder has a top flange thickness of anywhere from 2 ½ to 5 inches. This thin top flange creates the potential for an unexpected punching shear failure. Meadow Burke Products, Inc. has recently developed an innovative edge of flange hanger type that was designed for use on thin flange girders such as the bulb tee. The hanger utilizes a load distribution bearing plate and a threaded rod attachment to transmit the falsework bracket forces to the girder. Since the hanger is newly developed, the behavior of the hanger must be investigated in the laboratory. It is vital to the proper functionality of overhang falsework systems that the outside girder torsion be minimized. Excessive torsion in the outside girder can result in too little concrete cover over top deck slab reinforcement as well as concrete leakage through the formwork (AASHTO, 1996). Figure 1.6 illustrates how the torsional forces are developed in the girder by the eccentric loading on the bracket from the plastic 6
18 concrete, screed load, and construction workers. Figure 1.7 shows the location of the tie bar with relation to the overhang falsework system. Figure 1.6: Illustration of Torsion on Exterior Girders Tie Bar Bridge Deck Compression Struts Figure 1.7: Tie Bar Location Within Overhang Falsework System 1.5 Objectives The primary objective of this study is to investigate the behavior and ultimate strength of three Meadow Burke hangers, two Meadow Burke support brackets, and the bulb tee girder flange as the elements function within the bridge deck overhang falsework system. 7
19 In addition, an introductory examination into the behavior of the torsion resisting tension tie bar, which ties the exterior girder to the adjacent interior girder, will be made. The study consists of a preliminary literature review and system investigation for a future research project. The project will attempt to determine the importance and behavior of the tie bar in the overhang falsework system. 1.6 Scope The objectives are to be met through the completion of the following tasks: 1. A thorough investigation of current and past literature with relevance to any behavioral aspect of the bridge overhang falsework system. 2. Experimental full scale testing of falsework hangers installed onto bulb tee girders. 3. Experimental full scale testing of falsework hangers with attached brackets installed onto bulb tee girders. 4. Analytical models representing the hanger system installed onto the flange of a bulb tee girder. 5. Preliminary investigation into the behavior of the torsion resisting tension tie bar 1.7 Contents of Thesis This thesis is comprised of three primary parts. Part I presents an overview of the research study with a thorough literature review of topics related to falsework system behavior in chapter 2. A brief introduction to tension tie bars is also included. Part II contains a paper developed for submittal to the PCI journal. Part III provides a technical summary of the experimental and analytical investigations with comprehensive example 8
20 calculations. The last section of the report consists of an appendix, with detailed summaries of each of the experimental tests and finite element models. 9
21 CHAPTER 2 LITERATURE REVIEW 2.1 Overview A thorough literature review revealed little applicable research on the topic of overhang falsework systems. No outside research has been discovered related to falsework hangers installed onto bulb tee girders. A study by Ariyasajjakorn and Sumner (2006), North Carolina State University, is the only known overhang falsework system testing with direct applicability to the overhang falsework system behavior studied as a part of this research project. Other related falsework system behaviors such as punching shear, flexure, and torsion have been widely researched and documented. This chapter will describe system behaviors, previous related research, current code provisions, and manufacturer testing. 2.2 Related System Behavior Punching Shear Punching shear is a phenomenon widely researched and documented because of its significance to most any structure containing loaded thin concrete elements. The most common occurrences of punching shear are in concrete structures containing two way concrete slab floors that support columns. In bridge deck overhang falsework systems punching failure could potentially occur at the location of the hanger on the bulb tee girder flange. Punching shear behavior of slabs is typically studied in relation to slab-column connections. The column size and location within the slab affects the punching shear behavior and strength of the slab. A load located in the interior of a slab would provide 10
22 the most shear strength due to the presence of effective shear resisting concrete on the entire perimeter. Edge or corner locations of the load would provide less punching shear strength due to less perimeter concrete providing punching shear resistance. For falsework hangers installed on the flange of the bulb tee girder, the load will be taken as edge loading with three of four sides of the perimeter available for resisting the punching shear failure. Typically edge loaded slabs failing in punching shear result in a triangular shaped cone. Sherif et al. (2006) describes punching shear as a topic covered extensively by many researchers, but one that still has no complete and satisfactory theory. In their study they look at the effects of column dimensions on the punching shear strength of edge column-slab connections. Five half scale models consisting of typical flexural reinforcement were tested. The researchers tracked the crack patterns, deflection, reinforcement strain, and ultimate loads. Ultimate loads were compared to the ACI Code provisions detailed in section 2.4, and proved the code to be conservative for this type of punching shear failure. The code was also proven to overestimate the effects of the width/length ratio of the column on the ultimate punching shear strength. Mitchell et al. (2006) performed a series of studies evaluating several punching shear test results and their relation to current code provisions, paying special attention to the effects of the size, geometry, and material properties on the punching shear capacity. It was concluded in the study that the shear stresses at punching failure decrease with an increasing effective slab depth. The size effect of the slab was found significant and its inclusion was recommended in code design equations. Size effects are not included in the ACI code for punching shear in two way slabs. 11
23 Bazant et al. (1987) conducted a series of punching shear tests in an attempt to distinguish the effects of the size of geometrically similar reinforced concrete slabs on the ultimate strength. Nine different tests were carried out with three different size slabs 1, 2, and 4 in. in depth. Each slab was reinforced fully for flexure, but no stirrups were added to assist with shear failures. These primary relevant conclusions were made from the testing: 1) the punching shear tests of geometrically similar concrete slabs of different sizes indicate size effects exist, 2) the larger the slab thickness, the steeper the post-peak decline of the load-deflection diagram; the punching shear behavior of thin slabs is closer to plastic, and that of thick slabs is closer to linear elastic fracture mechanics, 3) additional testing should be carried out to verify the limited testing completed as a part of this study Flexure in Slabs Cracking of an element under flexure occurs at the location of maximum moment and can be controlled by the addition of flexural reinforcing steel or other more innovative forms of flexural strengthening. A Bulb Tee girder contains no flexural reinforcement in the vicinity of the flange in which the falsework hanger failure is expected to occur. For this reason a flexural failure and subsequent flexural cracking is expected on the underside of the flange, at the centerline of the load point Punching Shear vs. Flexural Behavior Research has discovered the effects of flexural behavior on the punching shear strength to be significant. Richart (1948) discovered that cracks created by flexural failure will reduce the overall concrete area resisting the shear. A decrease in the area 12
24 will decrease the ultimate punching shear capacity of the specimen. A larger crack creates a smaller effective punching shear resisting area. Therefore, Richart concludes that the addition of flexural reinforcement steel to control the crack size will in turn increase the overall punching shear capacity. Menetrey (1998) carried out a study in an attempt to clarify the relationships between flexural and punching shear failure. The punching tests were performed on octagonal slabs supported by rectangular hollow steel tubes. Load was applied at the center using a circular steel column and controlled by the vertical displacement of this column. Menetrey established the difference between the two failure modes as follows: 1) a flexural failure is due to formation of a yield-line mechanism; a punching failure is due to formation of a punching cone, 2) the load-carrying capacity is progressively reduced after flexural failure and is suddenly decreased after punching failure. The tests expose a transition between punching and flexural failure, controlled by the punching crack inclination. An interaction formula describing the flexural strength vs. punching crack inclination has been proposed as a result of the study. Dilger et al. (2005) have studied and conglomerated the results of several studies in relation to flexural behavior on punching shear capacity. A distinct decrease in ultimate shear capacity has been discovered with a decreasing flexural reinforcement ratio, particularly when the ratio reaches the point of ineffectiveness against controlling flexural cracking. Controlled flexural cracking increases the punching shear capacity by increasing the overall area of concrete resisting the shear stresses. Yield behavior of the reinforcing steel plays an important role in determining the size of the flexural cracking and in turn the effective shear resisting concrete area. Effects of reinforcement steel 13
25 yielding are negligible if punching failure occurs prior to the steel reaching yield because the steel behavior would not be a factor in the size of the crack Girder Torsion and Eccentric Loading Torsion of an exterior bridge girder is caused by the eccentric loading of the deck overhang. Eccentric loading is a load which is not applied at the shear center. For a beam shape with a vertical line of symmetry, the shear center will always lie on that lie. For non symmetrical shapes, the shear center would be located at various locations. The torsion behavior explanation and literature review has been divided into two different parts, concrete and steel girders, due to the intricacy of behavior of the two. Torsion behavior of prestressed concrete girders is difficult to characterize due to the changing effects of torsion with geometrically diverse girders. Zararis et al. (1984) devised an experimental investigation studying the ultimate torsion capacity of reinforced concrete T-beams with reinforced flanges. The purpose of the study is to determine the effects the reinforced flanges might have on the overall torsion strength of the beam. The test specimens consisted of 82 beams of four different shapes: rectangular, T-Beam with slab width 40, T-beam with slab width of 70, and T-beam with slab width of 100. All beams were loaded under combined torsion and bending. The study concludes with evidence of the reinforced flanges contributing to the torsional capacity of the T-beams, especially in cases where the torsional behavior prevails over the bending behavior. 14
26 2.3 Bridge Deck Overhang Falsework System Research As mentioned, little research has been found on the topic of bridge overhang falsework systems. The discovered research presented has various degrees of relevancy to this report. Liu et al. (1999, 2002) have completed a series of evaluations for KDOT on the bridge deck overhang system and the torsional behavior of the exterior girder during the loading process. A report presenting data collected from field analysis of exterior steel girder torsion behavior has been developed. A software program, TAEG (Torsional Analysis of Exterior Girders), has also been developed which analyzes the torsion behavior of the exterior girder within the system. The software allows for the inclusion of the torsion resisting tie rods and blocking, and any present diaphragms. It provides the user with the top and bottom flange stresses as well as forces within the bracket and diaphragms. They have also investigated the effects of dynamic loads such as impact and workers and found them to be negligible on the overall behavior of the system. An extensive study has been carried out, by Hadipriono et al. (1986), of 85 major falsework collapses of bridges and buildings in the past 25 years. Of the 85 collapses, 42% were from bridge falsework failures with approximately half of those occurring during the pouring of the concrete. The average span length for the tested bridges was 150 feet with a test range from feet. The majority of the enabling failure types occurred as a result of inadequate falsework cross-bracing, inadequate falsework components, or inadequate falsework connections. The primary conclusions to this study point out the necessity for more attention given to falsework design review and an emphasis on understanding the importance of the technical problems involved. 15
27 A study currently in progress at the University of Texas-Center for Transportation Research, funded by the Texas Department of Transportation, focuses on the long term effects of overhang falsework systems. It has been discovered that girder rotation and deformation from the faslework system loading can become permanent in the girder once the deck has cured. The research will attempt to characterize the behavior of the system in order to prevent the unexpected geometric change in the bridge girder system. Potential accidents from unwanted system distortions will be prevented. The study will primarily consist of field work and finite element models. A previous full scale testing procedure completed by Ariyasajjakorn and Sumner (2006) at the North Carolina State University Constructed Facilities Laboratory provides evidence that a thin flanged girder does not provide the required strength for development of ultimate falsework hanger loading. Falsework hanger tests show that a punching shear or bearing failure will occur in the flange of the girder at relatively early loading stages, especially in hanger types which do not experience significant head rotation. Limited testing of falsework brackets provides evidence that elementary engineering statics applies for the determination of the load components on the falsework hangers. 2.4 Current Code Provisions Punching Shear ACI CODE For nonprestressed slabs and footings, expected ultimate punching shear load equations from the ACI Code section are given below in U.S. customary units. The ultimate punching shear strength, V c, is the lesser of: 16
28 Vc 4 = (2 + ) f ' cbod Equation (2.1) β α sd Vc = ( + 2) f ' cbod Equation (2.2) bo V f b c = 4 ' c 0d Equation (2.3) where, V c = the predicted punching shear capacity β c = unit-less ratio of the length of the long side of the loading plate to the short side of the loading plate f c. = the compressive strength of the concrete in pounds per square inch b = the perimeter of the critical section assumed at a distance d/2 from the perimeter of o the loading plate d = the effective depth of the concrete slab α s = constant taken as 40 for interior loads, 30 for edge loads, and 20 for corner loads The ACI Code does not take into account the effects of flexural reinforcement ratios or size effects of the slab and is essentially a function of the concrete strength and the effective area of the expected punching shear behavior. According to ACI the effective area of interior loading shall be calculated by assuming a perimeter d/2 from the column face, where d is the depth of the slab Torsion ACI CODE ACI section 11.6 bases the design for torsion of concrete beams on a thinwalled tube, space truss analogy. The theory is based on the idea that once torsional cracking has occurred, the concrete in the center of the member has little effect on the torsional strength of the cross section and can be ignored. After the beam has cracked, 17
29 the effective tube can be evaluated as a space truss consisting of closed stirrups, longitudinal bars in the corners, and concrete compression diagonals centered on the stirrups. For prestressed members the maximum factored torsional moment, T u, shall be permitted to be reduced to: T u 2 Acp f pc = φ 4 f ' c ( ) 1+ Equation (2.4) p 4 f ' cp c where, φ = strength reduction factor f c. = specified compressive strength of concrete A cp = area enclosed by outside perimeter of cross section p cp = outside perimeter of the concrete cross section f pc = compressive stress of concrete due to effective prestress at the centroid of the section 2.5 Manufacturer Testing Limited manufacturer testing information has been discovered for the falsework hangers tested as a part of this study due to the fact that the tested hangers are somewhat in the developmental phase. A small number of tests were found which investigated other cast-in edge of flange falsework hanger types, but testing procedures invalidate applicability to this testing program. It should however be noted that previous falsework hanger manufacturer testing has brought about a minimum recommended concrete depth of 5 in. for development of recommended ultimate hanger loads. For slab depths less the 5 in., it is recommended that service loads be reduced by up to 50 percent. 18
30 2.6 Need for Research The lack of research in the field of bridge deck overhang falsework systems installed onto thin flanged girders is the basis for the inspiration of the presented study. As proven by a thorough literature review, the system behavior as well as ultimate loading capacity is relatively unknown. Two key elements of the system, the hanger strength on the thin flange and the tension tie bar effectiveness, are two key elements to creating a safe and economical overhang falsework system design. The research presented in this thesis will describe the behavior of the bulb tee girder flange, and its capacity in the overhang falsework system. A future study, beginning within the next year, will attempt to describe the behavior and functionality of the tension resisting tie bar. 19
31 PART II EXPERIMENTAL INVESTIGATION OF BRIDGE OVERHANG FALSEWORK BRACKETS AND NEWLY DEVELOPED FALSEWORK HANGERS INSTALLED ON MODIFIED BULB TEE (MBT) GIRDERS Paul E. Lackey, E.I.T. Emmett A. Sumner, Ph.D., P.E. CHAPTER II.1 INTRODUCTION/BACKGROUND Precast bulb tee bridge girders are becoming increasingly popular across the nation due to their ability to provide an efficient and cost effective means of spanning large distances. The configuration of a bulb tee girder differs from a traditional tee beam by the presence of a pentagonal shaped base and a tapered top flange. The unique shape of the cross-section provides a much larger moment of inertia than a traditional tee beam, giving the bulb tee the capability to support the massive loads of long span bridges. In traditional slab on girder bridges, a reinforced concrete deck is cast overtop of a series of bulb tee bridge girders to provide the roadway surface of the bridge. The bridge deck is commonly cast with 2-4 foot overhangs off of the two exterior girders in order to maximize girder utilization. To facilitate construction of the deck overhang, temporary falsework systems are used to support the plastic concrete, deck screed, and construction loads throughout the deck construction process. The bridge deck overhang falsework system is typically attached to the top flange of an exterior bulb tee girder in one of two ways: 1) using a top of flange hanger, 2) using a through flange system. The typical components of the overhang falsework system are illustrated in the cross section shown in figure II.1.1. Top of flange falsework 20
32 hangers used with concrete girders are either installed into the girder flange during production or attached to an embedded anchor which was installed into the girder flange during production. A support bracket is then connected to the hanger using a threaded coil rod angled at approximately 45 degrees. Timber formwork running parallel to the girder spans across the top of the brackets to provide the concrete support surface. Walkway/Rail Deck Screed Support Rail Concrete Deck Slab Top of Flange Hanger Coil Rod Formwork Bracket Figure II.1.1: Components of Bridge Overhang Falsework System (Meadow Burke) The vertical loads from the deck concrete, screed, and construction live loads are distributed from the span created by the timber formwork to the supporting brackets. The bracket loads are then transferred to the girder at two locations. A horizontal component of the load is taken through the bottom of the bracket to a location bearing either on the web or the bottom flange of the girder. The bearing of the bracket on the girder also creates a vertical friction force at this transfer location. A diagonal load component is taken by the coil rod through the hanger and then dispersed through the flange of the girder. This large diagonal component taken by the hanger initiates a vertical load on the thin, lightly reinforced top flange. 21
33 A review of current literature reveals little applicable research published on the topic of bridge overhang falsework systems in use with thin flanged concrete girders. A recent study by Ariyasajjakorn and Sumner (2006) is the only known testing of such systems. In the limited study, two types of top of flange hangers were tested on full scale Modified Bulb Tee (MBT) girders in an attempt to investigate the behavior of the girder and hanger system. It was observed in the study that the system did not reach manufacturer specified ultimate loads due to a punching shear and local bearing/spalling failure in the thin, lightly reinforced top flange. Punching shear strength with relation to flexural behavior has been researched and documented extensively. It has been concluded by Richart (1948), that cracks created by flexural behavior will reduce the overall concrete area resisting a punching failure. This in turn reduces the overall punching shear strength of the specimen. The top flange of the bulb tee girder has no flexural reinforcement in the vicinity of the falsework hanger, meaning any flexural cracking could propagate freely through the flange and reduce the overall punching shear strength. As mentioned, the study performed by Ariyasajjakorn and Sumner (2006) was limited to testing only two types of falsework hangers. No other system components besides the hanger were examined. The study was successful in investigating the performance of the top of flange hanger and the strength of the girder flange, but did not include the use of a bracket. To fully understand the behavior of the overhang falsework system installed on a bulb tee girder, additional research is required utilizing falsework brackets and other types of falsework hangers. 22
34 Full-scale testing and subsequent analytical studies were performed at the North Carolina State University Constructed Facilities Laboratory (CFL) to investigate the strength and behavior of overhang falsework systems installed on bulb tee girders. The full scale testing program, sponsored by Meadow Burke Products, Inc., was conducted in two phases. Phase I testing focused on testing newly developed falsework hangers. Phase II testing focused on testing newly developed falsework hangers installed and tested with overhang support brackets, together as a system. The analytical study included finite element modeling and code provisional studies to further investigate the behavior of the falsework system. The primary objectives of the research program were as follows: Investigate the performance of the newly developed top of flange hangers installed on the bulb tee girder. Investigate the strength and behavior of the thin MBT girder flanges subject to localized loads from top of flange hangers. Investigate the distribution of loads transferred to the girder in MBT overhang falsework systems. 23
35 CHAPTER II.2 EXPERIMENTAL STUDY II.2.1 Introduction to Test Program Five hanger only tests (Phase I) and six hanger/bracket system tests (Phase II) were conducted as a part of this study. The tests were performed with the hangers installed onto the top flange of a 63 in. North Carolina Department of Transportation (NCDOT) Modified Bulb Tee (MBT) bridge girder. The NCDOT MBT girder has an 18 wide tapered top flange that is 3 ½ in. thick at the edge and 5 ½ in. thick at the web. In the first phase of tests, three different hangers were tested in combination with two different girder shear reinforcement ratios, as shown in table II.2.1. In the second phase of tests, variables consisted of three hanger types, two bracket types, two girder shear reinforcement ratios, and three locations of applied loading, as shown in table II.2.1. The three distances of the applied load were chosen to represent a screed rail located at 4, 5, and 6 feet from the outside edge of the top flange. The actual test applied load was placed at 83 percent of the screed rail location to include the effects of the distributed concrete deck load across the entire bracket. Each type of bracket was also inclined at a slope of 9.5 degrees for one test simulating a super elevation of the roadway cross section. Finally, for one test of the HF-96 bracket, the horizontal load element was placed inside the flange at the location where the web meets the top flange. Test ID s for Phase I tests consist of the: hanger type test # shear reinforcement. Phase II test ID s are defined by: hanger type bracket type bracket configuration load location. For example a 6m-1-M test id represents the first hanger only test of a 6m hanger in a mild shear reinforcement location. A 6m-HF85-OL-4 test id 24
36 represents a 6m hanger test with an HF-85 bracket configured outside the flange, level with an applied load location representing a screed rail at 4 foot from the top flange. Table II.2.1: Phase I Test Parameters GIRDER SHEAR TEST ID REINFORCEMENT 6m-1-M Mild 9m-1-H High 9m-2-M Mild 12m-1-H High 12m-2-M Mild Table II.2.2: Phase II Test Parameters TEST ID GIRDER SHEAR REINFORCEMENT BRACKET CONFIGURATION LOAD LOCATION 6m-HF85-OL-4 Mild Outside Flange/Level 3'-3 7/8" 6m-HF85-OI-4 Mild Outside Flange/Incline 3'-3 7/8" 9m-HF96-OL-6 High Outside Flange/Level 4'-11 3/4" 9m-HF96-OI-5 Mild Outside Flange/Incline 4'-1 13/16" 12m-HF96-OL-5 High Outside Flange/Level 4'-1 13/16" 12m-HF96-IL-5 High Inside Flange/Level 4'-1 13/16" II.2.2 Test Specimens Three different hangers manufactured by Meadow Burke Products, Inc. were used in the testing program. Each of the hanger types has a similar geometric shape, but differs in the dimensions of the steel plates which it is comprised. The hangers are designated 6m, 9m, and 12m. Figures II.2.1, II.2.2, and II.2.3 provide the dimensions for each of the three hangers. 25

37 Figure II.2.1: 6m Hanger Details Figure II.2.2: 9m Hanger Details 26


38 Figure II.2.3: 12m Hanger Details All three hangers are top flange hanger types, bolted to an anchor which is cast into the girder during production. The anchor protrudes vertically, 12 from the edge of the top flange. Figure II.2.4 illustrates the attachment of the hanger. Anchor 12 Hanger Top Flange Figure II.2.4: Attachment of Hanger 27
39 Standard Meadow Burke HF-85 and HF-96 brackets were utilized in the second phase of the testing program. The HF-85 and HF-96 brackets are adjustable and can be utilized in a variety of different configurations, some of which were tested in the program. Figures II.2.5 and II.2.6 show the dimensions and cross sections of the horizontal loading element of the HF-85 and HF-96 brackets, respectively. The vertical and diagonal elements of the bracket are adjustable and are configured to accommodate the necessary dimensions. NOTE: Bracket manufactured using structural steel Figure II.2.5: Meadow Burke HF-85 Bracket NOTE: Bracket manufactured using aluminum Figure II.2.6: Meadow Burke HF-96 Bracket 28
40 The 44 ft. long 63 in. NCDOT MBT girder was designed to emulate the stresses at the quarter point of an eighty foot span girder. Standard NCDOT reinforcing and prestressing patterns were utilized. Figure II.2.7 illustrates the dimensions and reinforcing steel layout of the 63 in. NCDOT MBT girder. Figure II.2.7: Dimensions and Reinforcement of a NCDOT 63 MBT Girder II.2.3 Test Setup The test setup consisted of two major systems: the girder support/bracing system and the loading system. The girder support/bracing system was designed to limit movements of the girder to field conditions and remained consistent through Phase I and 29
41 Phase II testing. The loading system was responsible for the load application and was modified slightly to transition from Phase I to Phase II testing. The main responsibilities of the support/bracing system were to support the dead load of the girder, resist torsion, and prevent lateral movements. The system included end supports for the girder as well as lateral and rotational resisting frames within the span. The girder was simply supported on each end with an elastomeric bearing pad and bearing plate positioned on a steel W-section. Lateral and rotational movements of the girder which could occur during testing were resisted using a combination of lateral restraints placed at the top and bottom flanges of the girder. A total of four restraint systems were used. Two of the restraints were located on each end of the girder at the supports. The other two restraint systems were relocated along the span for each test at a spacing of 3 ft. on either side of a test location. Figure II.2.8 illustrates the end support system for the girder. The intermediate support was similar with the primary difference being the removal of the bearing pad and plate. Figure II.2.8: End Supports of the Support/Brace System 30
42 Loading was applied through the use of hydraulic jacks for both testing phases. For the Phase I tests, loads were applied at a 45 degree angle by a single hydraulic jack directly to the hanger using a clevis system attached to a coil rod. An illustration of the hanger only system in figure II.2.9 shows the location of each component of the Phase I loading system. In the Phase II testing a vertical load was applied to the bracket using two hydraulic jacks, one on each side of the bracket. A HSS 3x3x5/16 beam spanned the top of the bracket and two eye rods were used to attach the hydraulic jacks to the beam. Figure II.2.10 illustrates the components of the loading system for the Phase II testing. Figure II.2.9: Details of the loading system for Phase I Tests 31
43 (a) Side View of loading system for Phase II Tests (b) Front View of loading system for Phase II Tests Figure II.2.10: Details of the loading system for Phase II Tests II.2.4 Test Procedure After installing the end supports for the girder and setting the girder into place, the girder was white washed to aid viewing of tensile cracking in the concrete. The hangers were also white washed and then bolted to the anchors protruding from the top 32
44 flange of the girder. The loading system and bracing were then moved into place and the instrumentation was connected to a PC Controlled Data acquisition system, calibrated, and installed to the test setup. A preload of approximately 10% of the expected ultimate load was then applied to check the instrumentation and seat the specimen. The loading sequence consisted of three loading cycles: to half the manufacturer s working load, to the working load, and to the ultimate load. In some cases the cycles were not completed due to premature failures occurring in either the bracket or girder flange. The loading process was complete when a failure occurred as indicated by the inability of the specimen to sustain additional load. Data points from the instrumentation were recorded at a rate of approximately one point per second by the data acquisition system. The behavior and loading limitations of the bulb tee girder, hanger, and bracket were of interest throughout the testing to provide the required data to conclude the objectives of the study. The behaviors of each were monitored using a series of load cells, string potentiometers, and linear potentiometers. String and linear potentiometers monitored the deflections of the test components. Load cells were used to track the applied load for both Phase I and Phase II tests. For the Phase II testing, additional load cells were used to measure the load distribution of each load component within the bracket. Figure II.2.11 describes the three load components within the bracket measured for load distribution analysis. 33
45 Figure II.2.11: Bracket Load Components II.2.5 Experimental Test Results The results of the full scale testing program are summarized in table II.2.3. Included in the table is the test description, ultimate load on the hanger, and a description of the type of failure. 34
46 Table II.2.3: Experimental Test Program Results Ultimate Load Test ID Test Description on Hanger Failure Type 6m-1-M 6m Hanger 11,000 lbs Girder Flange Punching Shear, Significant Hanger Deflection 9m-1-H 9m Hanger 5,000 lbs No failure, Hanger Deflection 9m-2-M 9m Hanger 11,200 lbs Girder Flange Punching Shear, Significant Hanger Deflection 12m-1-H 12m Hanger 14,500 lbs Girder Flange Punching Shear 12m-2-M 12m Hanger 12,000 lbs Girder Flange Punching Shear 6m-HF85- OL-4 6m-HF85- OI-4 9m-HF96- OL-6 9m-HF96- OI-5 12m-HF96- OL-5 12m-HF96- IL-5 6m Hanger w/ HF-85 Bracket outside flange/level, screed at 4' 6m Hanger w/ HF-85 Bracket outside flange/incline, screed at 4' 9m Hanger w/ HF96 Bracket outside flange/level, screed at 6' 9m Hanger w/ HF96 Bracket outside flange/incline, screed at 5' 12m Hanger w/ HF-96 Bracket outside flange/level, screed at 5' 12m Hanger w/ HF-96 Bracket inside flange/level, screed at 5' 6,000 lbs 6,800 lbs 15,400 lbs 10,500 lbs 13,550 lbs 12,700 lbs Lateral Torsional Buckling of Bracket Puncture in bracket web, causing lateral rotation of bracket Girder Flange Bearing, Significant Hanger/Coil Rod Deformation Girder Flange Punching Shear, Significant Hanger Deflection Girder Flange Punching Shear Girder Flange Punching Shear All of the Phase I tests resulted in punching shear failures of the top flange of the girder. For a NCDOT 63 in. MBT girder it was found that the flange in mild shear reinforcement areas could support an approximate 11,000 lb. 45 degree hanger load. In high girder shear reinforcement areas, the punching shear strength of the flange increased to an approximate 14,500 lb. 45 degree hanger load. 35
47 Although the ultimate failure occurred in the flange, some tests experienced significant hanger deflections. Both the 6m and 9m hangers have identical horizontal plates and therefore exhibited the same vertical bending behavior. As the load is increased the front of the hanger deflects down to bear onto and into the edge of the flange. The 12m hanger with a larger horizontal bending plate did not experience large front edge deflections and did not bear onto the front edge of the flange. Leading up to the ultimate punching failure, flexural cracking occurs at the centerline of the load point due the deflection of the flange. This flexural crack propagates from the underside of the top flange to the front of the flange and continues up to the top of the front flange. Figure II.2.12 illustrates the typical failure sequence of the 6m and 9m hangers. Figure II.2.13 illustrates the propagation of the flexural crack in the flange as well as the spalling of the concrete which occurred in tests involving the 6m and 9m hangers due to large hanger deflections. Figure II.2.14 shows the ultimate punching shear cone geometry at failure. Figure II.2.15 shows a typical plot of the flange deflection vs. hanger load, with illustrations of key points. 36
 37")
48 Small Spalling 0 lbs 6,000 lbs: hanger bears onto flange 10,000 lbs: increasing spalling 11,000 lbs: girder crack at front center 11,200 lbs: flange failure in cone shape Figure II.2.12: Typical Flange Failure Sequence for 6m and 9m Hangers (9m-2-M shown) 37
: Flexural Crack")
: Ultimate Punching")
49 Figure II.2.13 (9m-2-M): Flexural Crack and Spalling of Concrete Figure II.2.14 (9m-2-M): Ultimate Punching Shear Failure 38
 Figure II.2.15: Typical Vertical Flange Displacement Plot For the Phase II tests, the failure modes were dependant upon the type of bracket used for the test.")
50 9m-2-M Test: Hanger Load vs. Vertical Flange Displacement Flange Failure Hanger Load (lbs) Vertical Flange Displacement (in.) Figure II.2.15: Typical Vertical Flange Displacement Plot For the Phase II tests, the failure modes were dependant upon the type of bracket used for the test. In tests with the HF-96 bracket, the bracket was stronger than its hanger system. The HF-96 brackets did not experience any permanent deformation or failure within the bracket. In three of the four tests involving the HF-96 bracket the ultimate failure mode was a punching failure of the girder flange. The remaining test utilizing an HF-96 bracket failed in a bearing failure at the edge of the flange occurring from large deflections on the front end of the hanger. The HF-85 bracket failed in both tests at a relatively early load compared to the capacity of its hanger system. The two HF-85 brackets experienced failures of lateral torsional buckling and web bearing tear out at the bolt connecting the webs of the horizontal channels of the bracket. Vertical bending deformation occurred in the hanger for both tests involving the HF-85 bracket but no damage occurred in the flange of the girder due to the low load capacity of the bracket. 39
51 The bracket configurations and load locations had minimal effects on the ultimate loads recorded in the Phase II tests due to the fact that the ultimate failure mode was punching shear of the top flange. In test 9m-HF96-OL-6 the failure was slightly. The front edge of the hanger bent down to bear into the edge of the girder flange, which resulted in concrete spalling at the edge of the flange, allowing the hanger to continue to deflect downward. The bracket load distribution data collected in the Phase II testing was used to evaluate the load distribution of the bracket loads to the hanger and to the bearing location on the girder. An analysis of the collected data proves engineering static mechanics to be an effective tool for determining approximate load components. It was observed that a small percentage of the vertical load is taken by the friction created between the bracket and girder at the location where the bracket rests on the girder. This vertical load component is equivalent to the coefficient of friction between steel and concrete, 0.45, multiplied by the horizontal normal force on the girder. 40
52 CHAPTER II.3 ANALYTICAL STUDY II.3.1 Overview An analytical study was conducted to further investigate the falsework system behavior. The study included finite element analysis and evaluation of the current ACI design specification provisions. II.3.2 ACI Code Provisions Loading the flange of the Bulb Tee girder through falsework hangers produces a punching shear type failure at the location of the applied load. A study of the American Concrete Institute s (ACI) punching shear provisions evaluated the applicability of the code process for predicting the punching shear seen in the falsework study. Any prestressing forces produced in the flange have been neglected due to their insignificant effect on the punching shear capacity of the flange. The stresses which are created in the top flange of the girder by the prestressing forces are small enough by design to not positively effect punching capacity. In ACI Code section for nonprestressed slabs and footings shear strength, V c, shall be the smallest of: Vc 4 = (2 + ) f ' cbod β Equation (II.1) α sd Vc = ( + 2) f ' cbod Equation (II.2) bo V f b c = 4 ' c 0d Equation (II.3) 41
53 where, V c = the predicted punching shear capacity β c = unit-less ratio of the length of the long side of the loading plate to the short side of the loading plate f c. = the compressive strength of the concrete in pounds per square inch b = the perimeter of the critical section assumed at a distance d/2 from the perimeter o of the loading plate d = the effective depth of the concrete slab α s = constant taken as 40 for interior loads, 30 for edge loads, and 20 for corner loads The first step of the punching shear evaluation used equations II.1 through II.3 with the critical section defined by ACI as the distance d/2 from the perimeter of the loading plate. It was quickly determined that the ACI code provisions greatly over predicted the punching shear strength of the MBT girder flange. ACI estimated punching shear strength for the three falsework hangers used in the testing on the MBT girder flange is 24,030 lbs. The code only takes into account the perimeter of the bearing plate, which is the same for all three of the hanger types. The second part of the punching shear assessment used the measured dimensions of the punching shear cones produced in the experimental testing with the ACI punching shear equations in an attempt to determine a reasonable coefficient of compressive strength square root. Each of the punching shear cones were measured following the full scale testing. The perimeter of the cone was used in equation II.3 with an average 42
54 effective depth of the tapered top flange. The known shear strength from the experimental test was then used to determine an appropriate coefficient. It was determined that the ACI punching shear analysis equations are not valid for this type of failure mode due to the combined shear and flexural stress effect in the thin, lightly reinforced flange. Table II.3.1 compares testing results of ultimate vertical punching shear loads for tests experiencing punching shear failure to expected ultimate loads calculated using ACI punching shear equations by applying the dimensions of the measured shear cone to the ACI equation II.3. The concrete shear strength represented by, 4 f ' c, in the ACI specification was found to recommend a much higher expected ultimate strength than that proven by the testing of a bulb tee girder flange. Experimental tests of overhang falsework hangers installed on thin flanged girders show the punching shear strength to be approximately, 1.0 f ' c. The coefficient column in table II.3.1 gives the multiplication factor of the concrete compressive strength that when multiplied by the effective shear resisting area equals the experimental testing values. Table II.3.1: Experimental vs. ACI Predicted Punching Shear Strength Ultimate ACI Predicted Shear Vertical Load Punching Reinforcement Test ID on Flange Capacity Coefficient 6m-1-M Mild 7,780 lbs 26,500 lbs m-2-M Mild 7,920 lbs 29,700 lbs m-1-H High 10,600 lbs 31,350 lbs m-2-M Mild 8,500 lbs 29,150 lbs m-HF96-OI-5 Mild 7,430 lbs 31,330 lbs m-HF96-OL-5 High 9,580 lbs 36,950 lbs m-HF96-IL-5 High 8,980 lbs 39,000 lbs 0.92 **ACI Predicted Punching Capacity computed using measured shear cone perimeter and slab depth with: V= c 4 fc'bd o 43
55 II.3.3 Finite Element Modeling Finite element models were developed using ANACAP modeling software in an attempt to duplicate the cracking behavior, flange deflection, and ultimate punching shear capacity seen in the full scale tests. The model focuses on the tapered portion of the flange, which extends 16 from the edge as illustrated in figure II.3.1. Figure II.3.2 shows the model geometry, loading components, and reinforcement pattern. Symmetry is utilized at the centerline of the hanger location. The remaining two cut edges were given a fixed boundary condition. A longitudinal dimension of 40 was developed for the model as the minimum length required for obtaining full cracking behavior of the flange. An appropriate eight node brick element mesh was obtained through a refinement study. All reinforcing bars and the prestressed strand are depicted in the model at the spacing and locations of the girder design. The loading on the model was applied as two components, horizontal and vertical. The vertical component was applied as a distribute load in the location of the hanger bearing plate. The horizontal component was applied to a vertical anchor located 12 in. from the edge of the flange. 44
56 Model Area Figure II.3.1: Model Area ½ L.R. Grade 270 Prestressed Strand #5 12 CTS. Fixed Plane Plane of Symmetry Vertical Anchor Figure II.3.2: Rebar Pattern, Loading Components, Dimensions 45
57 Since the finite element model area was only of the flange portion of the girder, it was necessary to subtract out any torsion or lateral movements occurring in the full scale testing from the overall obtained flange deflection. After subtracting these movements out, a direct comparison can be made between the deflections of the finite element model and the full scale testing results. Failure of the ANACAP models was determined using an empirical criterion for punching shear failure established by Kinnun and Nylander (1960). The developed criterion states that a punching shear failure occurs in a slab when the compressive circumferential strain at the top surface at a distance of B/2+y from the loaded area reaches the critical value of (B=width of the punching cone, y=distance from the top of the slab to the center of rotation). At the critical strain, the concrete softens in the circumferential direction and the failure occurs. Additional comparisons between cracking patterns and deflections verified the applicability of the analytical study to the experimental testing. The finite element models created using ANACAP modeling software depict similar behavior results to the full scale testing. A triangular shaped crack pattern generated by the Anacap software at documented load steps is similar to those experienced in the full scale testing. In figure II.3.3 the crack potential contour sketch at approximately 6,000 lbs shows the strong potential for the flexural crack occurring at the mid-span as well as the developing punching shear cone. The shades vary from highest crack potential to lowest from the bottom corner of the plane of symmetry. In the experimental testing flexural cracks were first seen at approximately 6,000 lbs., identical to what is seen in the crack potential contour sample. 46
58 Flexural Cracking Location Figure II.3.3: ANACAP Crack Potential Contour at Approximately 6,000 lbs A comparison to the deflection of the flange at the midpoint of the load between the finite element model and the full scale tests was also found to be similar as shown in figure II.3.4. As seen in the figure the stiffness of the full scale testing is accurately represented by the ANACAP model. A slight difference in deflection is seen at the ultimate load, but the stiffness is accurately represented by the ANACAP model. The difference is negligible relative to the overall purpose of the model, but could be attributed to a combination of element type, element size, and rebar placement. The ultimate loading represented by the model is also displayed in figure II.3.4, which is almost identical to experimental tests. Figure II.3.5 shows a strain potential contour sketch at the ultimate load, illustrating the critical strain path depicted in the model. 47
 Figure II.3.4: ANACAP Deflection Results vs. Full Scale Test Results Figure II.3.5: ANACAP Strain Contour at Critical Load 48")
59 12m-1-H vs. Anacap Flange Vertical Displacement Comparison Hanger Load (lbs) A-12m-H Deflection 12m-1-H Deflection Vertical Deflection (in.) Figure II.3.4: ANACAP Deflection Results vs. Full Scale Test Results Figure II.3.5: ANACAP Strain Contour at Critical Load 48
60 CHAPTER II.4 CONCLUSSION/RECOMMENDATIONS A potential problem has been discovered through full scale testing, and verified by analytical studies, in using top of flange overhang falsework hangers with bulb tee bridge girders. Overhang falsework hanger systems in use with bulb tee girders have a tendency to fail the flange of the girder through punching shear at relatively early system strength due to the combined flexural and punching shear stresses created in the thin, lightly reinforced top flange. Finite element models using Anacap modeling software further validate the results of the full scale testing by concluding similar behavioral results. The calculations performed using predicted punching shear capacity equations from the ACI manual did not provide an accurate prediction of the ultimate shear strength of the bulb tee girder flange. The inaccuracies of the ACI punching shear code to predict experimental behavior come primarily as a result of the lack of flexural reinforcement to contain the flexural cracking occurring in the flange. The progressive propagation of the flexural cracks reduces the overall concrete area preventing the punching shear failure. Overhang falsework systems installed onto bulb tee girders should be designed with respect to the possibility of punching shear failures occurring in the top flange of the girder. 49
61 REFERENCES ACI, 2005, 318R-05 Building Code Requirements for Structural Concrete and Commentary, American Concrete Institute, Farmington Hills, MI. Ariyasajjakorn, D. and Sumner, E.A., 2006, Full Scale Testing of Overhang Falsework Hangers on NCDOT Modified Bulb Tee Girders, Kinnunen, S., and Nylander, H. 1960, Punching of Concrete Slabs without Shear Reinforcement, No. 158, Transactions of the Royal Institute of Technology, Stockholm, Sweden. Meadow Burke Products, Inc. (2003) Forming Hardware for Bridge Decks. Mufti, A. and Hassan, T., Finite Element Analysis and Theoretical Study of Punching Shear Strength of Concrete Bridge Decks, Canadian Journal of Civil Engineering, V. 32, pp Richart, F.E., Reinforced Concrete Wall and Column Footings, Part 1, Journal of the American Concrete Institute, V. 45, No. 2, 1948, pp Richart, F.E., Reinforced Concrete Wall and Column Footings, Part 2, Journal of the American Concrete Institute, V. 45, No. 3, 1948, pp
62 PART III CHAPTER III.1 ANALYTICAL INVESTIGATION DETAILS III.1.1 Overview This Chapter will describe in detail the analytical investigation carried out as a part of this study. The purpose of the analytical investigation is to determine methods to predict the experimental testing results in order to fully understand the system. The chapter is divided into four different sections, the Finite Element study, ACI code provisional study, bracket load distribution analysis, and the hanger behavior. Along with the description follows detailed results of each process. III.1.2 Finite Element Study A 3-D, nonlinear finite element investigation was completed as a part of the thesis. Finite Element (FE) models created using ANACAP, a concrete analysis FE code, were developed to further investigate the behavior observed in the experimental study. The ANACAP program consists of three modules. The first part of the program, ANAGEN, allows a user to input model geometry, specify elements, material properties, section properties, and specify mesh refinement locations. ANAGEN then compiles nodes into the specified elements and creates the mesh within the model geometry specified. The main processor, ANACAP, is then utilized to conduct the analysis and determine the stresses and strains of the element nodes within the mesh. To assist in the viewing of the data the third module, ANAPLOT, will plot any specified relationship behavior within the mesh. 51
63 The model size was determined using a trial and error approach. The goal of the model sizing procedure was to create the smallest geometric model size possible while still keeping direct applicability to the experimental testing. An appropriate model size was determined as the smallest geometric model able to represent full cracking behavior across the section. Symmetry was utilized at the centerline of the loading location. The mesh size was determined using a convergence study. The study initially began with a course mesh, gradually becoming finer, until reaching a point where very little displacement variance was seen between adjacent mesh sizes. The initial finite element study consisted of four different models. The models vary by the change in the placement of the vertical pressure loads, representing the two different hanger behaviors seen in the experimental testing. As mentioned the 6m and 9m hangers experience heavy bending to bear onto the front edge of the flange. This change in vertical load location is taken into account in the 6m and 9m hanger models. For the 12m hanger load, the vertical load location remains consistent throughout the test. Each type of hanger is modeled with high and mild shear reinforcement spacing. Table III.1.1 below details the model variances. Table III.1.1: ANACAP Test Matrix Test ID Test Description A-12m-H A-12m-M A-6m/9m-H A-6m/9m-M 12m Hanger, High shear reinforcement 12m Hanger, Mild shear reinforcement 6m/9m Hanger, High shear reinforcement 6m/9m Hanger, Mild shear reinforcement After determining inadequacies in the strength of the girder flange, additional models were created to investigate a method of increasing the strength of the flange. A series of models were created to determine an appropriate flange thickness to develop the 52
64 full strength of the hanger. A model was also created to determine the effectiveness of an additional rebar placed parallel to the edge of the flange. The model dimensions used were identical to those of the four primary models. Material Modeling The ANACAP concrete model utilizes the smeared cracking model approach. The approach is based on the Drucker-Prager modified J2 plasticity theory. The model assumes cracks to form perpendicular to directions with the largest tensile strains. If cracking occurs, the normal stress across the crack is reduced and the distribution of stresses around the crack is recalculated through equilibrium iteration (ANATECH, 2004). The model also contains a shear retention model which reduces the incremental shear modulus across an open crack. The feature reduces the shear stresses supported by an open crack if the crack continues to propagate. Figure III.1.1 describes the shear stress capacity across an open crack. Figure 4.1: Shear Stress Capacity Across an Open Crack (ANATECH, 2004) The reinforcing is modeled in ANACAP as individual sub-elements within the mesh. The reinforcement stress and stiffness are imposed onto the concrete elements as appropriate. Behavior of the rebar itself is contains a separate constitutive model within ANACAP that treats the steel plasticity, strain hardening, and bond slip behavior (ANATECH, 2004). The Von Mises plasticity formulation, which treats the yielding of the rebar, utilizes the effective stress and effective strain to define the increasing yield stress with plastic strain. Figure III.1.1: ANACAP Stress Capacity across an Open Crack 53
65 Model Details The ANACAP models use a 3-D, 8 node brick element. The 8-node element is sufficient for capturing the bending behavior occurring within the flange of the girder, if the mesh size is fine enough to avoid the problem of shear locking. The properties of the materials used in each model are given in the test summary sheets presented in Appendices L-O. For the prestressing strand the material model was modified from the true stress strain curve given in the PCI handbook (PCI Handbook, 1999). The material was partially modeled due to the fact that the strand was prestressed prior to the application of the hanger loading. Typically the stress in the field is measure at approximate 150 ksi. This stress was used as the origin point of the material properties and the remainder of the curve was used as the expected behavior of the strand. Figure III.1.2 shows the full stress strain curve of the 270 grade, 7-wire low relaxation strand, with the part of the curve represented by the model highlighted. Figure III.1.3 then shows the bilinear representation of the curve which was used in the model. 54
66 Stress, f ps (ksi) Modeled Prestressed Behavior Approximate Equations: ε : f = 28, 500ε ε ps ps : f Strain, ε ps (in./in.) > ps ps = 270 ε ps ps Figure III.1.2: Stress-Strain Curve of 270 Grade, 7-wire LR Prestressing Strand Stress, f ps (ksi) fpy = 250 ksi True stress strain curve fpu = 268 ksi Prestressing reinforcement model Strain, ε ps (in./in.) Figure III.1.3: Prestressing Reinforcement Bi-linear Representation 55
67 Model Details The model size determined through the trial and error approach was the same for each of the four primary models. Only the tapered portion of the top flange was modeled as described in figure III.1.4. Model Area Figure III.1.4: ANACAP Model Area The model length for full crack propagation was determined as 40 inches from the centerline of the load. The centerline of the load was utilized as the line of symmetry. The #5 reinforcement bars were spaced at 12 and 24 for the high and mild shear models, respectfully. Both tests included the 270 grade 7-wire low relaxation strand as described in figure III.1.3. Figure III.1.5 displays the reinforcement bar model for the high shear reinforcement model and model dimensions. Model dimensions are constant for high and mild shear reinforcement models. Figure III.1.6 illustrates the boundary conditions of the model. 56
.")
68 ½ L.R. Grade 270 Prestressed Strand #5 12 CTS. Hanger Location Fixed End Figure III.1.5: Model Dimensions and Rebar Layout (High Shear Model) Hanger Location Fixed End Plane of Symmetry Figure III.1.6: Boundary Conditions of ANACAP Model Model Results Failure of the ANACAP models was determined using an empirical criterion for punching shear failure established by Kinnun and Nylander (1960). The developed 57
69 criterion states that a punching shear failure occurs in a slab when the compressive circumferential strain at the top surface at a distance of B/2+y from the loaded area reaches the critical value of (B=width of the punching cone, y=distance from the top of the slab to the center of rotation). At the critical strain, the concrete softens in the circumferential direction and the failure occurs. Additional comparisons between cracking patterns and deflections verified the applicability of the analytical study to the experimental testing. To assist with the viewing of results, the ANAPLOT module was utilized. Within ANAPLOT the results or the analysis can be viewed in figure and plot form. Overall the models depicted well the results seen in the experimental program. Cracking patterns propagated to form the geometry of the shear cone observed in the experimental testing. Midpoint deflection results were similar to those observed in the experimental testing. Figure III.1.7 illustrates a sample cracking pattern observed in the models. The crack pattern sample shows the flexural cracking occurring along the plane of symmetry as well as the formulation of the punching shear cone. Detailed results from each of the models can be found in appendices L-O. A plot comparison of the ANACAP results and the experimental program results can also be found within these appendices. Table III.1.2 summarizes the results for each of the four models, and makes a comparison to the values observed in experimental testing. 58
70 Figure III.1.7 : A-12m-H Crack Pattern at 6,900 lb. Applied Vertical Load Table III.1.2: ANACAP Results Summary Test ID Max Vertical Deflection (in.) Ultimate Hanger Load (lbs) ANACAP Experimental ANACAP Experimental A-12m-H ,900 14,000 A-12m-M ,950 12,000 A-6m/9m-H N/A 13,092 N/A A-6m/9m-M ,491 11,000 Once it was discovered that the models were able to accurately predict the behavior and ultimate strength of the system, a study was conducted to determine the required flange thickness to develop the full strength of the hanger and to determine if additional rebar will enhance system strength. The study concluded that a 4 ½ in. thick tapered top flange would provide the necessary strength to develop the full 24,000 lb. Meadow Burke hanger capacity. Figure III.1.8 illustrates the load vs. deflection plot of the 4 ½ in. thick ANACAP flange model. In addition, a test was conducted to determine if adding a reinforcing bar parallel to the edge of the flange would significantly increase the strength of the flange. It was concluded through the test that the bar does not provide substantial additional capacity. 59
71 Hanger Load vs. Flange Deflection for 4.5 in. thick ANACAP Model Hanger Load (lbs) Vertical Deflection (in.) Figure III.1.8: 4.5 in. Thick top flange ANACAP Model III.1.3 ACI Code Provisional Study The code provisional study attempted to validate the ACI code for punching shear failure to the punching shear failure seen in the experimental testing of the bulb tee girder flange. The three ACI punching shear equations detailed in Chapter 2 are the basis for predicted ultimate punching shear capacities of non-prestressed slabs and footings. The prestressing forces within the girder would have negligible effects on the punching shear capacity of the flange because the stresses in the top flange are designed to be approximately zero, validating the use of these equations for the predicted capacity. Using the equations as described in the ACI code was quickly determined to be inappropriate. The predicted values given by the equations are much higher than those recorded in the experimental testing procedure. As mentioned the perimeter of the critical section is taken at a distance d/2 from the load bearing plate. The following 60
72 example utilizes the equations as given in the ACI code. Figure III.1.9 illustrates the ACI method for determining the effective punching shear resistance perimeter. Shear Cone Boundary Edge of Flange Bearing Plate Figure III.1.9: ACI Method for Punching Shear Perimeter SAMPLE CALCULATION Average Flange Depth, d = in. 2 d = = 1 15/16 in. = in. 2 2 Effective Shear Perimeterb = ( ) + 2*( ) = in. Punching Shear Strength is the Minimum of, o 4 4 Vc = (2 + ) f ' cbod= ( 2 + ) 7500(18.75)(3.875) = lbs. Eq. (III.1) β 1.5 α sd Vc = ( + 2) f ' cbod lbs. Eq. (III.2) bo (30)(3.875) = ( + 2) 7500(18.75)(3.875) = = = (18.75)(3.875) = 25,170 lbs. Controls Eq. (III.3) Vc 4 f ' cb0d 61
73 As seen in the previous example equation III.3 controls the ultimate punching shear capacity. To determine an appropriate relation between the experimental punching shear and the predicted punching shear from equation III.3, the geometry of the punching shear cones from the experimental study were measured. The measured punching shear cone perimeter as well as the average depth from the tapered top flange was used in equation III.3 to determine the correlation between the measured capacity, and the capacity determined by ACI methods. The shear cone propagates through the flange at an approximate 45 degree angle. For this reason it is necessary to measure the perimeter of the top and the perimeter on the bottom to find an average perimeter. The average perimeter is used in calculations. Figure III.1.10 illustrates a measured experimental punching shear cone. Average Perimeter Top Crack Bottom Crack Edge of Flange Figure III.1.10: Measured Punching Shear Cone (Test ID: 12m-HF96-OL-5) 62
74 SAMPLE CALCULATION Test ID: 12m-HF96-OL-5 Cone dimension as given in figure 6.5 in. deep into the flange, flange thickness = in Average Slab Depth, d = = in. 2 2 Perimeter, b o = 2( ( ) = in. Predicted Capacity Using Measured Shear Cone Geometry with ACI method, V c = 4 f ' b d = (27.3)(3.9063) = 36,950 lbs. c o Punching shear failure observed at a vertical load = 9,600 lbs. 7500(27.3)(3.9063) = 9,235 lbs. for Test ID: 12m-HF96-OL-5, V c 1.04 f ' cb d o A comparison between the two values in each test yields a predicted punching shear value as approximately equal to that shown in equation III.4: V c = 1.0 f ' cb d Equation (III.4) o The perimeter, b o, to be used in equation III.4 shall be determined using the ACI method as described previously. The effective depth, d, is the average depth of the flange measured from the 3.5 in. thick edge to a distance d/2 from the back of the bearing plate. Table III.1.3 summarizes the punching shear values for each test using the described method and compares the values to experimental test results. 63
75 Test ID Table III.1.3: Estimation of Punching Shear Values Effective A) Estimated Average Perimeter Punching Strength Depth (in.) (in.) (lbs) B) Observed Punching Strength (lbs) Ratio B/A ,832 7, m-1-m ,625 7, m-2-m ,425 7, m-1-H ,840 10, m-2-M ,290 8, m-HF96- OI-5 12m-HF96- IL ,750 9, m-HF96- OL ,235 9, **NOTE: Tests not experiencing punching shear failure not include in this table A) calculate using Eq. (III.4) III.1.4 Bracket Load Distribution Analysis The load distribution within a bracket is important to the bracket and hanger manufacturer in their design of the two specimens. A method to calculate the components increases the overall quality and efficiency of the system design. Bracket manufacturers question the ability of engineering static analysis to correctly predict the bracket loading components. The bracket behaves in a manner that when loaded eccentrically, the near side of the bracket will rise up and in some cases bear against the top flange of the girder. Some speculation that this bearing will take some vertical load will attempt to be validated. Figure III.1.11 shows the described lifting of the bracket. 64
76 Potential Bearing Location Figure III.1.11: Bracket Lifting Behavior To analyze the components, load cells were placed at locations where the load from the bracket is dispersed to the hanger and girder. The vertical applied load was also recorded. Figure II.2.10 of Chapter II.2 illustrates the locations of the load cells on the test setup. The investigation process began by assuming that a static analysis would describe the system. The moments were summed at the upper tip of the top flange. Using the friction force created between the horizontal load component and the girder gives the sum of the moments equal to 0 validating the static analysis assumption. The coefficient of friction between concrete and steel is taken as A friction force is determined by the product of the coefficient of friction and the normal force. Table III.1.4 shows a sample of the recorded data, and figure III.1.12 shows the location of the moment summation. Table III.1.5 summarizes the results of the load distribution analysis study for each bracket test by a percent difference at three different loading stages between the theoretical measured load and the measure load using the summation of moments. The 65
77 three different loading stages used in the comparison are 1) 25 percent 2) 50 percent 3) 100 percent of ultimate applied load. The measured load is described by figure III Table III.1.4: Sample Load Component Data (Test ID: 12m-HF96-OL-5 Horizontal Component (lbs) Vertical Component (lbs) Hanger Component (lbs) 7,650 5,006 8,466 Applied Load 5,006 lbs. Moment Summation O Assumed Friction Force 0.45*7,650 Measured 7,650 lbs. Figure III.1.12: Moment Summation Location Table II.1.5: Percent Difference Between Static Analysis and Measured Test ID Mean 6m-HF85-OL m-HF85-OI m-HF96-OI m-HF96-OL m-HF9-OL m-HF9-IL To further validate the engineering static analysis applicability, the moments were also summed at the location of the horizontal load component. In several bracket 66
78 configurations the coil rod varied slightly from the desired 45 degree angle. For this reason it was necessary to measure the angle of the coil rod in order to obtain correct horizontal and vertical load components of the hanger load. Using the hanger load components as well as the vertical applied load and summing moments at the bottom of the bracket gives moments equal to approximately 0 as well. Figure III.1.13 illustrates the location of the moment summation. Applied Load Vertical and Horizontal Hanger Load Components O Moment Summation Figure III.1.13: Alternative Moment Summation Location The bracket load distribution analysis carried out as a part of this study proves that a static analysis will provide the correct loading components within a bracket. From the test results it was found that the bracket bearing on the underside of the girder flange does not provide significant support to the bracket. 67
79 III.1.5 Hanger Behavior Analysis Several aspects of the hanger were evaluated prior to experimental testing to predict its behavior and to assist in ensuring a safe and practical test. Appropriate analysis was performed to determine bearing plate strength, vertical bending deflection, and horizontal bending deflection. Figure III.1.14 illustrates the behavior properties examined for each hanger. Vertical Bending Deflection Horizontal Bending Deflection Bearing Plate Figure III.1.14: Hanger Behavior Analysis Description Bearing Plate Evaluation As mentioned each of the three tested hangers have varying bearing plate thicknesses. The thickness of the bearing plate was important to the ability of the plate to distribute the load across the full 2 x3 area of concrete. To ensure the appropriate distribution of the load by the bearing plate, the strength of the plate was calculated. The strength of the plate was assumed to be controlled by the cantilever portion off of each side of the hanger. Figure III.1.15 describes the overhang of the bearing plate. Analysis of the bearing plate cantilever portion yields maximum hanger loading of 4.25, 12, and 68
80 67.9 kips for the 6m, 9m, and 12m hanger, respectively. These values are the loading values the bearing plates can effectively distribute across their entire concrete surface and do not provide input into system failure. Bearing Plate Overhang Section Figure III.1.15: Bearing Plate Analysis Location Vertical Bending Deflection of Hanger Two identical plates run horizontally for each of the three different hangers. The plates are responsible for resisting the vertical bending moments created within the hanger. Excessive bending within the plates will cause the hanger to bear onto the top flange of the girder, varying the load distribution from only the bearing plate to an additional component at the tip of the girder flange. The horizontal plates for the 6m and 9m hangers have identical dimensions, while the horizontal plates for the 12m hanger have larger dimensions. Figure III.1.16 describes the dimensions of the analyzed plates. The calculation presented is an estimate to the load at which the horizontal plate will begin to yield. Table III.1.6 summarizes the calculations for each of the three hanger types and makes a comparison to observed first yielding occurring within the hanger. 69
81 Horizontal bending plates Figure III.1.16: Dimensions of Hanger Bending Plate Analysis Table III.1.6: First Yield Summary for Vertical Deflection Behavior Hanger Type Calculated First Yield Observed First Yield (kips) (kips) 6m/9m m NOTE: 6m and 9m have identical horizontal plates Horizontal Deflection of Hanger The vertical rod to which the hanger is attached, will contain a horizontal distributed force from the hanger. The force will cause a deflection within the rod, which if excessive could lead to an unexpected, undesirable bracket configuration. Calculations were performed to estimate the horizontal bending deflection occurring within the bracket. The calculations will vary slightly depending on the type of hanger due to the height of the distributed load on the rod. The horizontal hanger deflections were found to be insignificant to the overall behavior and configuration of the system. Figure III.1.17 describes the horizontal displacement behavior. The x dimension varies for each hanger 70
82 type, varying the behavior for each. Table III.1.7 shows calculated values of expected horizontal displacement compared to observed values for a single experimental test. Figure III.1.17: Horizontal Displacement Behavior Table III.1.7: Hanger Horizontal Displacement Values 2,750 lbs 5,500 lbs 11,000 lbs Hanger Type Calculated Observed Calculated Observed Calculated Observed 6m m m III.1.6 Analytical Investigation Conclusions A comparison between the analytical investigation presented within this chapter and the experimental study, concludes the following: Finite element models give reasonable results for deflections, cracking patterns, and ultimate loading 71
83 The ACI predicted punching shear capacity is much higher than that of the experimental Engineering statics accurately predicts the load distribution within the bracket Various aspects of the hanger behavior can be approximated 72
84 CHAPTER III.2 TENSION TIE BAR III.2.1 Introduction to Future Research The tension tie bar running from the top of the exterior girder to the top of the adjacent girder is designed and placed to minimize torsion of the exterior girder. Whether or not the tension tie bar is serving its intended purpose is an important factor for two reasons: time and money. If the tie bars are not experiencing significant tensile loading then the time it takes to install each bar should be eliminated and the torsion resisting system need be reevaluated. In theory torsion resisting tie bars are the most effective means of counterbalancing eccentric loading on the exterior girder. In the field however, a complex system is created by the S.I.P. forms and intricate loading, that makes it difficult to predict the actual contribution of the tie bars to the resistance of torsion. Installation of the tie bars is costly and time consuming to the contractor, resulting in increased cost for the state transportation department. The North Carolina Department of Transportation (NCDOT) has requested assistance for gauging the effectiveness of using tension tie bars for torsion resistance on exterior North Carolina bridge girders subjected to torsion. Standard procedure for the NCDOT is to use #4 or #5 tie bars spaced no more than 8 apart in use with diagonal timber compression struts. Tie bars are installed prior to the placement of any concrete or screed weight on the structure. 73
85 North Carolina State University will soon begin analyzing the performance of the tension tie bar through extensive field study. Subsequent analytical analysis will also be completed. 74
86 Appendix A 6m-1-M Test Summary Sheets 77
87 Test Summary Sheet Test ID: 6m-1-M (6m Hanger, Test 1, Mild Shear Reinforcement) Test Date: February 1, 2006 Sponsor: Meadow Burke Products, Inc. Tested By: Emmett Sumner, Ph.D., P.E. and Paul Lackey, E.I. Test Location: Constructed Facilities Laboratory (CFL), NC State University Test Description Meadow Burke 6m Hanger pulled at a 45 degree angle in mild shear reinforcement area of girder Hanger: Coil Rod: Girder: Meadow Burke 6m 1/2 in. Meadow Burke Coil Rod, 9,000 lb Safe Working Load NCDOT Modified Bulb Tee 63 in. Concrete Cylinder Strength = 7,500 psi Experimental Results Maximum Hanger Load = 11,000 lbs Maximum Girder Rotation = rad. Maximum Flange Vertical Displacement = in. Maximum Hanger Horizontal Displacement = in. Maximum Hanger Vertical Displacement = N/A Test Observations and Notes: At 3,000 lbs, At 5,000 lbs, At 6,000 lbs, At 8,000 lbs, At 10,000 lbs, At 11,000 lbs, hanger begins to yield above bearing plate heavy yielding and bending deformation occurring in the hanger hanger bears onto and into the front of the girder flange hanger chips away and continues digging into the front of the flange small crack forms underneath girder flange at centerline of hanger cracks propagate in flange from behind hanger bearing plate and flange fails in cone shape (Punching Shear) Yielding and permanent deformation occurred in the hanger. The coil rod also experienced significant bending deformation with that of the hanger. Test complete due to failure of the flange. 78
88 6m-1-M Test: Hanger Load vs. Horizontal Hanger Displacement Hanger Load (lbs) Horizontal Hanger Displacement (in.) 6m-1-M Test: Hanger Load vs. Hanger Bending Deflection Hanger Load (lbs) Instrumentation Error Data Not Available Vertical Bending Deflection (in.) 79
89 6m-1-M Test: Hanger Load vs. Girder Rotation Hanger Load (lbs) Girder Rotation (rad.) 6m-1-M Test: Hanger Load vs. Vertical Flange Displacement Hanger Load (lbs) Vertical Flange Displacement (in.) 80
90 6m-1-M Test: Vertical Flange Displacement vs. Distance from Hanger Vertical Flange Displacement (in.) Distance from Hanger (in.) 3,000 lbs. 6,000 lbs. 9,000 lbs. 11,000 lbs. 81


91 6m-1-M: Hanger Bending 6m-1-M: Hanger chips away Girder Flange 82


92 6m-1-M: Failure of the Flange 83
93 6m-1-M: Hanger at End of Test 6m-1-M: Coil Rod at End of Test 84
94 Appendix B 9m-1-H Test Summary Sheets 85
95 Test Summary Sheet Test ID: 9m-1-H (9m Hanger, Test 1, High Shear Reinforcement) Test Date: January 23, 2006 Sponsor: Meadow Burke Products, Inc. Tested By: Emmett Sumner, Ph.D., P.E. and Paul Lackey, E.I. Test Location: Constructed Facilities Laboratory (CFL), NC State University Test Description Meadow Burke 9m Hanger pulled at a 45 degree angle in high shear reinforcement area of girder Hanger: Coil Rod: Girder: Meadow Burke 9m 1 in. Meadow Burke Coil Rod NCDOT Modified Bulb Tee 63 in. Concrete Cylinder Strength = 7,500 psi Experimental Results Maximum Hanger Load = 5,000 lbs Maximum Girder Rotation = rad. Maximum Flange Vertical Displacement = in. Maximum Hanger Horizontal Displacement = in. Maximum Hanger Vertical Displacement = N/A Test Observations: At 3,000 lbs, At 4,000 lbs, At 5,000 lbs, hanger begins to yield at the bottom of the horizontal plates heavy bending is evident test stopped, hanger bending is significant Yielding and permanent deformation occurred in the hanger. Test was stopped for further testing instruction from Meadow Burke Products, Inc. regarding hanger bending behavior. 86

96 9m-1-H: Test Setup 87
97 9m-1-H Test: Hanger load vs. Horizontal Hanger Displacement Hanger Load (lbs) Horizontal Hanger Displacement (in.) 9m-1-H Test: Hanger Load vs. Hanger Bending Deflection Hanger Load (lbs) Instrumentation to Measure Hanger Bending Not Used for this Test Vertical Bending Deflection (in.) 88
98 9m-1-H Test: Hanger Load vs. Girder Rotation Hanger Load (lbs) Girder Rotation (rad.) 9m-1-H Test: Hanger Load vs. Vertical Flange Displacement Hanger Load (lbs) Vertical Flange Displacement (in.) 89
99 9m-1-H Test: Vertical Flange Displacement vs. Distance from Hanger 0 Vertical Flange Displacement (in.) ,500 lbs. 5,000 lbs Distance from Hanger (in.) 90
100 Appendix C 9m-2-M Test Summary Sheets 91
101 Test Summary Sheet Test ID: 9m-2-M (9m Hanger, Test 2, Mild Shear Reinforcement) Test Date: January 26, 2006 Sponsor: Meadow Burke Products, Inc. Tested By: Emmett Sumner, Ph.D., P.E. and Paul Lackey, E.I. Test Location: Constructed Facilities Laboratory (CFL), NC State University Test Description Meadow Burke 9m Hanger pulled at a 45 degree angle in mild shear reinforcement area of girder Hanger: Coil Rod: Girder: Meadow Burke 9m 1 in. Meadow Burke Coil Rod NCDOT Modified Bulb Tee 63 in. Concrete Cylinder Strength = 7,500 psi Experimental Results Maximum Hanger Load Maximum Girder Rotation Maximum Flange Vertical Displacement Maximum Hanger Horizontal Displacement Maximum Hanger Vertical Displacement = 11,200 lbs = rad. = in. = in. = in. Test Observations and Notes: At 3,000 lbs, hanger begins to yield at the bottom of the horizontal plates At 4,000 lbs, heavy bending is evident At 6,000 lbs, hanger bends to down to bear onto front of the flange At 6,500 lbs, hanger bears into and chips away the front of the flange At 10,000 lbs, small crack forms on bottom of girder flange at the centerline of the hanger At 11,200 lbs, flange fails in cone shape (Punching Shear) Yielding and permanent deformation occur in the hanger. Test continues after failure of the flange for remaining stiffness of the hanger. Test complete after satisfactory hanger stiffness obtained. 92
102 9m-2-M: Test Setup 93
103 9m-2-M Test: Hanger Load vs. Horizontal Hanger Displacement Flange Failure Hanger Load (lbs) Horizontal Hanger Displacement (in.) 9m-2-M Test: Hanger Load vs. Hanger Bending Deflection Hanger Load (lbs) Vertical Bending Deflection (in.)
104 9m-2-M Test: Hanger Load vs. Girder Rotation Hanger Load (lbs) Girder Rotation (rad.) 9m-2-M Test: Hanger Load vs. Vertical Flange Displacement Flange Failure Hanger Load (lbs) Vertical Flange Displacement (in.) 95
105 9m-2-M Test: Vertical Flange Displacement vs. Distance from Hanger Vertical Flange Displacement (in.) Distance from Hanger (in.) 3,000 lbs. 6,000 lbs. 9,000 lbs. 11,250 lbs. 96

106 9m-2-M: Initial Bearing of Hanger Tip onto the Girder Flange 9m-2-M: Flange Failure 97


107 9m-2-M: Hanger at End of Test 9m-2-M: Coil Rod at End of Test 98
108 Appendix D 12m-1-H Test Summary Sheets 99
109 Test Summary Sheet Test ID: 12m-1-H (12m Hanger, Test 1, High Shear Reinforcement) Test Date: January 25, 2006 Sponsor: Meadow Burke Products, Inc. Tested By: Emmett Sumner, Ph.D., P.E. and Paul Lackey, E.I. Test Location: Constructed Facilities Laboratory (CFL), NC State University Test Description Meadow Burke 12m Hanger pulled at a 45 degree angle in high shear reinforcement area of girder Hanger: Coil Rod: Girder: Meadow Burke 12m 1 in. Meadow Burke Coil Rod NCDOT Modified Bulb Tee 63 in. Concrete Cylinder Strength = 7,500 psi Experimental Results Maximum Hanger Load Maximum Girder Rotation Maximum Flange Vertical Displacement Maximum Hanger Horizontal Displacement Maximum Hanger Vertical Displacement = 15,000 lbs = rad. = in. = in. = in. Test Observations and Notes: At 3,000 lbs, At 6,000 lbs, At 9,000 lbs, At 10,500 lbs, evidence of yielding occurring directly above front of bearing plate on horizontal plates evidence of horizontal plate yielding at top near back of bearing plate heavy yielding occurring around bearing plate of hanger small crack forms underneath the girder flange at the centerline of the hanger At 14,000 lbs, cracks propagate in girder flange from behind bearing plate to the front of the flange in a cone shape At 15,000 lbs, girder flange fails in cone shape (Punching Shear) Hanger experienced relatively small vertical displacement, overall performed well throughout test. Test complete due to failure of the flange. 100

110 12m-1-H: Test Setup 101
111 12m-1-H Test: Hanger Load vs. Horizontal Hanger Displacement Hanger Load (lbs) Horizontal Hanger Displacement (in.) 12m-1-H Test: Hanger Load vs. Hanger Bending Deflection Flange Failure Hanger Load (lbs) Vertical Bending Deflection (in.) 102
112 12m-1-H Test: Hanger Load vs. Girder Rotation Hanger Load (lbs) Girder Rotation (rad.) 12m-1-H Test: Hanger Load vs. Vertical Flange Displacement Flange Failure Hanger Load (lbs) Vertical Flange Displacement (in.)
113 12m-1-H Test: Vertical Flange Displacement vs. Distance from Hanger Vertical Flange Displacement (in.) ,000 lbs Distance from Hanger (in.) 3,000 lbs. 6,000 lbs. 9,000 lbs. 104


114 12m-1-H: Initial Hanger Yielding 12m-1-H: Failure of Flange 105

115 12m-1-H: Final Hanger Yielding 12m-1-H: Coil Rod at End of Test 106
116 Appendix E 12m-2-M Test Summary Sheets 107
117 Test Summary Sheet Test ID: 12m-2-M (12m Hanger, Test 2, Mild Shear Reinforcement) Test Date: January 27, 2006 Sponsor: Meadow Burke Products, Inc. Tested By: Emmett Sumner, Ph.D., P.E. and Paul Lackey, E.I. Test Location: Constructed Facilities Laboratory (CFL), NC State University Test Description Meadow Burke 12m Hanger pulled at a 45 degree angle in mild shear reinforcement area of girder Hanger: Coil Rod: Girder: Meadow Burke 12m 1 in. Meadow Burke Coil Rod NCDOT Modified Bulb Tee 63 in. Concrete Cylinder Strength = 7,500 psi Experimental Results Maximum Hanger Load = 12,000 lbs Maximum Girder Rotation = rad. Maximum Flange Vertical Displacement = in. Maximum Hanger Horizontal Displacement = N/A Maximum Hanger Vertical Displacement = in. Test Observations: At 3,000 lbs, evidence of yielding occurring directly above front of bearing plate on horizontal plates At 6,000 lbs, evidence of horizontal plate yielding at top near back of bearing plate At 9,000 lbs, heavy yielding occurring around bearing plate of hanger At 10,000 lbs, small crack forms underneath the girder flange at the centerline of the hanger, extends up the front of the flange At 12,000 lbs, girder flange fails in cone shape (Punching Shear) Hanger experienced little vertical displacement or permanent deformation. Yielding did occur in the horizontal hanger plates. Test complete due to failure of the flange. 108

118 12m-2-M: Initial Setup 109
119 12m-2-M Test: Hanger Load vs. Horizontal Hanger Displacement Hanger Load (lbs) Instrumentation Error Data Not Available Horizontal Hanger Displacement (in.) 12m-2-M Test: Hanger Load vs. Hanger Bending Deflection Hanger Load (lbs) Instrumentation Error Data Not Available Vertical Bending Deflection (in.) 110
120 12m-2-M Test: Hanger Load vs. Girder Rotation Hanger Load (lbs) Girder Rotation (rad.) 12m-2-M Test: Hanger Load vs. Vertical Flange Displacement Flange Failure Hanger Load (lbs) Vertical Flange Displacement (in.) 111
121 12m-2-M Test: Vertical Flange Displacement vs. Distance from Hanger 0 Vertical Flange Displacement (in.) ,000 lbs. 6,000 lbs. 9,000 lbs. 12,000 lbs. Instrumentation Error Left Side Deflection Unavailable Distance from Hanger (in.) 112


122 12m-2-M: Flange Failure 12m-2-M: Hanger Yielding Locations 113


123 12m-2-M: Hanger at Failure 12m-2-M: Coil Rod at End of Test 114
124 Appendix F 6m-HF85-OL-4 Test Summary Sheets 115
125 Test Summary Sheet Test ID: 6m-HF85-OL-4 (6m Hanger, HF85 Bracket, Outside flange/level, Screed at 4 ) Test Date: February 27, 2006 Sponsor: Meadow Burke Products, Inc. Tested By: Emmett Sumner, Ph.D., P.E. and Paul Lackey, E.I. Test Location: Constructed Facilities Laboratory (CFL), NC State University Test Description: Meadow Burke 6m Hanger with HF85 bracket; Vertical load applied to bracket at 3-3 7/8 in mild shear reinforcement area of girder Hanger: Coil Rod: Bracket: Girder: Meadow Burke 6m 1/2 in. Meadow Burke Coil Rod Meadow Burke HF-85 NCDOT Modified Bulb Tee 63 in. Concrete Cylinder Strength = 7,500 psi Experimental Results: Maximum Hanger Load = 6,000 lbs Maximum Applied Load = 4,500 lbs Maximum Girder Rotation = rad. Maximum Flange Vertical Displacement = in. Maximum Hanger Horizontal Displacement = in. Maximum Hanger Vertical Displacement = in. Maximum Bracket Vertical Deflection = in. Test Observations and Notes: At 3,000 lbs (Hanger Load), yielding begins at the bottom of the hanger over bearing plate At 4,200 lbs (Hanger Load), bracket begins to bend at load location At 5,500 lbs (Hanger Load), hanger bends down to bear on front of flange At 6,000 lbs (Hanger Load), bracket at failure Yielding and permanent deformation occurred in the hanger causing the hanger to bend down and bear on the front edge of the flange. The HF-85 bracket experienced significant, permanent bending and local web crippling in areas around load point. Test complete due to bracket local web crippling and bending behavior. 116

126 6m-HF85-OL-4: Test Setup 117
127 6m-HF85-OL-4 Test: Hanger Load vs. Horizontal Hanger Displacement Hanger Load (lbs) Horizontal Hanger Displacement (in.) m-HF85-OL-4 Test: Hanger Load vs. Hanger Bending Deflection Hanger Load (lbs) Vertical Bending Deflection (in.) 118
128 6m-HF85-OL-4 Test: Hanger Load vs. Girder Rotation Hanger Load (lbs) Girder Rotation (rad.) 6m-HF85-OL-4 Test: Hanger Load vs. Vertical Flange Displacement Hanger Load (lbs) Vertical Flange Displacement (in.) 119
129 6m-HF85-OL-4: Applied Load vs. Deflection at End of Bracket Applied Vertical Load (lbs) Hanger Load (lbs) Vertical Deflection at End of Bracket (in.) 6m-HF85-OL-4 Test: Ratio of Load Components to Hanger Load Hanger Load (lbs) Horizontal/Hanger Vertical/Hanger Hanger/Hanger Load Component Ratio 120
130 Vertical Load (lbs) Load Cycle Summary Horizontal Load (lbs) Hanger Load (lbs)

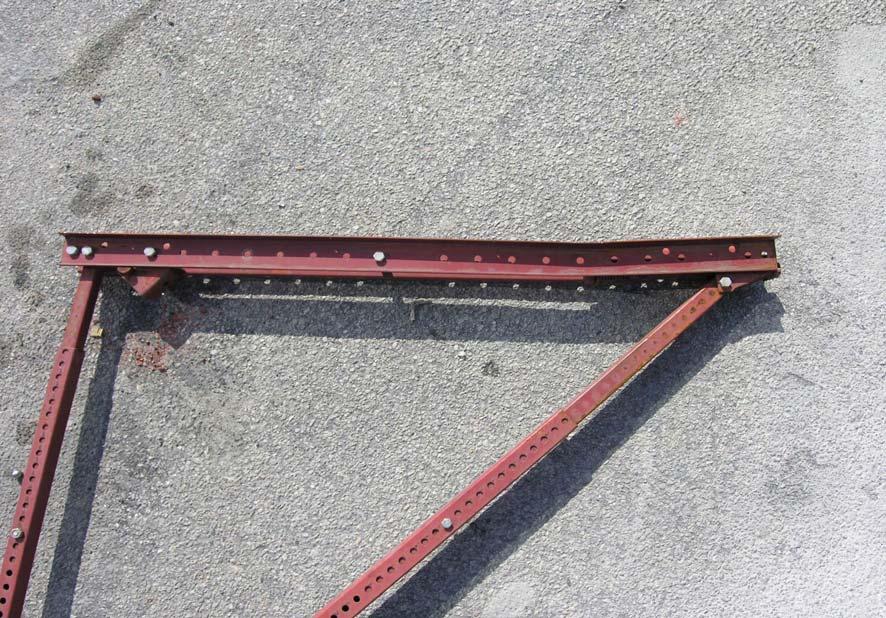
131 6m-HF85-OL-4: HF-85 Bracket at Failure 6m-HF85-OL-4: HF-85 Bracket at Failure 122


132 6m-HF85-OL-4: HF-85 Bracket Horizontal Channels at Failure 6m-HF85-OL-4: Hanger/Flange at End of Test 123

133 6m-HF85-OL-4: Coil Rod at End of Test 124
134 Appendix G 6m-HF85-OI-4 Test Summary Sheets 125
135 Test Summary Sheet Test ID: 6m-HF85-OI-4 (6m Hanger, HF85 Bracket, Outside flange/inclined, Screed at 4 ) Test Date: February 27, 2006 Sponsor: Meadow Burke Products, Inc. Tested By: Emmett Sumner, Ph.D., P.E. and Paul Lackey, E.I. Test Location: Constructed Facilities Laboratory (CFL), NC State University Test Description: Meadow Burke 6m Hanger with HF85 bracket Inclined 8 ; Vertical load applied to bracket at 3-3 7/8 in mild shear reinforcement area of girder Hanger: Coil Rod: Bracket: Girder: Meadow Burke 6m 1/2 in. Meadow Burke Coil Rod Meadow Burke HF-85 NCDOT Modified Bulb Tee 63 in. Concrete Cylinder Strength = 7,500 psi Experimental Results: Maximum Hanger Load = 6,800 lbs Maximum Applied Load = 5,800 lbs Maximum Girder Rotation = rad. Maximum Flange Vertical Displacement = in. Maximum Hanger Horizontal Displacement = in. Maximum Hanger Vertical Displacement = N/A Maximum Bracket Vertical Deflection = in. Test Observations and Notes: At 3,000 lbs (Hanger Load), yielding begins at the bottom of the hanger over bearing plate At 5,500 lbs (Hanger Load), hanger bends down to bear on front of flange At 6,000 lbs (Hanger Load), hanger chips away the front of the flange At 6,800 lbs (Hanger Load), bracket fails Yielding and permanent deformation occurred in the hanger causing the hanger to bend down and bear on the front edge of the flange. The HF-85 bracket experiences some vertical deflection but not permanent bending deformation. Test complete due to a shear puncture in the bracket at the rod connecting the two horizontal channels of the bracket as documented in the photographs. 126

136 6m-HF85-OI-4: Test Setup 127
137 6m-HF85-OI-4 Test: Hanger Load vs. Horizontal Hanger Displacement Hanger Load (lbs) Horizontal Hanger Displacement (in.) 6m-HF85-OI-4 Test: Hanger Load vs. Hanger Bending Deflection Hanger Load (lbs) Instrumentation Error Data Not Available Vertical Bending Deflection (in.) 128
138 6m-HF85-OI-4 Test: Hanger Load vs. Girder Rotation Hanger Load (lbs) Girder Rotation (rad.) 6m-HF85-OI-4 Test: Hanger Load vs. Vertical Flange Displacement Hanger Load (lbs) Vertical Flange Displacement (in.) 129
139 6m-HF85-OI-4: Applied Load vs. Deflection at End of Bracket Applied Vertical Load (lbs) Hanger Load (lbs) Vertical Deflection at End of Bracket (in.) m-HF85-OI-4 Test: Ratio of Load Components to Hanger Load 7000 Hanger Load (lbs) Horizontal/Hanger Vertical/Hanger Hanger/Hanger Load Component Ratio 130
140 Vertical Load (lbs) Load Cycle Summary Horizontal Load (lbs) Hanger Load (lbs)


141 6m-HF85-OI-4: HF-85 Bracket at Failure Puncture Location 6m-HF85-OI-4: HF-85 Bracket Failure Mode 132

142 6m-HF85-OI-4: Hanger at End of Test 6m-HF85-OI-4: Coil Rod at End of Test 133
143 Appendix H 9m-HF96-OL-6 Test Summary Sheets 134
144 Test Summary Sheet Test ID: 9m-HF96-OL-6 (9m Hanger, HF96 Bracket, Outside Flange/Level, Screed at 6 ) Test Date: February 7, 2006 Sponsor: Meadow Burke Products, Inc. Tested By: Emmett Sumner, Ph.D., P.E. and Paul Lackey, E.I. Test Location: Constructed Facilities Laboratory (CFL), NC State University Test Description: Meadow Burke 9m Hanger with HF96 bracket; Vertical load applied to bracket at /4 in High shear reinforcement area of girder Hanger: Coil Rod: Bracket: Girder: Meadow Burke 9m 1 in. Meadow Burke Coil Rod Meadow Burke HF-96 NCDOT Modified Bulb Tee 63 in. Concrete Cylinder Strength = 7,500 psi Experimental Results: Maximum Hanger Load =15,400 lbs Maximum Applied Load = 6,232 lbs Maximum Girder Rotation = rad. Maximum Flange Vertical Displacement = in. Maximum Hanger Horizontal Displacement = in. Maximum Hanger Vertical Displacement = N/A Maximum Bracket Vertical Deflection = in. Test Observations and Notes: At 3,000 lbs (Hanger Load), yielding begins at the bottom of the hanger over bearing plate, hanger begins to bend downward At 6,000 lbs (Hanger Load), yielding begins to occur at the top of the hanger At 7,500 lbs (Hanger Load), hanger bends down to bear onto flange At 9,000 lbs (Hanger Load), hanger chips away and digs into the front of the flange At 14,000 lbs (Hanger Load), hanger continues to rotate down towards the flange, chipping away at the flange At 15,400 lbs (Hanger Load), hanger and girder flange at failure Significant yielding and permanent deformation occurred in the hanger, causing the front tip of the hanger to bear down onto the front of the flange. As the hanger continued to rotate into the flange, the flange was chipped away allowing for more rotation. The HF-96 bracket experienced significant deflections but not permanent deformation. Test complete due to heavy rotation of the hanger. 135

145 9m-HF96-OL-6: Test Setup 136
146 9m-HF96-OL-6 Test: Hanger Load vs. Horizontal Hanger Displacement Hanger Load (lbs) Horizontal Hanger Displacement (in.) 9m-HF96-OL-6 Test: Hanger Load vs. Hanger Bending Deflection Hanger Load (lbs) Instrumentation Error Data Not Available Vertical Bending Deflection (in.) 137
147 9m-HF96-OL-6 Test: Hanger Load vs. Girder Rotation Hanger Load (lbs) Girder Rotation (rad.) 9m-HF96-OL-6 Test: Hanger Load vs. Vertical Flange Displacement Hanger Load (lbs) Vertical Flange Displacement (in.) 138
148 9m-HF96-OL-6: Applied Load vs. Deflection at End of Bracket Applied Vertical Load (lbs) Hanger Load (lbs) Vertical Deflection at End of Bracket (in.) 9m-HF96-OL-6 Test: Ratio of Load Components to Hanger Load Horizontal/Hanger Vertical/Hanger Hanger/Hanger Hanger Load (lbs) Load Component Ratio 139
149 Load Cycle Summary Vertical Load (lbs) Horizontal Load (lbs) Hanger Load (lbs)


150 9m-HF96-OL-6: Bracket Deflection at End of Test 9m-HF96-OL-6: Hanger Rotation/Girder Flange at End of Test 141


151 9m-HF96-OL-6: Back of the Hanger at Girder Rod 9m-HF96-OL-6: Side View of the Back of the Hanger at Girder Rod 142
152 9m-HF96-OL-6: Coil Rod at End of Test 143
153 Appendix I 9m-HF96-OI-5 Test Summary Sheets 144
154 Test Summary Sheet Test ID: 9m-HF96-OI-5 (9m Hanger, HF-96 Bracket, Outside Flange/Inclined, Screed at 5 ) Test Date: March 1, 2006 Sponsor: Meadow Burke Products, Inc. Tested By: Emmett Sumner, Ph.D., P.E. and Paul Lackey, E.I. Test Location: Constructed Facilities Laboratory (CFL), NC State University Test Description: Meadow Burke 9m Hanger with HF-96 bracket inclined 16 ; Vertical load applied to bracket at /16 in mild shear reinforcement area of girder Hanger: Coil Rod: Bracket: Girder: Meadow Burke 9m 1 in. Meadow Burke Coil Rod Meadow Burke HF-96 NCDOT Modified Bulb Tee 63 in. Concrete Cylinder Strength = 7,500 psi Experimental Results: Maximum Hanger Load = 10,500 lbs Maximum Applied Load = 6,500 lbs Maximum Girder Rotation = rad. Maximum Flange Vertical Displacement = in. Maximum Horizontal Hanger Displacement = in. Maximum Vertical Hanger Displacement = N/A Maximum Bracket Vertical Deflection = in. Test Observations and Notes: At 3,000 lbs (Hanger Load), yielding begins at the bottom of the hanger over bearing plate At 6,000 lbs (Hanger Load), yielding begins to occur at the top of the hanger At 6,500 lbs (Hanger Load), hanger bends down to touch front of flange At 8,000 lbs (Hanger Load), hanger chips away the front of the flange At 10,500 lbs (Hanger Load), flange fails in a cone shape (Punching Shear) Yielding and permanent deformation occurred in the hanger causing the hanger to bend down and bear on the front edge of the flange. The HF-96 bracket did experience significant deflection but was not permanently deformed. Test complete due to failure of the flange. 145

155 9m-HF96-OI-5: Test Setup 146
156 9m-HF96-OI-5 Test: Hanger Load vs. Horizontal Hanger Displacement Hanger Load (lbs) Horizontal Hanger Displacement (in.) m-HF96-OI-5 Test: Hanger Load vs. Hanger Bending Deflection Hanger Load (lbs) Instrumentation Error Data Not Available Vertical Bending Deflection (in.) 147
157 9m-HF96-OI-5 Test: Hanger Load vs. Girder Rotation Hanger Load (lbs) Girder Rotation (rad.) 9m-HF96-OI-5 Test: Hanger Load vs. Vertical Flange Displacement Failure of Flange Hanger Load (lbs) Vertical Flange Displacement (in.) 148
158 9m-HF96-OI-5: Applied Load vs. Deflection at End of Bracket Applied Vertical Load (lbs) Vertical Deflection at End of Bracket (in.) Hanger Load (lbs) Hanger Load (lbs) m-HF96-OI-5 Test: Ratio of Load Components to Hanger Load Horizontal/Hanger Vertical/Hanger Hanger/Hanger Load Component Ratio 149
159 Vertical Load (lbs) Load Cycle Summary Horizontal Load (lbs) Hanger Load (lbs)
160 Load Cycle Summary (Cont.) Vertical Load Horizontal Load Hanger Load

161 Displacement 9m-HF96-OI-5: Bending of Hanger 9m-HF96-OI-5: Test Setup at Failure of Flange 152


162 9m-HF96-OI-5: Flange Failure 9m-HF96-OI-5: Hanger at End of Test 153

163 9m-HF96-OI-5: Coil Rod at End of Test 154
164 Appendix J 12m-HF96-OL-5 Test Summary Sheets 155
165 Test Summary Sheet Test ID: 12m-HF96-OL-5 (12m Hanger, HF-96 Bracket, Outside Flange/Level, Screed at 5 ) Test Date: February 8, 2006 Sponsor: Meadow Burke Products, Inc. Tested By: Emmett Sumner, Ph.D., P.E. and Paul Lackey, E.I. Test Location: Constructed Facilities Laboratory (CFL), NC State University Test Description: Meadow Burke 12m Hanger with HF-96 bracket; Vertical load applied to bracket at /16 in high shear reinforcement area of girder Hanger: Coil Rod: Bracket: Girder: Meadow Burke12m 1 in. Meadow Burke Coil Rod Meadow Burke HF-96 NCDOT Modified Bulb Tee 63 in. Concrete Cylinder Strength = 7,500 psi Experimental Results: Maximum Hanger Load Maximum Applied Load Maximum Girder Rotation Maximum Flange Vertical Displacement Maximum Horizontal Hanger Displacement Maximum Vertical Hanger Displacement Maximum Bracket Deflection = 13,550 lbs = 7,890 lbs = rad. = in. = in. = in. = in. Test Observations and Notes: At 3,000 lbs (Hanger Load), yielding begins at the bottom of the hanger over bearing plate At 6,000 lbs (Hanger Load), yielding begins to occur at the top of the hanger At 10,000 lbs (Hanger Load), small crack forms in flange at hanger centerline At 12,000 lbs (Hanger Load), cracks form in top of flange behind bearing plate At 13,550 lbs (Hanger Load), cracks from upper portion of flange propagate to front of flange, flange fails in a cone shape (Punching Shear) Although yielding and permanent deformation occurred in the hanger, the deformation of the hanger was not significant and the tip of the hanger never deformed to touch the flange. The HF-95 bracket did experience significant deflection but was not permanently deformed. Test complete due to failure of the flange. 156

166 12m-HF96-OL-5: Test Setup 157
167 12m-HF96-OL-5 Test: Hanger Load vs. Horizontal Hanger Displacement Hanger Load (lbs) Horizontal Hanger Displacement (in.) m-HF96-OL-5 Test: Hanger Load vs. Hanger Bending Deflection Hanger Load (lbs) Vertical Bending Deflection (in.) 158
168 12m-HF96-OL-5 Test: Hanger Load vs. Girder Rotation Hanger Load (lbs) Girder Rotation (rad.) 12m-HF96-OL-5 Test: Hanger Load vs. Vertical Flange Displacement Flange Failure Hanger Load (lbs) Vertical Flange Displacement (in.)
169 12m-HF96-OL-5: Applied Load vs. Deflection at End of Bracket Applied Vertical Load (lbs) Vertical Deflection at End of Bracket (in.) Hanger Load (lbs) Ratio of Load Components to Hanger Load Horizontal/Hanger Vertical/Hanger Hanger/Hanger Hanger Load (lbs) Load Component Ratio 160
170 Load Cycle Summary Vertical Load (lbs.) Horizontal Load (lbs.) Hanger Load (lbs.)


171 12m-HF96-OL-5: Test Setup at End of Test 12m-HF96-OL-5: Underside of Flange at Failure 162


172 12m-HF96-OL-5: Hanger at End of Test 12m-HF96-OL-5: Yielding of Hanger 163
173 12m-HF96-OL-5: Coil Rod at End of Test 164
174 Appendix K 12m-HF96-IL-5 Test Summary Sheets 165
175 Test Summary Sheet Test ID: 12m-HF96-IL-5 (12m Hanger, HF96 Bracket, Inside Flange/Level, Screed at 5 ) Test Date: February 8, 2006 Sponsor: Meadow Burke Products, Inc. Tested By: Emmett Sumner, Ph.D., P.E. and Paul Lackey, E.I. Test Location: Constructed Facilities Laboratory (CFL), NC State University Test Description: Meadow Burke 12m Hanger with HF-96 bracket; Vertical load applied to bracket at /16 in high shear reinforcement area of girder Hanger: Coil Rod: Bracket: Girder: Meadow Burke 12m 1 in. Meadow Burke Coil Rod Meadow Burke HF-96 NCDOT Modified Bulb Tee 63 in. Concrete Cylinder Strength = 7,500 psi Experimental Results: Maximum Hanger Load =12,700 lbs Maximum Applied Load = 7,064 lbs Maximum Girder Rotation = rad. Maximum Flange Vertical Displacement = in. Maximum Hanger Horizontal Displacement = in. Maximum Hanger Vertical Displacement = in. Maximum Bracket Vertical Deflection = in. Test Observations and Notes: At 3,000 lbs (Hanger Load), yielding begins at the bottom of the hanger over bearing plate At 6,000 lbs (Hanger Load), yielding begins to occur at the top of the hanger At 10,500 lbs (Hanger Load), small crack forms in flange at hanger centerline At 12,000 lbs (Hanger Load), cracks form in top of flange behind hanger bearing plate At 12,700 lbs (Hanger Load), cracks from upper portion of flange propagate to front of flange, flange fails in a cone shape (Punching Shear) Although yielding and permanent deformation occurred in the hanger, the deformation of the hanger was not significant and the tip of the hanger never deformed to touch the flange. The HF-95 bracket experienced relatively low vertical deflection and was not permanently deformed. Test complete due to failure of the flange. 166

176 12m-HF96-IL-5: Test Setup 167
177 12m-HF96-IL-5 Test: Hanger Load vs. Horizontal Hanger Displacement Hanger Load (lbs) Horizontal Hanger Displacement (in.) 12m-HF96-IL-5 Test: Hanger Load vs. Hanger Bending Deflection Hanger Load (lbs) Vertical Bending Deflection (in.) 168
178 12m-HF96-IL-5 Test: Hanger Load vs. Girder Rotation Hanger Load (lbs) Girder Rotation (rad.) 12m-HF96-IL-5 Test: Hanger Load vs. Vertical Flange Displacement Flange Failure Hanger Load (lbs) Vertical Flange Displacement (in.)
179 12m-HF96-IL-5: Applied Load vs. Deflection at End of Bracket Applied Vertical Load (lbs) Hanger Load (lbs) Vertical Deflection at End of Bracket (in.) 12m-HF96-IL-5 Test: Ratio of Load Components to Hanger Load Hanger Load (lbs) Horizontal/Hanger Vertical/Hanger Hanger/Hanger Load Component Ratio 170
180 Vertical Load (lbs.) Load Cycle Summary Horizontal Load (lbs.) Hanger Load (lbs.)


181 12m-HF96-IL-5: Girder Flange at Failure 12m-HF96-IL-5: Hanger at End of Test 172
182 12m-HF96-IL-5: Coil Rod at End of Test 173
183 Appendix L A-12m-H Test Summary Sheets 174
184 Test Summary Sheet Test ID: Sponsor: Tested By: Test Location: Program: A-12m-H Meadow Burke Products, Inc. Emmett Sumner, Ph.D., P.E. and Paul Lackey, E.I. Constructed Facilities Laboratory (CFL), NC State University ANACAP Model Description Meadow Burke 12m Hanger model, high shear reinforcement Element Type B8-3D Material Properties Concrete Concrete Strength = 7,500 psi Young s Modulus = 5,250,000 psi Mass Density = pcf Poisson s Ratio = Rebar and Anchor Yield Strength = 60,000 psi Young s Modulus = 29,000,000 psi Poisson s Ratio = 0.3 #5 Bar Area = in.2 Prestressing Strand Grade = 270 Young s Modulus = 28,500,000 psi Yield Strength = 100,000 psi Ultimate Strength = 118,000 psi Area = in. 2 Load Type: Static Experimental Results Maximum Applied Vertical Load Maximum Flange Vertical Displacement at Centerline = 9,092 lbs = in. 175
185 Fixed Plane Vertical Pressure Load Horizontal Pressure Load Plane of Symmetry A-12m-H Boundary Conditions ½ L.R. Grade 270 Prestressed Strand #5 Bars 12 A-12m-H Rebar and Prestressing Strand Layout 176

186 A-12m-H Crack Pattern at 3,120 lb. Applied Vertical Load A-12m-H Crack Pattern at 6,900 lb. Applied Vertical Load A-12m-H Crack Pattern at 8,800 lb. Applied Vertical Load 177
187 12m-1-H vs. Anacap Flange Vertical Displacement Comparison Hanger Load (lbs) A-12m-H Deflection 12m-1-H Deflection Vertical Deflection (in.) 178
188 Appendix M A-12m-M Test Summary Sheets 179
189 Test Summary Sheet Test ID: Sponsor: Tested By: Test Location: Program: A-12m-M Meadow Burke Products, Inc. Emmett Sumner, Ph.D., P.E. and Paul Lackey, E.I. Constructed Facilities Laboratory (CFL), NC State University ANACAP Model Description Meadow Burke 12m Hanger model, mild shear reinforcement Element Type B8-3D Material Properties Concrete Concrete Strength = 7,500 psi Young s Modulus = 5,250,000 psi Mass Density = pcf Poisson s Ratio = Rebar and Anchor Yield Strength = 60,000 psi Young s Modulus = 29,000,000 psi Poisson s Ratio = 0.3 #5 Bar Area = in.2 Prestressing Strand Grade = 270 Young s Modulus = 28,500,000 psi Yield Strength = 100,000 psi Ultimate Strength = 118,000 psi Area = in. 2 Load Type: Static Experimental Results Maximum Applied Vertical Load Maximum Flange Vertical Displacement at Centerline = 8,449 lbs = in. 180
190 Fixed Plane Vertical Pressure Load Horizontal Pressure Load Plane of Symmetry A-12m-M Boundary Conditions ½ L.R. Grade 270 Prestressed Strand #5 Bars 24 A-12m-M Rebar and Prestressing Strand Layout 181
191 A-12m-M Crack Pattern at 3,200 lb. Applied Vertical Load A-12m-H Crack Pattern at 6,000 lb. Applied Vertical Load A-12m-M Crack Pattern at 8,700 lb. Applied Vertical Load 182
192 12m-2-M vs. Anacap Flange Vertical Displacement Comparison Hanger Load (lbs) A-12m-M Deflection 12m-2-M Deflection Vertical Deflection (in.) 183
193 Appendix N A-6m/9m-H Test Summary Sheets 184
194 Test Summary Sheet Test ID: Sponsor: Tested By: Test Location: Program: A-6m/9m-H Meadow Burke Products, Inc. Emmett Sumner, Ph.D., P.E. and Paul Lackey, E.I. Constructed Facilities Laboratory (CFL), NC State University ANACAP Model Description Meadow Burke 6m or 9m Hanger model, high shear reinforcement Element Type B8-3D Material Properties Concrete Concrete Strength = 7,500 psi Young s Modulus = 5,250,000 psi Mass Density = pcf Poisson s Ratio = Rebar and Anchor Yield Strength = 60,000 psi Young s Modulus = 29,000,000 psi Poisson s Ratio = 0.3 #5 Bar Area = in.2 Prestressing Strand Grade = 270 Young s Modulus = 28,500,000 psi Yield Strength = 100,000 psi Ultimate Strength = 118,000 psi Area = in. 2 Load Type: Static Experimental Results Maximum Applied Vertical Load Maximum Flange Vertical Displacement at Centerline = 9,257 lbs = in. 185
195 Fixed Plane Vertical Pressure Loads Horizontal Pressure Load Plane of Symmetry A-6m/9m-H Boundary Conditions ½ L.R. Grade 270 Prestressed Strand #5 Bars 12 A-6m/9m-H Rebar and Prestressing Strand Layout 186
196 A-6m/9m-H Crack Pattern at 4,000 lb. Applied Vertical Load A-6m/9m-H Crack Pattern at 6,100 lb. Applied Vertical Load A-6m/9m-H Crack Pattern at 8,700 lb. Applied Vertical Load 187
197 9m-1-H vs. Anacap Flange Vertical Displacement Comparison Hanger Load (lbs) Experimental Test Incomplete A-6m/9m-H Deflection 9m-1-H Deflection Vertical Deflection (in.) 188
198 Appendix O A-6m/9m-M Test Summary Sheets 189
199 Test Summary Sheet Test ID: Sponsor: Tested By: Test Location: Program: A-6m/9m-M Meadow Burke Products, Inc. Emmett Sumner, Ph.D., P.E. and Paul Lackey, E.I. Constructed Facilities Laboratory (CFL), NC State University ANACAP Model Description Meadow Burke 6m or 9m Hanger model, mild shear reinforcement Element Type B8-3D Material Properties Concrete Concrete Strength = 7,500 psi Young s Modulus = 5,250,000 psi Mass Density = pcf Poisson s Ratio = Rebar and Anchor Yield Strength = 60,000 psi Young s Modulus = 29,000,000 psi Poisson s Ratio = 0.3 #5 Bar Area = in.2 Prestressing Strand Grade = 270 Young s Modulus = 28,500,000 psi Yield Strength = 100,000 psi Ultimate Strength = 118,000 psi Area = in. 2 Load Type: Static Experimental Results Maximum Applied Vertical Load Maximum Flange Vertical Displacement at Centerline = 8,125 lbs = in. 190
200 Fixed Plane Vertical Pressure Loads Horizontal Pressure Load Plane of Symmetry A-6m/9m-M Boundary Conditions ½ L.R. Grade 270 Prestressed Strand #5 Bars 24 A-6m/9m-M Rebar and Prestressing Strand Layout 191

201 A-6m/9m-M Crack Pattern at 4,000 lb. Applied Vertical Load A-6m/9m-M Crack Pattern at 6,100 lb. Applied Vertical Load A-6m/9m-M Crack Pattern at 7,800 lb. Applied Vertical Load 192