Load Ratings of Historic Covered Timber Bridges
|
|
|
- Amberlynn Lee
- 5 years ago
- Views:
Transcription


1 Load Ratings of Historic Covered Timber Bridges 53 rd Annual ACE Conference Bend, Oregon September 2014


 by FPL and its")
2 National Historic Covered Bridge Program Goal is to preserve, restore, and rehabilitate 800+ bridges remaining in USA Includes a comprehensive program focused on the historical, research, and educational aspects of covered bridges More than 25 research projects currently underway (or completed) by FPL and its various research partners
3 Acknowledgements Key Collaborators: ISU: Doug Wood, Dr. Terry Wipf, Dr. Junwon Seo, Dr. Fouad Fanous, Allison Machtemes, Owen Stephes, Justin Dahlberg, Venkata Kollipara FPL: Doug Rammer Numerous City, County, and State employees from Indiana and Vermont who assisted with load testing, provided vehicles and traffic control
4 Outline Introduction Methodology Cox Ford Bridge Field Testing Test Results Analytical Modeling Load Rating
5 Introduction All bridges, including historic covered bridges, open to vehicular traffic are required to be load rated No established testing or rating procedures for covered timber bridges currently available Load tested bridges often found to perform better than currently assigned ratings Need for the development of additional guidance on field testing and load rating procedures for historic covered timber bridges
6 Methodology Live load test selected bridges Generate analytical model (2D, simplistic) Calibrate model using live load data Apply rating vehicles to calibrated model Develop testing and rating manual for covered timber bridges

7 Burr-Arch Trusses State of Indiana Bridge Span (ft) Load limit (ton) Zacke Cox Portland Mills Cox Ford surviving bridges
8 Queen Post Trusses State of Vermont Bridge Span (ft) Load limit (ton) Warren 46 5 Flint 88 3 Moxley 55 4 Slaughterhouse surviving bridges
9 Howe Truss Bridges State of Indiana Bridge Span (ft) Load limit (ton) James Scipio Dick Huffman* Rob Roy* surviving bridges * 2 simple span trusses supported by intermediate pier

10 Example - Cox Ford Bridge Burr Arch, built 1913 Parke County, Indiana Single, simply supported 192 ft (58.5m) span Posted limit - 5 ton
, Truck 2 (~19,000lb)")

11 Field Testing Static Load Truck 1 (~10,500lb), Truck 2 (~19,000lb) Displacement Global Strain Member strains (verticals, diagonals, TC, BC, etc) Truck 1 Truck 2


12 Field Testing Cont. Typical sensor setup: Deflection and Strain


13 Field Testing Cont.


14 Field Testing Cont. Static Loading To Collect Deflection & Strain Envelope Data
15 Field Testing Cont. Static Loading To Collect Deflection & Strain Envelope Data
16 Field Test Results Two Key Goals of Collecting Field Data: 1. Quantitatively AND Qualitatively evaluate response of Structure: Transverse load distribution Elastic response End restraint Truss member response; fixity in member connections 2. Calibrate analytical model
17 Field Test Results Midspan Global Displacements
18 Field Test Results Strain, Diagonal Truss Member

19 Analytical Modeling Model Generation STAAD Linear elastic approach 2-D (one truss)
20 Analytical Modeling Initially Pinned-Pinned Bottom Chord = continuous, beam elements Top Chord = continuous, beam elements Diagonal/Verticals = beam elements Arch = compression elements
21 Model Calibration Response Parameter Strain Compare: F S vs A.S S F S - Field strain (measured during live load test) A.S S - model strain (strain computed from analytical model) Percent deviation = F.S A.S 2 F.S 2 Modify model parameters (dimensions, E, etc.) Re-evaluate percent deviation until model response correlates with field response *Result = Calibrated model for load rating*
22 Model Calibration Cont. Pinned-Pinned revised to Fixed-Fixed Response bounded by P-P, F-F as expected HOWEVER, rather than modifying end restraint with complex joint fixity parameters (springs), a simpler, more straight forward approach was developed to obtain an accurate model: Fixed supports, pinned member connections, truss elements for verticals/diagonals/tc, beam element for BC Model correlation with field data improved from 40-50% to 75-85%
23 Micro strain Graphical Calibration: Analytical bottom Field top Field bottom Analytical top Top Chords Distance of front axle from end of abutment (m)
24 Micro strain Graphical Calibration: 200 Bottom Chords Analytical bottom Field top Field bottom Analytical top Distance of front axle from end of abutment (m)
25 Micro strain Graphical Calibration: Verticals Analytical Field top Field bottom Distance of front axle from end of abutment (m)
26 Micro strain Graphical Calibration: 30 Diagonals Analytical bottom Field top Field bottom Analytical top Distance of front axle from end of abutment (m)
27 Load Rating Create calibrated analytical model Dead loads Live loads (AASHTO LRFR Manual) Impact factor Calculate member capacities Perform load rating input live load vehicle data into model to run simulated rating load on calibrated analytical model
(LL+IM) where: C = Capacity; γ DC = dead-load factor; DC = dead load; γ L = live-load factor; LL = live load; IM = dynamic load factor")
28 Load Rating Computations: AASHTO LRFD approach to Load Rating HL-93 (320kN) = HS20 truck plus superimposed lane load RF = C (γ DC)(DC) (γ L )(LL+IM) where: C = Capacity; γ DC = dead-load factor; DC = dead load; γ L = live-load factor; LL = live load; IM = dynamic load factor
29 Load Rating Computations: Single Force Component: Axial or Bending Axial Calculate member capacity, C Check lateral buckling (compression) Calculate unfactored member response to loading, DC & LL RF = C γ DC DC γ DW DW ± γp (P) γ L (LL+IM) Bending Calculate member moment capacity, C Calculate unfactored member response to loading, DC & LL RF = C γ DC DC γ DW DW ± γp (P) γ L (LL+IM)
30 Load Rating Computations: Combined Forces: Axial PLUS Bending Bottom Chord M r - Flexural Bending Capacity P r - Axial (tension or compression) Capacity M u - Factored Bending Response P u - Factored Axial Response Evaluate Interaction Eq. (IE) for Combined Loading => Load Rating Mu Mr + Pu Pr x 1 x = 1 in tension, 2 in compression If IE 1, member capacity ok If IE > 1, member capacity insufficient
31 Load Rating Computations: If IE > 1, we need to calculate the live load reduction factor (load rating) that makes IE = 1 Mu Mr + Pu Pr Where, x 1 => {(a1 *z)+c 1 }+{(a 2 *z)+c 2 }=1 a 1 = live load response to flexure c 1 = dead load response to flexure a 2 = live load response to axial c 2 = dead load response to axial z = live load reduction factor = load rating (M u /M r ) (P u /P r )
32 Summary Field testing of Burr Arch, Howe and Queen Post Total of 11 bridges completed Analytical models calibrated for all bridges Developed new recommended practices for live load testing, modeling and load rating of historic covered bridges New engineer s guide for live load testing, modeling and load rating of historic covered bridges in draft form
33 Future Work Phase II - Test remaining truss types bridge clusters (PA, VT, IN) King Post Town Lattice Burr Arch Field work to focus more closely Truss joint load-slip behavior Bottom chord behavior


34 Thanks for your Attention. woodcenter.org


35 Burr-Arch Truss Bridges


36 Queen Post Truss Bridges


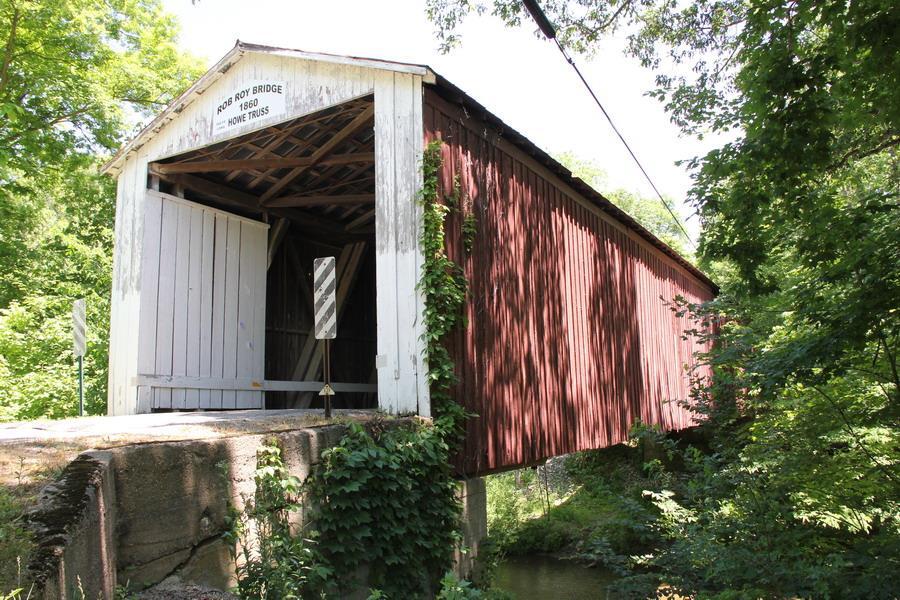

37 Howe Truss Bridges