G.Muttrah Commercial & Residential Complex Muscat, Sultanate of Oman
|
|
|
- Douglas Jacobs
- 5 years ago
- Views:
Transcription


1 G.Muttrah Commercial & Residential Complex Muscat, Sultanate of Oman Technical Report III Samir Al-Azri Structural Option Consultant: December 1 st, 2009 Page 1
2 Table of Contents I. Executive summary. II. Introduction. III. Structural System Overview IV. Design Loads... V. Loads and Load Cases. VI. Lateral System. VII. ETABS Model. VIII. Analysis... IX. Appendices Appendix A- Calculations Appendix B- Shear Wall Details Page 2
3 Executive Summary The lateral system of the G.Muttrah Commercial and Residential complex consists of ten shear walls at the core of the building. Three of the shear walls are connected and the majority run along the North-South direction. In this technical report, the lateral system of the will be analyzed using ETABS, a three-dimensional structural building design and analysis software. Hand calculations will also be performed to check the results from ETABS in order to have a more accurate analysis. Since the British Standards direct the design, the metric unit was used in the original design of the G.Muttrah building. This report will however analyze the building using United States Customary System (English units). The conversions will be accurately approximated and also increased or decreased depending on the calculation in order to obtain a conservative result. Values will hence be reported in English units. The results obtained from ETABS were close to the hand calculations, thus proving that they are correct. The difference in the values is caused by the over simplification of the hand methods. The deflection values of the building under the lateral loads calculated were checked and satisfied the requirements. The story drifts and shear checks of the members also satisfied the requirements, while a torsional shear and moment was discovered to drive the design due to the layout of the shear walls. The Overturning moment was also large which explained the mat foundation used by the engineer. The ETABS model turned out to be an efficient way of modeling the later system, but a more complete model design of the building would yield more accurate results since other building members such as columns can add to the stiffness and resistance of torional forces. Further details of the analysis are provided in the report. Page 3

4 Introduction The G.Muttrah Commercial & Residential Complex is a mixed use building in a commercially developing region in the city of Muscat, Sultanate of Oman. Covering an area of approximately 280,000 square feet, the reinforced concrete building will consist of eight floors excluding the parking at the basement level. Retail space will occupy the ground floor, offices in the second floor and 96 apartments in the rest of the 6 floors. A set back of about 35 feet from the north side starts from the fourth floor onwards. The parking garage in the basement will serve 115 slots for the tenants due to the limited parking spaces in the area. More parking spaces will be available around the perimeter of the building which will only provide space for 63 cars. The typical floor height is 10 ft for the basement level, 14 ft for the retail, 12 ft for the offices and 10 ft on the rest of the residential floors. A flat roof is used to place all the HVAC equipment. The plot has a slope of about 10 ft from the northwest corner to the southeast corner. This slope is used to incorporate the basement level as a parking garage. The ground level is set at 2.6 ft cm below grade while the basement level floor is constructed at 12 ft below grade (Figure 1). Like a typical parking garage, the concrete reinforced columns are placed in a rectangular grid in order to accommodate all the spaces and for ease of transportation. Figure 1: A section showing the entrance of the garage level Page 4
5 Structural System Overview Summary The G.Muttrah Commercial & Residential Complex is a reinforced concrete frame building with shear walls. The flooring system consists of a combination of reinforced concrete flat plate slabs on some floors, and typical two way slabs on beam frame system on the others. The dimensions of the building plan are about 300ft by 132ft. The typical roofing/floor system span is between 10ft and 30ft. The material strength used is approximately 5,500 psi strength concrete and 60,000 psi steel strength. Finally, the roof of the building is a 6 in thick slab that only has to carry the loads from the mechanical equipment on the rooftop. There are no snow loads for this building since the weather statistics show that the chances of snow in Oman are slim to none. Floor Slabs & Beams The second and third floor of the G.Muttrah complex consists of a flat plate slab system with drop panels. The floors have 2 varying slab thickness; one at 10in slab thickness with a drop panel of 14in and reinforcement of # 3 s and #4 s in U.S standard. The second is at 14in slab thickness with a drop panel of 22in and reinforcement of #5 s (see figure 2). The rest of the floors have a typical two-way slab system with slabs thickness varying from 6in to 8in. The slabs are supported by the usual rectangular beams that range from 6in x 20in to 32in x 20in. Figure 2: Flat plate slab and column on the second floor Page 5
6 Foundation & Columns As for the foundation, a 4 ft thick mat slab is used to carry the loads from the different columns. The mat slab is reinforced with 2 layers of #20 s and 2 layers of # 10 s mesh running both ways. Gravity loads from the building are carried down through reinforced concrete columns that are aligned together in a simple grid, with the majority running throughout the entire building. The columns have a base at the foundation slab level (see figure 2) and range between 14in x 21in to 28in x 47in. Figure 3: Typical column base at foundation level Lateral System Shear walls are used to resist the lateral force in the G.Muttrah complex. The shear walls are located in the core of the building and start at a thickness of 14in at the basement and decrease to 8in as they reach the roof. These walls run in the North-South direction which is expected since that is the weaker axis due to the wind direction and exposure to a larger surface area. There is only one shear which runs in the East-West direction. Page 6
7 Design Loads The codes for the original design of the building are from The British Standards (BS8110). The codes used by the engineer are currently unavailable for comparison; however, below is a list of the loads from ASCE 7-05 which were used in this analysis of this report. Live Loads: Table 1 Occupancy Load (psf) Parking 40 Entry 100 Office 50 Retail 100 Residential 40 Corridor 100 Restrooms 100 Roof 20 Stairs 100 Ramps (vehicle) 250 Sidewalk 250 Exterior 100 Dead Loads Table 2 Material/Occupancy Normal Weight Concrete Floor Superimposed Roof Superimposed Facade Load (psf) 150 pcf 15 psf 30 psf 30 psf Page 7

8 Loads and Load Cases The loads used in this report are from the wind and seismic analysis from Tech report 1. As mentioned in Tech report 1, the wind speed in the sultanate of Oman averages around 75mph which results in loads significantly lower than those expected in the United States. The seismic loads were also estimated based on the lowest loads allowed by code since the Sultanate of Oman is located in a seismic safe zone. More calculations and details for lateral loads can be found in Appendix A. The following is a summary of the loads: Figure 4: Wind Loads on North South Face Page 8

9 Figure 5 Wind Loads on East West Face Figure 6: Seismic Loads on East West face Page 9
10 The load combinations examined are from the ASCE 7-05 which resulted in controlling load combination of 1.2 D L + 0.8W. This load combination also satisfies many of the assumptions made for analysis such as low seismic force due to the building being located in a seismic safe zone. Other factors such as rain and snow load were not taken into consideration. Different wind load cases from ASCE 7-05 were also studied. The following figure shows how the different cases were applied to the building for analysis: Figure 7: Wind Load Cases Page 10
11 Lateral System Analysis As mentioned earlier in the report, the lateral force resisting systems consists of shear walls within the core of the building. Most of the shear walls are spread out about the East-West direction running along the North-South axis. The following plan highlights the location of the shear walls in the building. Figure 8: Location of shear walls in the building (shear walls highlighted in red) The loads resisted (wind/seismic) are transferred through the floors which act as diaphragms. Each shear wall receives a load based on its relative stiffness. The walls then behave like cantilevered beams and carry the loads down to the foundation. A hand calculation was used to determine the relative stiffnesses of the shear walls. A load of 1000 kips was applied at the top of the wall and the following equation was used to calculate the deflection of the wall: Eqn. 1 Page 11
12 The stiffness of the walls was then calculated by taking the reciprocal of the deflection. Keep in mind that this hand calculated method is only an approximation of the real stiffness. In reality, the shear walls act differently since three of them are connected together. The calculated stiffness assumes that the walls function separately. The thickness of the wall was also assumed to be uniform throughout the entire height of the building for simplification. In addition, the calculated stiffness value was assumed to be the same for each floor. The difference in K values is small between floors and can be ignored. For the purpose of this report, the calculated values are close enough to reality for analysis. The following figure shows the shear walls with their labels while the table provides the relative stiffness of each wall. WALL FORC E HEIGHT WIDT H Figure 9: Labels of shear walls THICNKES S FLEXURE SHEAR TOTAL R I RELATIVE STIFFNES S E E E E E E E E E Table 3: Stiffness Factors of Shear Walls Total Page 12


13 ETABS Model The lateral system of the building was designed with the aid of ETABS, a threedimensional structural building design and analysis software. In order to simplify the design and get a better understanding, the lateral system was designed independent of the remainder of the building. Only the shear walls and diaphragms were included in the model for analysis. Other minor assumptions include ignoring the angled corners and small openings in the diaphragm. The ETABS model was used to calculate the center of rigidity, center of mass, deflections and story drifts. Hand calculations were used to check the deflections and story drifts while the center of mass and rigidity were assumed to be correct since the building has a simple rectangular shape. More details on the results from ETABS are found in the Appendix. The following figures show the model created for analysis: Figure 10: View of shear walls only Figure 11: View of shear walls with diaphragms Page 13
14 Torsion Using ETABS, it was revealed that the center of pressure does not act on the center of mass which results in a torsional moment that has to be taken into account in the design process. Hand calculations were used to determine the torsional moments caused by the wind loads on the buildings. Table 4 shows the location of the center of mass and center of rigidity calculated from ETABS while Table 5 summarizes the torsional moments on the building. Story Diaphragm MassX MassY XCM YCM XCCM YCCM XCR YCR ROOF D TH D TH D TH D TH D TH D RD D ND D GROUND D Average Table 4: Center of mass and rigidity from ETABS The torsional moment in the N-S direction is greater than the E-W direction due to the larger difference between the center of mass and center of rigidity of the building. The shear walls are aligned closer together in the E-W direction while also being positioned closer to the center of mass. This formation would however result in a greater torsional shear which can be seen in table 6 and 7. The shear walls are concentrated in the core of the building causing a greater torsional shear in the E-W direction which must also be taken into account while design the walls. M tor N S M tor E W Total Table 5: Calculated torsional moments Page 14
15 Wall Stiffness Shear Loc. of Wall N S Direction Dist. From COR COM to COR Torsional Direct Total Shear E W E W E W E W E W Wall Stiffness Shear Table 6: Torsional shear at 2 nd story in N W direction Loc. of Wall E W Direction Dist. From COR COM to COR Torsional Direct Total Shear 1 1 N S N S N S N S N S 1 2 N S N S N S N S N S 1 3 N S N S N S N S N S 2 1 N S N S N S N S N S N S N S N S N S N S 3 1 N S N S N S N S N S 3 2 N S N S N S N S N S 4 N S N S N S N S N S 5 N S N S N S N S N S The following equation was used to determine the torsional shear: Table 7: Torsional shear at 2 nd story in E W direction. The total shear will be used to check if the members are adequate later on in the report. Page 15
16 Deflection and Story Drift The deflections caused by the different wind loads studied were compared to the L/400 requirement. Both ETABS output results and hand calculations passed the check of L/400 which is The following tables summarize the deflections calculated. Notice that the deflections in the E-W directions are great than the N-S direction. This can be explained by the one shear wall only resisting the loads in the E-W direction. A possible hypothesis for the shear wall design in the E-W direction is that the engineer might have used a different wind load distribution that resulted in less wind being exposed to the E-W face of the building. Surrounding buildings might also disturb the flow of the wind since the front and the back of the building are in the South and North face respectively. Wind Case 1 Wind Case 2 Wind Case 3 Wind Case 4 Seismic Max Deflection Drift N S E W N S E W N S E W N S E W N S E W Table 8: Deflections of different load cases from ETABS The hand calculated deflections are lower than the ETABS value due to the simplification in the method used. Nonetheless, the approximated values from the hand calculation confirm that the ETABS are correct. Hence deflection check passes for the wind and seismic loads. An example of the hand calculation can be found in Appendix A. Walls Story Total Roof Table 9: Deflections of Wind case 1 hand calculated Page 16
17 Although records from the engineer state that seismic loads should not control, story drifts for the lowest allowable seismic loads were still checked. The seismic load was applied at the center of mass of the model. The drifts are compared to the 0.02h sx requirement from ASCE7-05. The following tables provide the story drifts from ETABS and hand calculations: At 8 th floor: 0.02 h sx = 0.02(10 x12) = 2.4 > Okay At 2 nd floor: 0.02 h sx = 0.02(14 x12) = 3.36 > Okay Story Drift Roof Table 10: Seismic Wall 5 Story Drift from ETABS At 8 th floor: 0.02 h sx = 0.02(10 x12) = 2.4 > Okay At 2 nd floor: 0.02 h sx = 0.02(14 x12) = 3.36 > Okay Story Drift Roof Table 10: Seismic Wall 5 Story Drift from Hand Calc. Again the values from the hand calculations differ from the ETABS value but with a higher value this time around. This is also due to the simplification of the hand method and also ETABS calculates the weights of the masses more accurately. Drift does not control the design since the building is more likely to twist in torsion. Page 17
18 Shear Check and Overturning A hand calculation spot check was carried to check the shear capacity and overturning moments of the members. The overturning moment calculation for wall 1 in the North-South direction resulted in a moment of 2756 k-ft caused by the wind loads. The resisting moment due to self weight was about 360 k-ft. This problem is solved by the large mat foundation used by the engineer to counter the overturning moment. Detailed calculations are provided in Appendix A. The critical member checked for shear was also wall 1 in the North-South direction due to wind load. The point checked was on the 2 nd story where the total shear, including torsional, on the wall is 41k. The (2) #5 6 horizontally and (2) #6 6 vertically were sufficient to carry the applied load. Refer to appendix A for the detailed calculation. Page 18
19 Conclusion The ETABS software demonstrated a great ability in analyzing the structural system of a building. Results from the lateral analysis of the turned out to be close to the approximated hand calculation methods. A more vigorous analysis with a complete building model would be needed in order to get more accurate results. This is due to the fact that the different structural members of a building would change the stiffness of the building and hence affect the lateral system. The controlling load combination after analysis proved to be 1.2 D L + 0.8W. In addition, four wind load cases were examined which resulted in more deflection in the E-W direction than the N-S direction. This increase in deflection can be caused by different load combination used by the engineer, or other surrounding conditions that might affect the wind distribution onto the building. The deflections calculated from ETABS and hand calculations both satisfied deflection requirements. Story drifts and shear check also passed their respective requirements while a tosional shear and moment resulted from the layout of shear walls in the building. The increase in torsional moment in the E-W axis was due to the fact that the shear walls were concentrated in the middle core leading to a greater shear force on the building. An overturning moment also resulted from the wind load which was counteracted by the large mat foundation that holds the shear walls in place. The results from this technical report can be used to create a basic model for the thesis proposal. A more precise analysis can be executed with more details in order to create a model similar to the original design. Page 19
20 Appendix A: Calculations Page 20
21 Wind Table A 1 Mean Velocity(mph) 75 Provided by engineer Occupancy Category IBC II IBC Exposure Category B Directionality Factor K d * 0.85 ASCE 7 05 Importance Factor. I 1 ASCE 7 05 Topographic Factor K zt 1 ASCE 7 05 Velocity Factor q z = K z k zt k d v 2 I Table Velocity Coefficient K z Table α 7 Z g 1200 ε 1/3.0 l 320 c 0.3 β 1 (Assumed) b 0.45 Building Frequency η Structure is flexible Peak Factors g q 3.4 Peak Factors g v 3.4 Peak Factors g R 4.18 Turbulence Factor Z 57.6 >z min = 30' Intensity of Turbulence I z Integral Length L z 385 Background Response Q 0.83 Mean Wind Speed V 56.8 Reduced Frequency N R n R h for η=7.62 R b for η=10.5 R L 0.12 for η=79.7 Resonant Response (N S) Resonant Response Gust Effect Factor 0.83 (N S) Gust Effect Factor 0.82 Page 21
22 Building is Enclosed k p 0.99 q p GC pn GC pn 1.5 Windward ( 1.0) Leeward P p windward Pp Leeward High Rise building GC pi 0.18 or 0.18 External Pressure Coefficient Windward C p 0.8 Leeward (N S) C p 0.5 L/B=.44 Leeward (E W) C p 0.5 L/B=2.27 Sidewall C p 0.7 North South Height= 96 ft B= 300 L= 132 Location Height (Ft) K z q z P z (psf) Table A 2 P z (Kips) M o (ftkips) Windward Leeward ALL Page 22
23 East West Height= 96 ft B= 132 L= 300 Location Height (Ft) K z q z P z (psf) Table A 3 P z (Kips) M o (ftkips) Windward Leeward ALL Seismic Concrete Floor superimposed Roof superimposed Façade Table A 4 150pcf 10psf 30psf 30psf Table A 5 Design Category A Cs 0.01 Slab Area(sqft) Slab thickness(ft) Weight Ground nd rd th th th th th Page 23
24 Roof Total= Table A 6 Table A 7 Column Weight C C C C C C C C C C C C C C Total Beam Quantity Span(ft) Area(sq ft) Weight B B B B B B B B B B B B B B B B B Total Table A 8 Wall Thickness Area Weight B Total = Page 24
25 Table A 9 Floor Weight Column Slab(w/ superimposed) Beams Walls&Façade Total Shear (K) B R Total Lateral Calculations Table A 10 Floor Floor Height (ft) Forces (k) Story Shear (k) N/S E/W N/S E/W Roof Page 25
26 ETABS and Hand Calculations Table A 11 N S Accidental Torsional Moment, M ta Story Structural Width (in) 5% width (ft) Story Force (k) Torsion (ft k) Roof Table A 12 E W Accidental Torsional Moment, M ta Story Structural Width (in) 5% width (ft) Story Force (k) Torsion (ft k) Roof Table A 13 N S Inherent Torsional Moment, M t Story Center of Mass Center of Rigidity Difference (ft) Story Force (k) Torsion (ft k) Roof Page 26
27 Table A 14 E W Inherent Torsional Moment, M t Story Center of Mass Center of Rigidity Difference (ft) Story Force (k) Torsion (ft k) Roof Table A 15 WALL FORCE HEIGHT WIDTH THICNKESS FLEXURE SHEAR TOTAL RELATIVE STIFFNESS Note: Deflection on roof in N-S with story shear = 45.6 Page 27

28 Overturning Moment Calculations Page 28

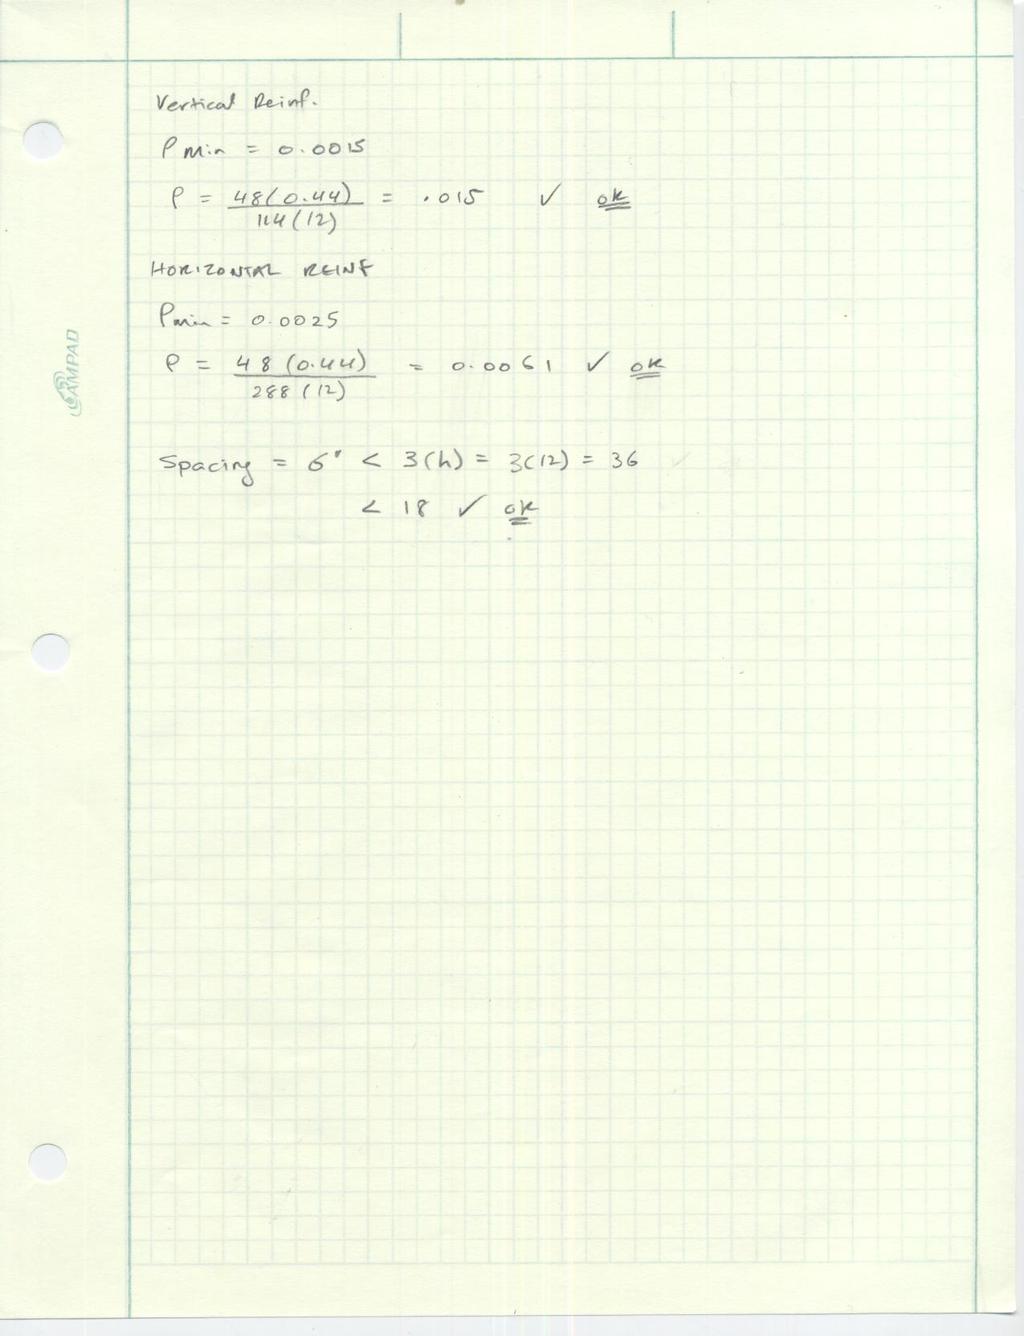
29 Shear check Page 29
30 Page 30
31 Appendix B: Shear Wall Detail Page 31
32 Plan B 1 Page 32