Market size and energy consumption of Korean building sector
|
|
|
- Abner Williamson
- 5 years ago
- Views:
Transcription

1
2


3 Market size and energy consumption of Korean building sector
4 Weather Condition of South Korea (Seoul) Target year for Net-ZERO BUILDING by countries - HDD : Seoul - CDD : Source : Towards nearly zero-energy buildings, Definition of common principles under the EPBD, Final Report (2013)
 Total Residential Building Commercial Building Industrial Building School & Social Building Etc.")
5 Building Stock By Building Types 3% 10% By Building age (Number of Buildings) 4% 17% 66% Residential Commercial Indeusrial School & Social etc. Building Stock Number of Buildings (Unit : Number of Buildings, m2 ) Total Residential Building Commercial Building Industrial Building School & Social Building Etc. Floor Area Number of Buildings Floor Area Number of Buildings Floor Area Total 6,911,288 3,451,351,596 4,544,277 1,608,411,588 1,174, ,840, , ,896, , ,410, , ,792,162 Less than 10yrs 1,133, ,658, , ,293, , ,883,223 98, ,693,860 48,213 88,643, ,412 90,144, yrs 661, ,990, , ,602, , ,003,790 52,066 53,918,254 29,114 55,862,298 95, ,603, yrs 713, ,191, , ,719, , ,285,869 37,907 46,109,778 29,339 51,877, ,958 76,199, yrs 839, ,565, , ,509, , ,193,578 36,551 51,268,972 20,083 30,878, , ,714, yrs 515, ,446, , ,331, ,503 64,851,013 17,198 27,596,210 11,010 16,458,591 24,461 14,209, yrs 497, ,729, ,346 72,320,001 82,268 45,163,555 8,916 13,340,377 9,504 19,744,512 24,279 9,161,477 More than 35yrs 1,978, ,424,602 1,655, ,486, ,103 49,504,120 22,252 22,269,547 20,233 21,102,377 97,417 22,062,480 Etc. 572,528 89,343, ,926 32,149,636 59,944 11,955,545 10,131 12,699,331 15,417 19,843,020 44,110 12,696,446 (Year of 2014) Number of Buildings Floor Area Number of Buildings Floor Area Number of Buildings Floor Area

")
6 Energy Consumption by Types in Commercial Buildings Energy Consumption by Types in Commercial Buildings Percentage of Types (Unit: TOE)


7 Korean Target for Reduction in Building Sector 37% Reduction by Energy-Efficient House 2017 Passive House 2025 Zero Energy House 20L 50% Energy Reduction 90% Energy Reduction Zero Energy in House Heat Hot water Cooling 3L LED Appliances Lighting 1.5L 80% reduction in energy consumption and CO2 emission in house 90% reduction in energy consumption in House No CO2 emission


8 Policies & Programs Standard for Building Insulation & Energy Efficient Designs Building Energy Rating System Energy Efficiency Standard & Labeling Program High Efficiency Equipment Certification Program Housing Performance Grading Indication System Carbon Labeling G-SEED& Building Energy Rating System obligation for public buildings Eco-Labeling


9 Vision of Building Energy Management in Our Research VISION : Spread of Common Building Treatment Market (Care & Treatment Service)
10


11 Introduction of National BEI&Ms Building Permit Information Building Energy Consumption Green Together

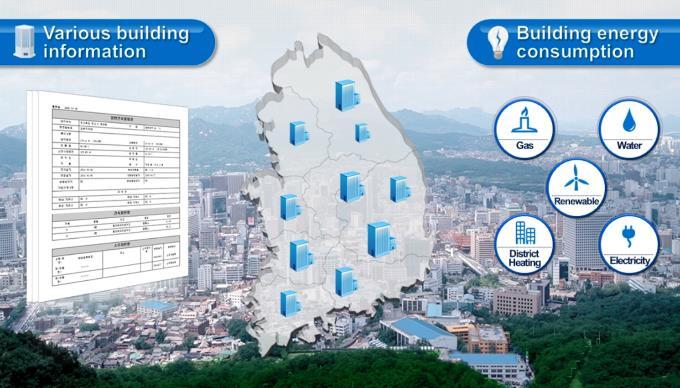


12 Construction Database of Building and Energy Matching Data Energy Provider Building Information Utility Billing Data Database


")


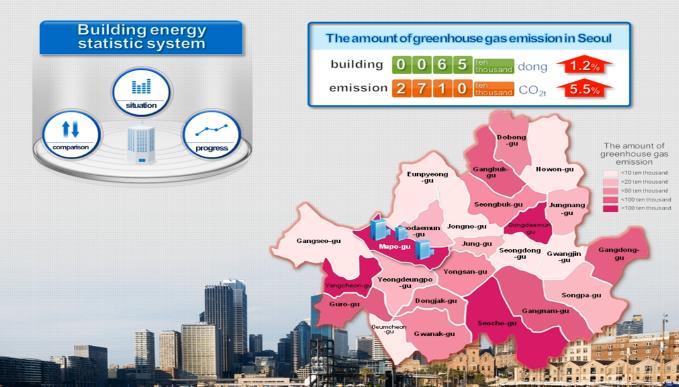
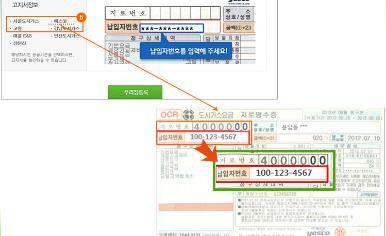
13 Offering Service of BEI & Ms Offering Service Building Energy Integrated DB Building Energy Management System Total 6.8 Million Buildings & 19 Million Households in South Korea Building Consumption Certificate Energy Saving Program Building Target Management System Green Construction Portal Policy Support < Green Building Portal > Building Information Energy Information Statistics Analysis < Consumption Certificate > Common The target number of Buildings with Building Energy Integrated DB in the country (Unit : case) Electricity : Mil 6.8 Mil Buildings City Gas : 15.80Mil 19 Mil Households District Heating: 0.50 Mil Energy Integrated Information Use Portal Nationwide Service < Stastistics > < Decision Making Support > < Map Information >
14


15 Proposed NEW BEI & Ms for Upgraded System Heating Electricity Cooling Real Energy City Gas Hot water Calculated Energy District Heating Lighting Water Supply Current BEI&Ms H.A. / O.A. Existing Simulation Proposed NEW BEI & Ms
16 Proposed NEW BEI & Ms for Upgraded System


17 Building Energy Support System
18 Use of Building Information from the Building Permit Database - Correlation between general information and detailed information was evaluated - If there is no correlation, average value or value from the regulation is recommended. - If there is a correlation between main item from detailed information and gross area or construction year from general information, an equation is recommended.
19 Default Values for Creating Input Data of Basic Level Audit Architectural factor Equipment Item Type Constants or equations U-value of external wall [W/m 2 K] D_reg 0.27 U-value of roof [W/m 2 K] D_reg 0.18 U-value of floor [W/m 2 K] D_reg 0.23 U-value of window [W/m 2 K] D_reg 1.50 Heating system Cooling system Hot water system Renewable energy Geothermal * x = gross area Default and intelligent Default (draft) Shading coefficient D_avg 0.56 Capacity [kw] ID_area x* COP D_avg 3.55 Capacity [kw] ID_area x COP D_avg 3.04 Capacity [kw] ID_area x efficiency D_avg Lighting [W/m 2 ] D_avg 9.69 Gross area of PV[m 2 ] ID_area x Capacity of heat pump [kw] ID_area x Heating COP D_avg 3.98 Cooling COP D_avg 4.65
20 Simplified model Simplified model Simplified model Simplified Models for Energy Analysis Set of simple model (draft) Items Profile General Information Architectural factor Equipment Story height Infiltration Lighting load U-value of External walls U-value of windows WWR HVAC type Boiler type Efficiency of boiler Chiller type COP of chiller Hot water system type Properties D_ref D_ref D_ref D_avg D_avg D_avg D_ref D_ref D_ref D_ref D_ref D_avg D_ref D_avg Efficiency of hot water system Value Small offices 3 [m] 1.5 [1/h] 6.96 [W/m 2 ] 0.29 [W/m 2 K] 2.22 [W/m 2 K] 36.9 [%] CAV Hot water boiler 91 [%] Absorption 3.04 Hot water boiler [%] Comparison of results from ECO2 and simple model Load [kwh/m 2 ] Heating Energy demand [kwh/m 2 ] Lighting Cooling Hot water Ventilation Primary energy demand [kwh/m 2 ] ECO2 ECO2 ECO2

21 Thank you for attention