Seismic performance of concrete filled steel tube to wide flange beam moment connections with diaphragms
|
|
|
- Jeffry Jennings
- 5 years ago
- Views:
Transcription
1 Lehigh University Lehigh Preserve Theses and Dissertations 1995 Seismic performance of concrete filled steel tube to wide flange beam moment connections with diaphragms Garry W. Vermaas Lehigh University Follow this and additional works at: Recommended Citation Vermaas, Garry W., "Seismic performance of concrete filled steel tube to wide flange beam moment connections with diaphragms" (1995). Theses and Dissertations. Paper 378. This Thesis is brought to you for free and open access by Lehigh Preserve. It has been accepted for inclusion in Theses and Dissertations by an authorized administrator of Lehigh Preserve. For more information, please contact
2 'Vermaas, Garry W. Seismic Performance of Concrete Filled Steel Tube to Wide Flange Beam Moment..., January 14, 1995
3 Seismic Performance of Concrete Filled Steel Tube to Wide Flange Beam Moment Connections With Diaphragms by Garry W. Vermaas A Thesis Presented to the Graduate and Research Committee of Lehigh University in Candidacy for the Degree of Master of Science in Civil Engineering Lehigh University December 6, 1995
4
5 Table of Contents Table of Contents List of Tables... III v L t f F'... IS 0 Igures VIII Abstract... 1 Chapter 1 Introduction, 3 Chapter 2 Experimental Progra~ 92 Chapter 3 Experimental Behavior 145 Chapter 4 Analysis of Experimental Results 169 Chapter 5 Summary and Conclusions 232 References 235 Vita 238 III
6 iv
7 List of Tables Table Axial Load Data for CFT Columns, Furlong Tests (1967) Table Bending Plus Axial Load Data For CFT Columns, Furlong Tests (1968) Table Dimensional Properties of the Steel TUbes, Tomii et al (1977) Test Matrix Table Measured Dimensions of Specimens in Inches, Morino et al. (1992) Test Matrix Table List of Specimens, Kimura et al (1984) Test Matrix Table Dimensions of Specimens in Inches, Yokoyama et al. (1991) Test Matrix Table Details of Specimen Dimensions in Inches, Zhijun and Shanzhang (1991) Test Matrix Table Design Strength and Test Results, Matsui (1985) Table Details of Specimens, Picard and Giroux Tests (1976) Table Details of Welding of Each Strap Angle, Picard and Giroux Tests (1976) Table Details of Specimens, Picard and Giroux Tests (1977) Table Details of Welding of Each Strap Angle, Picard and Giroux Tests (1977) Table Ultimate Flexural Strength of Steel Portion [AIJ, 1987] Table Ultimate Flexural Strength of Symmetrical Hollow Concrete Section [AIJ, 1987] Table Ultimate Flexural Strength of Members [AIJ, 1987] v
8 List of Tables (cont.) Table Economical Comparison of CFT and WF Moment Resisting Frames (Complete Building) Table Average Beam Dimensions and Properties for Specimens 1 and 3 Table Average Column Dimensions and Properties for Steel Tubes of Specimens 1 and 3 Table Average Measured Diaphragm Dimensions, Specimen 1 Table Average Measured Dimensions for Specimen 3 Exterior Diaphragm Table Measured Beam and Column Material Properties Table Measured Diaphragm Plate Material Properties Table Structural Tee Material Properties Table Measured Concrete Material Properties Table Comparison of Experimental and Theoretical Values of EI for CFTs Table 4.2(a) - Maximum Beam Moment Mma/ m at end of Connection Region Calculated by Statics Table 4.2(b) - Maximum Beam Moment Mmaxbm at Face of Column Calculated by Statics Table 4.3(a) - Maximum Beam Moment Mmax bm at End of Connection Region Calculated from Measured Beam Reactions Table 4.3(b) - Maximum Beam Moment Mmaxbm at Face of Column Calculated From Measured Beam Reactions Table Maximum Column Moments Mmaxcol'at Face of Joint Table Maximum Experimental Panel Zone Shear Force Q max and Theoretical Panel Zone Shear Strengths vi
9 List of Tables (cont.) Table Maximum Beam Flange Force Table Maximum Displacement Ductility (/lmax), Interstory Drift Ratio (8 max ), and Plastic Beam Rotation (8 pmax ) vii
10 List of Figures Figure Typical Forms of Composite Columns Figure Construction Sequence of Building Frame with SRC Composite Columns. Figure Three Houston Center Gulf Tower, Composite Tube Frame Figure 1,.4 - First City Tower Composite Shear Wall and Composite Column Perimeter Frame Figure Momentum Place, System D-Punched Concrete Walls at Building Corners with Composite Column/Steel Spandrellnfills Figure CFT Column High Rise Condominium, Tokyo Figure FEM Analytical Model of Connection and Stress Flow in Diaphragm Figure Schematic of Panel Zone Shear Test Set-up Figure CFT Panel Zone Shear Capacity Model - Concrete Mechanisms Formulations Figure Hydrostatic Prism formed Along Primary Compression Strut Figure Comparison Between Predicted and Experimental Shear Capacity Figure Load versus Transverse Displacement of CFT Panel Zone Test Specimens Figure Effect of Diaphragm on Experimental Shear-Deformation Response Figure Effect of Tube Width-to-Thickness Ratio (b/t) on Experimental Shear-Deformation Response Figure Ultimate Capacity of CFT Columns Subjected to Concentric Axial Load viii
11 List of Figures Figure Load - Rotation Angle Correlation [Kato et ai., 1992] Figure Beam-to-Column Connections [Matsui, 1985] Figure Strap Angle Beam-to-CFT Moment Connections Figure Revised Strap Angle Beam-to-CFT Moment Connections [Picard and Giroux, 1977] Figure LRFD Beam-Column Interaction Equations Figure CFT Interaction Curve Figure Typical CFT Column-to-Beam Connections [AIJ, 1987] Figure AIJ Beam-Column Interaction for CFT Columns Figure Connection Shear Capacity per AIJ (1987) as a Function of CFT Steel Wall Thickness Figure Connection Shear Capacity per AIJ (1987) as a Function of beam Depth Figure Connection Shear Capacity per AIJ (1987) as a Function of CFT Column Width Figure Shear and Moment in Panel Zone Due to Seismic Lateral Loading Figure Prototype Building Elevation Figure Prototype Typical Floor Plan Figure Prototype Perimeter Moment Resisting Frame for CFT and WF Column Systems. Figure NEHRP Equivalent lateral Loads For Strength Design - CFT and WF Column MRF Frames Figure NEHRP Equivalent Lateral Loads for Inter-story Drift Design CFT and WF Column MRF Frames ix
12 List of Figures Figure Test Configuration Figure CFT Connection Structural Subassembly Test Setup Figure Photograph of Test Setup Figure Kinematics of (a) Prototype Structure in Connection Region, and (b) Experimental Setup Figure Elevation of Lateral Bracing Figure Connection 1 Figure Connection 3 Figure Section Resisting One Half of Flange Force, Specimen 3 Figure 2.15(a) - Typical Stress-Strain Curve For Beam Web of Specimen 1 Figure 2.15(b) - Typical Stress-Strain Curve For Beam Flange of Specimen 1 Figure Lateral, Rotational, and Beam Displacement Transducer Instrumentation Figure Panel Zone Displacement Transducer Instrumentation Figure Panel Zone Strain Gage Instrumentation Figure Column Strain Gage Instrumentation (East and West Faces) Figure Specimen 1 Beam Strain Gage Instrumentation Figure Specimen 1 Top Diaphragm Stain Gage Location (Top View) Figure Specimen 1 Bottom Diaphragm Strain Gage Location (Bottom View) Figure Specimen 3 Beam Strain Gage Instrumentation x
13 List of Figures Figure External Diaphragm Strain Instrumentation Figure Lateral Displacement History Figure Lateral Load - Displacement Response, Specimen Figure Modified Displacement History Involving Seven Initial Cycles, followed by ATC-24. Figure Specimen 1 Before Testing Figure Specimen 1 - Cycle 7 Figure Specimen 1- Cycle 22 (/-1 =2.0) Figure Specimen 1 - Cycle 24 (/-1 =3.0) Figure Specimen 1, End of Cycle 24 (/-1 = 3.0) Figure Photograph of Crack in Wall of Column Adjacent to Beam Flange, Specimen 1 Figure Lateral Load - Displacement Response, Specimen 3 Figure Specimen 3 Before Testing Figure Specimen 3 Cycle 7 (/-1 =1.0) Figure Specimen 3, Cycle 15 (/-1 = 2.0) Figure Fracture in Beam Flange During Cycle 17 (/-1 =3.0) - Specimen 3 Figure Specimen 3, End of Cycle 17 (/-1 =3.0) Figure Lateral Load - Displacement Response, Specimen 1 Figure Lateral Load - Displacement Response, Specimen 3 Figure Subassemblage Elastic Stiffness with Respect to Ductility, xi
14 List of Figures Specimen 1 Figure 4.4 _subassemblage Elastic Stiffness with Respect to Ductility, Specimen 3 Figure 4.5 _Components of Inter-story Drift [after Krawinkler et ai., 1971] Figure 4.6 _Lateral Load Column Deformation - Envelope Response for Specimen 1 Figure 4.7 _Lateral Load Column Deformation - Envelope Response for Specimen 3 Figure 4.8(a) _Lateral Load - North Panel Zone Inter-story Drift Component Relationship, Specimen 1 Figure 4.8(b) _Lateral Load - South Panel Zone Inter-story Drift Component Relationship, Specimen 1 Figure 4.9 _Lateral Load - Column Inter-story Drift Component Relationship, Specimen 1 Figure 4.10 _Lateral Load - Beam Inter-story Drift Component Relationship, Specimen 1 Figure 4.11(a) _Lateral Load - North Panel Zone Inter-story Drift Component Relationship, Specimen 3 Figure 4.11 (b) _Lateral Load - South Panel Zone Inter-story Drift Component Relationship, Specimen 3 Figure 4.12 _Lateral Load - Column Inter-story Drift Component Relationship, Specimen 3 Figure 4.13 _Lateral Load - Beam Inter-story Drift Component Relationship, Specimen 3 Figure 4.14 _Components of Inter-story Drift, Specimen 1 Figure 4.15 _Components of Inter-story Drift, Specimen 3 xii
15 List of Figures, Figure 4.16(a) - South Panel Zone Shear Deformation, Strain Rosettes _ Specimen 1 Figure 4.16(b) - North Panel Zone Shear Deformation, Strain Rosettes Specimen 1 Figure 4.17(a) - South Panel Zone Shear Deformation, Strain Rosettes _ Specimen 3 Figure 4.17(b) - North Panel Zone Shear Deformation, Strain Rosettes Specimen 3 Figure East Beam Moment at Edge of Coverplate vs. Beam Plastic Rotation, Specimen 1 Figure West Beam Moment at Edge of Coverplate vs. Beam Plastic Rotation, Specimen 1 Figure East Beam Moment at Edge of Tees vs. Beam Plastic Rotation, Specimen 3 Figure West Beam Moment at Edge of Tees vs. Beam Plastic Rotation, Specimen 3 Figure East Beam Moment at Face of Column vs. Beam Plastic Rotation, Specimen 1 Figure West Beam Moment at Face of Column vs. Beam Plastic Rotation, Specimen 1 Figure East Beam Moment at Face of Column vs. Beam Plastic Rotation, Specimen 3 Figure West Beam Moment at Face of Column vs. Beam Plastic Rotation, Specimen 3 Figure Comparison of Specimen Maximum Force State with ACI and xiii
16 List of Figures AISC Bare Steel Capacities Figure North Panel Zone Shear VS. Panel Zone Deformation, Specimen 1 Figure South Panel Zone Shear VS. Panel Zone Deformation, Specimen 1 Figure North Panel Zone Shear VS. Panel Zone Deformation, Specimen 3 Figure South Panel Zone Shear VS. Panel Zone Deformation, Specimen 3 Figure Strain in Top Diaphragm (Pull - Direction), Specimen 1 Figure Strain in Top Diaphragm (Push - Direction), Specimen 1 Figure Strain in Bottom Diaphragm (Pull - Direction), Specimen 1 Figure Strain in Bottom Diaphragm (Push - Direction), Specimen 1 Figure Strain in Structural Tees (Pull - Direction), Specimen 3 Figure Strain in Structural Tees (Push - Direction), Specimen 3 xiv
17 ABSTRACT An experimental study was undertaken to investigate the cyclic stiffness, strength, and ductility of concrete filled steel tube-to-wide flange beam moment connections with subjected to simulated seismic loading conditions. Two full scale specimens were designed, fabricated, and tested, each consisting of two wide flange beams attached to a structural steel tube column filled with unreinforced concrete (CFT). One specimen had a pair of interior diaphragms, while the other utilized exterior diaphragms, constructed of structural tees to transfer the beam forces into the connection. Both specimens were designed to have an elastic response occur primarily in the beams. The contribution to interstory drift by the panel zone, the beams, and the column were studied by evaluating measurements associated with each taken during testing. The results of the test program indicated that the specimens possess exceptional ductility and strength under cyclic loading. Test results also concluded that the interior diaphragm within the panel zone of the CFT may be replaced by an exterior diaphragm for seismic resistant design. The beams in both specimens were found to develop maximum moments in the plastic hinge zones that ranged from 1.16 to 1.28 times the plastic flexural capacity M p. The beams accounted for a majority of the interstory drift, where the maximum plastic beam rotation was and rad in the two, specimens. The rotation capacity and ductility of the beams was found to be 1
18 affected by strain concentrations that developed at the location of transition between the beam and connector elements (e.g. diaphragms). The elastic stiffness (EI) of the column appears to be well represented by the transformed uncracked section up to an inter-story drift of 3% to 6% ofthe story height. This report is the Master of Science Thesis of Garry W. Vermaas, under the supervision of Professor James Ricles while at Lehigh University. Assessment of the results and writing of this report was completed at the Center for Advanced Technology for Large Structural Systems (ATLSS) located at Lehigh University. Subsequent related research on composite connections is continuing at ATLSS under Dr. Ricles. " 2
19 Chapter 1 Introduction 1.1 Conventional Use of Structural Materials In structural engineering, the two most traditionally used materials for large buildings are structural steel and reinforced concrete. Steel has often been used for the design of tall buildings since its important role in the construction of the skyscraper in the early 1900's. The advantage of structural steel is that it is a light material which can be erected relatively easily in any type of weather conditions. This characteristic also reduces the weight of the building in order to maintain economical foundations. Steel columns are also able to carry heavy loads due to the strength characteristics of steel. Currently, studies are ongoing related to in steel alloying which will lead to improvements in both a steel's strength and durability. Reinforced concrete has also played an important role in high rise construction, due to its ability to carry large shear wall or column loads at lower costs. Extremely large column loads in high rise buildings can be supported by reasonably sized reinforced concrete columns with a concrete compressive strength between 7000 psi and 14,000 psi. Recent developments in reinforced concrete have allowed it to become a much more viable building material. New concrete admixtures, such as plastizers, increase the workability of the concrete 3
20 with no degradation of its strength. This workability of the concrete eases the placement in congested heavily reinforced columns. New developments in concrete mixing and batching allow concrete to be placed year round at reasonable costs. New types of lightweight aggregates offer a lightweight concrete which provides adequate strength, lessens the dead weight of the structure, and lowers the amount of cracking in elevated floor slabs. New developments in forming systems have increased the placement of concrete to a rate which is comparable to that of steel. A study was performed to analyze the relative cost effectiveness of steel and concrete columns for tall buildings in which the necessary strength and stiffness was provided [Griffis, 1987]. It was found that reinforced concrete columns are approximately 11 times more cost affective in resisting axial load strength wise, than structural steel columns. Reinforced columns are also approximately 8.5 times more cost effective from an axial stiffness standpoint, in providing resistance to axial deformation, than structural steel columns. On the contrary structural steel columns, for a given axial load, are only 25% as large in area and weigh only 80% as much as concrete columns. It was also found, when comparing the two different structural materials in damping effectiveness, that well-confined concrete structures and welded structural steel systems at service loads have approximately 2% to 3% viscous damping. Structural steel systems at yielding stress levels develop 5% to 7% viscous damping, while 4
21 reinforced concrete structures, which have considerable cracking from ultimate loads, develop 7% to 10% viscous damping. Reinforced concrete structures, because of their stiffness, will develop 30% less acceleration under wind loading than will structural steel. 1.2 Composite Construction Composite construction is a combination of structural steel and reinforced concrete design. This particular design concept has developed composite structural members which are commonly used in today's high rise construction. These composite elements are designed to provide adequate strength, stiffness, and ductility, as well as, resist high bending moments and large axial loads. Composite construction was used in early high rise design, where the structural steel members were encased with concrete for reasons of fire and corrosion protection. This protective reinforced concrete coating added strength, stiffness and ductility to the structural steel members, and as a result, engineers in the 1960's attempted to develop design criteria in order to take advantage ofthese material attributes. From that point on designers were using the distinct advantages of each separate building material, together in composite construction, in order to design more economical structural members. In addition, the advancement ofconcrete pumping systems, which could pump 5
22 concrete vertically over 1000 feet, made composite construction a viable option in high rise design. There are three basic forms of composite construction in composite column design, namely; (1) a structural circular or (2) square steel tube filled with reinforced or unreinforced concrete (CFT); and (3) the more commonly used (iii.) structural steel shape encased in reinforced concrete (SRC). these types of columns are illustrated in Figure 1.1. The construction method for CFT columns used in Japan first erects the box column frame of the whole or partitioned structure, and second, fills the columns with concrete. Typically interior diaphragm plates, with centered holes to enable concrete flow, are used at the column to beam connection. These plates are usually connected to three sides ofthe square box column using full penetration welds. After the box column is closed, the weld between the diaphragm plate and the fourth side ofthe box is made using the electroslag welding process. Connections of this type require a considerable amount of fabrication time in the shop and tend to be quite expensive. The construction method for SRC composite construction has a different approach. The erection of the steel frame proceeds ten to twelve floors ahead of the forming and placing of the reinforced concrete. Hydraulic slip and jump form framing systems are used which can place large segments of the composite frame in short periods of time, and which utilize the concept of formwork 6
23 repetition (see Figure 1.2). In SRC construction the composite frame is not fully stable until the concrete has been placed and cured, and because of this, must be braced during the construction phase. On the other hand, CFT construction with moment connections does not require bracing nor formwork during construction. This study focuses on composite concrete filled tube (CFT) columns used in perimeter moment resisting frames (MRF) to resist lateral loads. The lateral stiffness of an MRF is greatly influenced by the flexural stiffness of the beams and columns, as well as connection rigidity. If the columns are closely spaced, an increase in the lateral stiffness occurs due to tube action [Linderman, 1990]. At the building corners moments are developed about both axes of the column cross section. These columns are also subjected to high axial loads due to overturning effects in addition to bending moments about both axes. In order to avoid problems of dissymmetry of the wide flange shapes and at the same time maintain three dimensional continuity of the MRF, designers are tending to use box columns or structural tubes for corner columns. Box sections or structural tubes are extremely efficient for carrying axial loads due to the larger radius of gyration for a given column dimension, and have superior torsional properties. A CFT column is ideally suited for corner columns in a MRF, for these members combine structural steel tubes, with their light weight and speed of erection, with high strength concrete's inherent properties of mass, stiffness, and damping. 7
24 There are several buildings built in the United States which have been designed to resist vertical dead and live loads as well as lateral loads by the use of composite columns. Feasibility studies were conducted on the basis of these projects in order to determine the most cost effective type of construction. These studies showed in concept that composite structural members offered the best overall advantages in time and economics compared to conventional steel structures and reinforced concrete structures. The Three Houston Center Gulf Tower in Houston, Texas (Figure 1.3) presents an excellent example of a composite design. This high rise building maintains an all steel frame below the third floor and a composite moment resisting frame having SRC columns above the third floor, with no internal bracing or bracing walls. During the construction phase of this project, the steel frame was erected 10 to 12 floors above the concrete forming and placement, which moved along at a steady pace. The combined use of steel and concrete provided a decrease in cost while easing the construction phase. A second example of a composite design building is the First City Tower, located in Houston, Texas (Figure 1.4) [Griffis, 1987]. This high rise is designed to resist lateral loads through its composite MRF (having SRC columns) and shear walls located in the central core. The two shorter sides of the building have steel wide flange composite columns, which provide full moment connections to the girders. During the construction of this project, the perimeter 8
25 columns were erected at the same time that the building core was framed, while the composite columns were constructed 10 to 12 floors behind the steel frame. Momentum Place, located in Dallas, Texas (Figure 1.5) [Griffis, 1987], is a third example of composite design. This 60 story composite structure consisted ofjump-formed perimeter corner shear wall with punched openings, perimeter SRC composite columns, and steel interior columns. The ultimate design ofthis building was based on the preliminary value studies and design for efficient wind resistant building systems, where the final composite design was chosen on the basis of economics. The IBM Atlantic Center Tower in Atlanta, Georgia [Griffis, 1987] is yet another example of a composite high rise design. This 50 story building, the tallest one in Atlanta, resists lateral loads by an interior concrete core, composite exterior SRC columns, and composite floor beams. The interior concrete core was constructed by the use of slip forms and remains to be the tallest core slip formed to date. Prior to the design of this structure a value engineering study was performed on three types of frames: (1) an interior concrete core with composite exterior SRC columns; (2) an interior concrete core with reinforced concrete exterior columns; and (3) a perimeter concrete tube with reinforced concrete interior columns. The design which utilized composite construction proved to be the most advantageous system for the construction of the building. 9
26 A composite column example where the columns consist of concrete filled steel tubes can be found in the Southern part of Tokyo [Endoh, Yamamoto, Araki, and Yagi, 1991]. This high rise condominium stands at a height of 373 feet and consists of 37 stories with 2 floors of basement and 461 separate units (see Figure 1.6). The shape of the floor plan is almost rectangular with a size of 101' x 129'. The structural frames are spaced at 17.6 feet in the transverse direction and 22 feet in the longitudinal direction with a standard floor height of 9.7 feet. There are six frames in the longitudinal direction and eight frames in the transverse direction from the second floor up. A perimeter MRF tube structure created by four frames is designed to resist earthquake loads. Shear walls are only used for the basement floors. The building has interior square CFT columns, which are 25.6 inches by 25.6 inches in cross section. The wall thickness of the steel portion of the CFTs were reported to range from 1/2 inch at the roof level to 1.4 inch at the bottom floor level. The corner columns of the building were reported to consist of circular CFTs, contrary to the floor plan in Figure 1.6, which had a diameter of 16 inches. This building was designed for safety against earthquakes as well as comfort from wind loading effects. Interior diaphragm plates were used for beam-to-column connections. These connections and diaphragm plates were analyzed using the finite element method, through which it was found that the maximum stress in the diaphragm was located at the edge of the hole at an 10
27 angle of about 50 degrees from the beam axis (see Figure 1.7). A structural test was also conducted in order to evaluate the capacity of the frame against lateral load, load-deflection relationship and state of stress flow in the diaphragm. A construction test of casting concrete into the steel tubes was conducted for the following reasons: (1) To develop a casting apparatus for three floors at a time and for casting concrete from the top level. (2) To confirm the performance of this apparatus. (3) To prove that sound concrete can be cast according to design specifications. (4) To confirm that concrete can fill the space under the diaphragm using a real size model. This building was the first high rise in Japan to be constructed with concrete filled structural tube composite columns. Through the experimental process the designers ofthis structure learned the following: (1) design methods for concrete filled tubes must be established, especially for the beam-to-column connections; (2) structural tolerances of steel tubes were poor and more effort is needed in the fabrication of the steel tubes; and (3) less fire resistive coverage of the eft is needed if the concrete inside the column is taken into account due to the fact that the concrete provides a heat sink. 11
28 While composite design and construction has many merits, some problems can be encountered with this type of construction. First, there is the problem of differential column shortening. Concrete in the column shortens because of creep and shrinkage effects, beyond the normal range of elastic axial shortening. Second, when the steel frame is constructed prior to placement or pumping of the concrete, the structural steel columns undergo differential axial shortening due to construction loading, causing floor leveling problems. A third problem with composite construction is the different trade unions responsible for each independent material. Even though a composite design might offer the best economical solution in terms of material costs, that does not mean that it will be the cheapest to build. Complications of labor agreement during the construction phase can cause large unexpected costs. 1.3 Previous Research on efts An experimental an analytical study was undertaken at Lehigh University in order to assess the performance of the CFT panel zone under shear. The test setup is shown in Figure 1.8. The study included the comparison of effective parameters of the panel zone which influenced the strength, ductility, and deformation of the composite panel zone under direct shear. The test set up used one test specimen, which essentially modeled two connection panel zones, in order to simulate to force state of the panel zone caused by the combination 12
29 of seismic and gravity loading. The details of the panel zone included: (1) the width-to-thickness (bit) ratio of the steel tube; (2) the compressive strut angle, which was the resulting angle between the transverse axis of the column and the developed diagonal compression strut; (3)the width of the compression strut; and, (4) the effect of steel plate diaphragms on the panel zone's performance. The results of the test were compared with shear capacity predictions for the panel zone. Three models which were evaluated were the Kanatani Model [Kantani et ai., 1985], Modified Strut Model, and the ACI Model. All three of these models assumed that the shear strength of the panel is the sum of the shear strengths of steel and concrete, but differ in their methods of calculation for the concrete capacity. The Kanatani model (see Figure 1.9) assumes that the shear strength of concrete depends on the concrete compressive strength, fe' the compression strut angle, a, and the strut width, Be (see Figure 1.8), where the latter is dependent on the bearing width, S, and the strut angle. The limiting steel panel zone capacity is determined using the von Mises yield criteria. Expressions for the Kanatani shear strength model are as follows: Steel As = 2(b - t)t (1.1 ) cry 't =- y ~3 (1.2) (1.3) 13
30 where V s ' As, b, t, and cry are the shear strength of steel, cross-sectional area of the steel tube, width of panel zone, thickness of steel tube, and the yield stress of the steel tube, and Concrete Dc =D - 2t (1.4) without diaphragm v = S*D *cos 2 rv*f c c ~ c (1.5) with diaphragm (1.6) The shear capacity in the sum of the steel and concrete shear resistance: (1.7) The modified concrete truss model (see Figure 1.9) is based on a combination of the strut and tie model and the compression field model. The shear strength of the steel is calculated using the area of the steel found within the panel zone, where overall width of the tube is D. The compression strut width, Be' is calculated using a 45 degree hydrostatic prism formed in the concrete adjacent to bearing plates (see Figure 1.10). For specimens with diaphragms, a component of secondary compression field is believed to be mobilized and should be included in the shear capacity of the panel [Rides et ai., 1993] (see Figure 1.9). Also, the strength of the confined concrete within the 14
31 compression strut is assumed to be 0.85f c. Expressions for the shear strength determined by the Modified Strut Model are shown below: Steel As = 2(b - t)*t (1.8) cry 't =- y "-/3 (1.9) (1.10) Concrete Dc = 0-2t (1.11) without diaphragm Vc= S* Dc *cos(45 )cos(u)*0.85fc with diaphragm A v = (0-2t)(a - 4J) o sin 2 p = 0.5*( ) a (1.12) (1.13) (1.14) I Vc= S*Oc*cos(45 )cos(u)*0.85fc+ A/sin 2 p*0.85fc (1.15) where the total panel zone shear capacity is (1.16) 15
32 In the above expressions a and ~ are the beam depth and diaphragm plate thickness. The ACI model predicts the shear capacity of the panel using the von Mises yield criterion, and the ACI specifications to calculate the shear strength of the concrete within the panel zone. In this model the shear strength of concrete is independent of the compression strut angle and the bearing width, and is only a function ofthe confinement. Expressions for the ACI Model are as follows: Steel As = 2(b - t)*t (1.17) cry 't =- y ~3 (1.18) (1.19) Concrete Dc =(D - 2t) h = (b -2t) (1.20) (1.21 ) without diaphragm v = D *h*15~f c c c (1.22) with diaphragm v =0 *h*20~f c c c (1.23) where the total shear strength is (1.24) 16
33 A comparison of the predicted shear versus the experimental shear for each of the four specimens can be see in Figure The conclusions from this previous study include the following: 1. Steel and concrete both contribute to CFT panel zone shear capacity. 2. Panel zone behavior is ductile due to concrete confinement and local buckling being inhibited in panel zone. 3. Interior diaphragm plates provide additional confinement and bearing capacity, leading to greater panel zone capacity. 4. Change in strut angle did not lead to an appreciable affect. 5. Analytical methods, particularly the Kanatani and modified strut models, predict CFT panel zone shear capacity reasonable well. The results of this study also showed that the shear capacity in the shear force-deformation response decreased slightly after reaching peak load, but regained strength, offering high ductility (see Figure 1.12). It was evident that internal diaphragms in the panel zone improve the shear capacity (see Figure 1.13). Also a decrease in width to thickness ratio bit results in a higher shear capacity (due to the larger steel shear area for a constant width, b) as shown in Figure The amount of ductility and energy dissipation that the CFT offers gives reason to explore more viable and reliable connections in order to maximize the 17
34 potential of a CFT. It is therefore apparent from this and other research that the concept of CFT is one which should be explored more rigorously Research on hollow box column, fabricated from steel plate, to wide flange beam moment connections was conducted at the University of Idaho [Linderman, 1990]. The prototype box columns used in these test procedures were 11 inch square columns with wall thickness varying from 3/4 inch to 1 1/4 in. The prototype beams selected were W16X40 and W16X26. These sizes are approximately one-half the size of a typical section. The moment capacity and ductility of a typical connection for each specimen was evaluated under cyclic loading tests. Box sections with and without diaphragm plates were considered in tests which included axial load on the column. Specimen 9, a W16X40 beam welded to a box column having 1/2" interior continuity plates, sustained 11 loading cycles above the nominal plastic moment capacity prior to failure. The maximum beam load of 80 kips was 55% above nominal yield. Specimen 4, a W16X40 beam welded to a box column having a 1 1/4 inch face plate with no interior continuity plate, sustained 7 cycles above nominal plastic moment capacity prior to failure of the connection. Failure occurred due to a crack which propagated across the top flange. The results following conclusions based on the results include: (1) Designing box column to wide flange beam connections with the internal diaphragm plate results in ultimate connection behavior which is 18
35 comparable to the standard connection of a beam to a wide flange column, but the initial stiffness may be as much as 18% less. (2) The web cope in the beam can be a source of crack initiation which can impair the ultimate load carrying capacity of the connection. (3) For a given beam, a wall thickness of the box column can be designed in order to eliminate internal diaphragms, although the initial stiffness of the connection may be reduced as much as 30%. These last results simply say that it may be possible to design CFTs with ample wall thickness whereby interior diaphragms are not needed in the connection region. The results of experimental research on CFT columns was reported by Richard W. Furlong [1967,1968]. In the analysis ofcfts under axial load it was suggested that the proportion of the total load carried by steel increases as strains increase because the stiffness of steel does not tend to decrease as much as the stiffness of concrete under such circumstances. It was also suggested that it was not possible to justify any effective lateral confinement offered by square or rectangular structural tubing, for the cross section tends to ovalize and is not very stiff against pressure perpendicular to the walls of the tube. Furlong also conducted 17 ultimate strength tests on CFTs in order to determine the moment-axial interaction relationships. A summary of the axially 19
36 loaded specimens is given in table 1.1, while Table 1.2 contains the same information for specimens subjected to bending in addition to axial force. Furlong found from strain measurements that the steel and concrete sustain load somewhat independent of one another. Also there appeared to be little, if any, additional strength due to the confinement ofthe concrete by the structural tube. On the other hand, it was concluded that the concrete did stabilize the thin walled steel encasements from local buckling. Furlong conducted an additional 21 stiffness and capacity tests in order to develop a more complete hypothesis. Each of the square CFT specimens were about 36 inches long, with an outside dimension that varied from 4.50 to 6 inches. He found in these tests that the adhesive bond between the steel wall and the concrete core was too weak to prohibit separation or sliding at relatively low stress levels. Also, tests on plain rolled steel tubing revealed that there were extensive residual stresses in cold-rolled and welded steel tubing such that proportional limit in the axial loading of stub columns was less than 50% of the nominal yield strength. Extensive research on CFTs has been conducted in Japan related to the seismic performance of the members in moment resisting frames. In experimental studies on concrete filled steel tubular columns under concentric loading by Tomii et al. [1977], it was found that the capacity of concrete filled steel tubular stub columns was considerable larger than that of the reinforced 20
37 concrete columns which were predicted using strength theory, because the concrete core is confined laterally by the steel tube (see Figure 1.15). Tomii and his colleagues conducted 268 concentrically loaded column tests, where 148 columns were made from circular tubes, 60 were square and 60 octagonal. dimensional properties of all steel tubes are shown in Table 1.3. The major conclusions from these tests were as follows: (1) Failure modes consisted either of general buckling for longer columns, or crushing in shorter columns. (2) CFTs which failed in the crushing mode, had a degrading type of failure in which rapid deterioration of axial load was observed in its loaddeformation relationship. This relationship was found to be remarkably affected by the cross-sectional shape, width-to-wall thickness ratio, and concrete strength. (3) It was found that there was actually no increase in axial strength due to triaxial effects (e.g. confinement of concrete by steel tube), although the ultimate loads ofmost ofthe CFTs with quite thin wall thickness reached the nominal squash loads. (4) Values of yielding strength divided by the nominal squash load were not significantly affected by the width-to-wall thickness ratio of the steel tube and compressive strength of the encased concrete. 21
38 (5) There were very little differences in inelastic member behavior due to encasement of expansive concrete. Research on beam flange to concrete-filled tubular column connections by Kato et al [1992] was conducted at the University of Tokyo. In these tests outer stiffening rings, which are welded to the tube face at the beam flange level, were designed in order to replace interior diaphragms. The yield and ultimate strength of this connection were investigated experimentally and theoretically. The predominant stress acting on the cross section of the stiffening ring, is shear stress, which would be the cause of failure if the beam and weld at the connection were not considered. A rigid frame subassemblage, approximately one half scale, was tested under simulated seismic action. This prototype subassemblage was designed according to current Japanese design practice, so that the yielding of the beam flange should occur before yielding ofthe beam-to-column connection [Kato et ai., 1992]. The hysteresis loop ofthe specimen was quite stationary showing excellent energy dissipation (see Figure 1.16). Failure of the connection resulted from the propagation of a crack at the intersection between the ring and the beam flange. Testing ofthree dimensional subassemblies consisting offour wide flange beams and a concrete filled steel tubular column under constant axial load was conducted at Mic University in Isu, Japan by Morino et al. [1992]. The beams in 22
39 the minor direction of the structure's plan were kept under constant axial load while the beams in the major direction were subject to alternately repeated lateral forces simulating earthquake loading. The test specimens were designed to fail either at the beam to column connection panel (P-series), or from flexural failure of the column (C-series). The measured dimensions of each of the test specimens can be seen in Table 1.4. All the C and P-series specimens subjected to the bi-axial bending showed a doglegged deformation in the column and failed with excessive displacement at the connection. The P-series specimens subjected to the uni-axial bending showed stable symmetrical deformation and could sustain the axial load until the end of the test. It was concluded from this test that the P-series are more stable and exhibit more energy dissipation capacity compared to the C-series. This was found to be associated with the fact that the P-series' connection panel yielded in shear, while the specimen subjected to the bi-axial bending becomes unstable due to excessive column deformation of a doglegged shape in the minor direction. When a structural steel tube with an inner open diaphragm is filled with concrete, voids may form under the diaphragm plate. In order to understand the influence ofthese voids, compression and shearing tests were conducted on specimens with artificial voids, where the results were compared to specimens without voids [Kimura et al. 1991]. The test procedure parameters and results can be seen in Table 1.5. The effect of concrete voids on the behavior of the 23
40 connection was studied by conducting three short-column compressive and shearing tests, while the effect on frame behavior due to these voids was examined by testing addition cruciform shaped frame test specimens, subjecting them to simulated seismic forces with simultaneous constant axial force. The results of the compression test showed that the effect of the voids on the strength of the column was minimal. The diaphragm developed the same deformation as when no voids existed. The flexural shearing test on the column and beam joint showed no deteriorating force characteristics or localized deformation due to the presence of voids. The cruciform tests results had no effects of the presence of voids, and produced sufficiently stable hysteresis characteristics. Concrete filled steel tubes with interior diaphragm plates having square openings were analyzed by Yokoyama et al. [1991]. Table 1.6 shows that list of the specimens and their geometric properties. Expressions for the full plastic strength of the beam-end connection were derived based on yield line theory. The expressions were found to predict strengths that were in good agreement with the experimental values. Yokoyama et al. also concluded that the seismic design strength of the panel zone in the AIJ Standard used for design of Japanese composite construction [AIJ I 1987] corresponds closely to the load under which the reduction of stiffness begins due to full yielding of the panel zone. 24
41 An experimental study of exterior stiffener rings for tubular columns was conducted by Zhijun and Shanzhang [1991], in order to develop a formula which would predict the design load bearing capacity of the stiffener ring subjected to one or two way tension force, with the column under axial load. The geometric parameters of each of the specimens can be seen in Table 1.7. Pertinent information from these tests concluded, for stiffener rings subjected to two-way tension force (e.g. beams framing from both directions into the prototype column), that greater axial compression ratios lowered the capacity ofthe stiffener ring. These conclusions mandate the necessity for restricted axial compression ratios ofthe frame column. Research on concrete filled tubes with inner ribs designed to increase the bond stress between the concrete and the structural steel tube has been conducted by Matsui et al. [1991]. Throughout these tests the inelastic behavior of efts subjected to axially and horizontal loads was considered. The main parameters existing in the test program were the presence of inner ribs, axial vertical load ratio, and the presence of a vacant space at the top of the column. The nominal sizes of width and depth of the steel section and the plate thickness were in. and in., respectively. The concept of the vacant space was intended to represent the possibility of concrete existing in a steel tube with no direct bearing. From the results of this test the following conclusions were noted: (1) the maximum bond stress for specimens with ribs was 5 times the amount for 25
42 the specimen with no ribs; (2) the strength of all specimens with inner ribs exceed the flexural strength M u based on the superposed AIJ strength method [AIJ, 1987], even if the vacant space exists at the top of the specimen; and (3) all specimens with inner ribs showed large energy dissipation capacity and large ductility, while specimens without ribs showed poor performance if a vacant space existed at the top of the specimen. Research on the comparison of hollow structural tubes to CFTs under a combined axially and horizontal loading, as well a comparison of limiting values of the width-to-thickness ratio for plate elements in the CFTs, was conducted by Matsui [1991]. New limiting values were derived from the comparison ofthe post buckling behaviors of concrete filled tubular members with those of hollow tubular members, based on the equivalent energy absorption capacity of the members. The hollow and concrete filled test specimens consisted ofthe same steel tubular section, which had a width-to-thickness ratio, bit, of about 47. This parameter was consistent with the current AIJ code [AIJ, 1987] which limits the bit ratio. The test specimen was 5.9 x 5.9 inches square with a 1/8 inch thickness. The results of testing showed that the restoring force of the hollow tubes decreased rapidly at the occurrence of web local buckling following flange local buckling. The restoring force of CFTs was strengthened due to the concrete, with the behavior in the post local buckling range extremely improved. At the occurrence of local buckling in CFTs the compression force sustained by 26
43 the structural steel tube was transferred to the concrete. Numerical results obtained from a plastic limit analysis proposed a new limiting value of the widthto-thickness ratio of plate elements of concrete filled steel tubular columns of about 1.5 times the value used for a hollow tube section. Matsui [1985] developed a method of design for connections composed of concrete filled tubular members and bare steel H-shapes, which was later adopted in the commentary of the standard for tubular steel-concrete composite structures of the Architectural Institute of Japan [AIJ, 1987]. The design of the beam-to-column connection consists of the strength of the diaphragms and the shear strength of the connection panel. In the case of earthquake loading (shortterm loading), the allowable strength of the diaphragm spa, is expressed in Eqns for two types of diaphragms which are shown, with all relative parameters defined in Figure Type I. sa- P - - *h ss *t *0' ys + 2(4t + t)*t*o' "s yt ~3 (1.25) Type II: spa shall be taken as the smaller value obtained from equations (1.26) or (1.27). B*t s spa =(0 + 2h s - d)2 *--* O'ys d 2 (1.26) 27
44 (1.27) where h s ' t s, t, cr ys ' cryt, B, 0, and d are the size of the diaphragm (see Figure 1.17), thickness of diaphragm, thickness of tube, yield stress of stiffener, yield stress of tube, width of beam flange, depth and width of tube, and the diameter of the circular hole in the diaphragm, respectively. Note that criteria per Eqn.1.27 is omitted in the current AIJ provisions [AIJ, 1987], and hence is also for the design of the experimental test specimens (to be discussed in Chapter 2). Equation 1.25 is expressed as the sum of the plastic strength of a diaphragm, 8 1, and that of the web plate of a tube, 8 2, 8 1 is obtained from plastic analysis using the assumptions that the a-a section in Figure 1.17(a) yields in a state of combined normal and shearing stresses. In calculating 8 2, the effective width (4t + t s ) of a web plate was determined on the basis of the consideration for the test results which were obtained by tension tests for simple specimens composed of a filled tube and stiffener plates. Eqn is applicable in the range of 300<8~5, 20::;0/~50, 0.75::; ti~2.0, where the minimum size of h s is However, it also be conservatively used for a diaphragm of 8::;30. For the case of a type II diaphragm, Eqn 1.26 is obtained from the condition that the section b-b of a diaphragm (see Figure 1.17(b)) begins to yield due to bending moment produced by the distributed load PIB applied from a beam flange. In this analysis, a stiffener is assumed to be a end-fixed beam with span d, depth (0 + 2h s - d)/2 and width t s ' Eqn 1.27 is obtained from the 28
45 condition that the section c-c in Figure 1.17(b) yields in a state of normal stress under P. Eqs 1.25 through 1.27 are expressed as the allowable strength of a diaphragm, spa. A value of the allowable moment applied to a connection may be expressed by Eqn (1.28) where J is the beam depth between flanges and sma is the overturning moment of two beams framing into the joint. The panel zone of a beam-to-cft column connection must have enough shear strength so that the connecting beams can reach their ultimate strength. The commentary of AIJ standard recommends an allowable strength pm a for a CFTwhere 5D sa (Jyt M :: 2 P *sj':: (11*_* f +-*~) * sj' pap a c" cs J (1.29) In order to verify the strength formulas of the beam-to-cft column connections described above, the experimental results of cruciform frame specimens are described below. The test specimens were designed so that initial yielding would occur at the diaphragm. Then the columns and beams were designed to have enough strength in comparison with the strength of the diaphragm or the connection panels. Specimens A and B had outside diaphragms of type I with h s :: inch and 1.18 inch, respectively. Specimens C had interior diaphragms of type /I with d=4.72 inch. The allowable 29
46 beam loads, sq a and pqa. are calculated according to Eqns and 1.29 and correspond to spaand ppa' Their values are summarized in Table 1.8. From the load-displacement relations ofthe specimens, it was recognized that the beam load sqacorresponding to sma showed fairly good agreement to the yielding load of specimens and the connections had enough spare strength to the final states. Twelve square CFT column and H shape beam specimens were also tested by Matsui (1985) under constant vertical and varying horizontal loads in order to investigate the strength and behavior ofcomposite frames. Four specimens were designed in order to examine the validity ofthe strength formulae for the diaphragms. The columns of these specimens were proportioned to have the same allowable bending strength ema as that ofbeamto-column connections sma. ema is determined by the design formula of the AIJ standard and will be discussed later. Matsui calculated the ultimate strength of the CFT column, emu, using Eqns through 1.33: (1.30) (1.31) (N - ra*f c )2 sm pe = sm po t*cr yt (1.32) N N emp =-* {(O -2t)----} 2 (0-2t)*F c (1.33) 30
47 where sm po ' N, ca, and Fe are the full plastic moment of the tube under pure bending, applied axial force, the cross sectional area of concrete, and concrete compression strength, respectively. The values of emu! ema are about 1.5. In the test procedure the be~m-tocolumn connections, designed by Eqns 1.25 to 1.27, were examined to see if they could resist against the increase in column strength from ema to emu in order to maintain a equilibrium state of moment at the connection. The beams were designed so that the allowable bending moment bma and the ultimate moment bmu corresponded with the yield moment and full plastic moment of the beam cross section, respectively. The theoretical behavior ofthe test frames were predicted using the plastic hinge method. The plastic collapse mechanism lines are calculated using Eqn H= h' h'. (1.34) where emu, P, ~, and h' are equal to the column flexural capacity, axial column load, lateral displacement, and height ofthe column. Matsui concluded that the eft frame is very excellent as an earthquake resistant structure when the diaphragms of the beam-to-column connection are designed by the strength formulae, Eqns to He also confirmed that the limiting value ofwidth-to-thickness ratio of eft tubes can be mitigated to 31
48 about 1.5 times that of the hollow tubes due to the restricting effect of the filled concrete on local buckling of a tube. Tests on wide flange beams to hollow structural steel column connections by Blais [1974] on a simple physical model involving monotonic load, have shown that the best method of transferring the flange forces to the tubular column, without deformation of the tube column, is to transfer the flange stress to the tube walls through plates that are in the plane and parallel to the beam web. Continued monotonic load tests on these types of connections were conducted by Picard and Giroux at Laval University in Quebec [1976]. The predominant connection was the one which consisted of coped strap angles around the square tubular column in order to transfer beam flange stress to the panel zone ofthe column (see Figure 1.18). The details ofthe specimens are summarized in Table 1.9, and the details of welding of each strap angle is given in Table The beam flanges, in this case, were approximately the same width as the steel tube column. This connection was found to have adequate strength to carry the full plastic moment of the connected beams and sufficient rotation capacity to sustain large inelastic rotations while it is considered a 'nearly rigid' connection, it was found to be flexible and thereby cause significant lateral displacement. Use of this type of connection, therefore, requires investigation of P-~ effects and the possibility of a frame bracing system. 32
49 Giroux and Picard conducted subsequent tests [1977] involving monotonic loading in which the beam flange was substantially narrower than the column face (see Figure 1.19). The connection tested here was similar to previous one with the exception that welded double angles were used to transfer flange forces from the wide flange beam to the column. The exact details of the specimens are given in Table 1.1 t, and the details of the welding of each strap angle given in Table The results of this test involving monotonic load, concluded that special attention had to be paid to the geometrical design of the strap angles for the web connection. It was suggested that the strap angles be coped in order to ensure that brittle fracture will not take place. This connection was also found to be flexible and requires the consideration of P-.1 effects on the frame. While the above tests by Blais, and Picard and Giroux involve no concrete placed inside the tube, the details lend themselves to concepts that could be used in connections between CFT columns and wide flange beams. 1.4 U.S. CFT Column Design Provisions The results of some of the above mentioned research has lead to U.S. design guidelines. Composite columns can be designed in the U.S. seismic regions by using the criteria found in the newly published NEHRP provisions [NEHRP, 1994] in conjunction with the American Institute of Steel Construction Load Resistance Factor Design Manual (LRFD) [AISC, 1992], the American Concrete Institute Building Code Requirements for Reinforced Concrete (ACI) 33
50 [ACt, 1989], the American Institute of Steel Construction Seismic Provisions for Structural Steel Buildings [AISC, 1992], and the American Iron and Steel Institute Load and Resistance Factor Design Specification for Cold-formed Steel Structural Members [AtSI, 1991]. The NEHRP provisions define a composite column as a steel column fabricated from rolled or built-up steel shapes and encased in structural concrete, or fabricated from steel pipe or tubing and filled with structural concrete, where the structural steel portion accounts for at least 4 percent ofthe gross column area. The limitations and design requirements of composite columns for seismic regions of performance categories D and E according to the NEHRP [NEHRP, 1994] will be stated below and will later be compared to the limitations and design requirements of composite columns for non-seismic regions according to both the LRFD and the ACI. The stated limitations and design requirements of the NEHRP for steel tubing filled with structural concrete consist of the following: (1) The design of composite columns subjected to seismic forces acting alone or in combination with other prescribed loads shall be determined according to the provisions in Chapter I of the LRFD and the following: (2) Concrete in composite members shall have a specified compressive strength not less than 3 ksi. The compressive strength shall not exceed 10 ksi for normal weight concrete and 4 ksi for lightweight concrete. 34
51 (3) The shear strength of the column shall be calculated as the strength ofthe steel section alone. This conservative limitation is a result of little test evidence to demonstrate whether some portion of the concrete can be used for resisting shear. This approach is consistent with recommendations proposed by Furlong (1988) and the provisions in the latest draft of Eurocode 4 for composite construction. (4) Seismic design forces in columns shall be calculated using NEHRP Eq and (5) Splices ofthe structural steel tube or pipe shall meet the requirements ofaisc Seismic Provisions for Structural Steel Buildings. (6) The minimum required shear strength ofthe column shall meet the provisions of Sec of the ACI, which states that the design force shall be determined from consideration of the maximum forces that can be generated at the faces of the joints at each end of the member. These joint forces shall be determined using the maximum probable moment strengths of the member associated with the range of factored axial loads on the member. The member shears need not exceed those determined from joint strengths based on the probable moment strength of the transverse members framing into the joint. (7) The strong-column/weak-beam design requirements below must be satisfied to limit plastic hinge formations in the columns. Column bases shall be detailed to sustain inelastic flexural hinging. 35
52 (i) the flexural strength of the columns shall meet the requirements of Sec of the ACI: ~Me ~ (6/5)~Mg (1.35) where ~Me is the sum of the moment, at the center of the joint, corresponding to the design flexural strength of the columns framing into that joint. Column flexural strength shall be calculated for the factored axial force, consistent with the direction of the lateral forces considered, resulting in the lowest flexural strength. ~Mg is the sum of moments, at the center of the joint, corresponding to the design flexural strengths of girders framing into that joint. Flexural strengths shall be summed such that the column moments oppose the beam moments. Eqn shall be satisfied for beam moments acting in both directions in the vertical plane of the frame considered. (ii) the provisions of Sec. 8.6 of the AISC Seismic Provisions for Structural Steel Buildings shall be met (8) The minimum wall thickness of structural steel tubing filled with concrete shall be equal to b~(f yl2e s ) for each face of width b.. The reduced slenderness criteria, in comparison to that of the LRFD, were imposed as a conservative measure until further research data becomes available on the cyclic response of filled tubes. The stated limitations and design requirements of the NEHRP [NEHR P l for composite connections consist of the following: 36
53 (1) Moment connection design strengths shall meet or exceed the flexural and shear forces associated with plastic hinging of the beams adjacent to the connection (2) Composite connections shall be demonstrated to have strength, ductility, and toughness at least equal to those for similar structural steel or reinforced concrete connections that meet the provisions of Chapter 5 and Chapter 6 of the NEHRP. (3) All connections in the structure shall have adequate deformation capacity to resist their critical factored design loads under the design story drifts calculated according to the requirements of Chapter 2. (4) Calculated connection strengths shall be based on rational models that satisfy equilibrium of internal forces and strength limitations of component materials and elements based on potential failure modes. (5) Force transfer between structural steel and concrete shall only be considered to occur through direct bearing and/or shear friction. Force transfer shall be calculated based only on direct bearing forces and/or clamping forces provided by reinforcement, shear studs, or other mechanical devices. Bond between steel and concrete is not to be considered as a connection force transfer mechanism. 37
54 (6) The design strength of steel components of connections shall not exceed those prescribed in the LRFD or the Seismic Provisions for Structural Steel Buildings. (7) Ultimate bearing and shear friction design strengths calculated according to Chapters 10 and 11 of the ACI shall be reduced by 25 percent. (8) The panel zone shear strength may be calculated as the sum of the strengths of the structural steel and reinforced concrete shear elements where each is calculated following the provisions of Sec. 8 of the Seismic Provisions for Structural Steel Buildings and Sec ofthe ACI. The LRFD criteria for designing non-seismic composite columns is referenced from the NEHRP quite frequently and will be stated below for the purpose of comparison between the two design specifications. The stated nonseismic limitations of the LRFD for steel tubing filled with structural concrete consist of the following: (1) The cross-sectional area of the steel tube must comprise at least 4% of the total composite cross section. (2) Concrete shall have a specified compressive strength fe' of not less than 3 ksi nor more than 8 ksi for normal weight concrete and not less than 4 ksi for light weight concrete. (3) The specified minimum yield stress of the structural steel used in calculating the strength of a composite column shall not exceed 55 ksi. 38
55 (4) The minimum wall thickness of the rectangular structural tube shall be equal to b*--j(fyl3e) for each face of width b. This specification is identical to the one found in the 1992 ACI Building Code and its purpose is to prevent local buckling ofthe steel tube prior to yielding. The design strength of axially loaded CFT composite columns according to the LRFD is $cpn, where $ c=0.85 and the nominal axial compressive strength Pn is determined from the following: (1.36) For A ~ 1.5 For A > 1.5 Fcr =(0.658'''/)Fmy (1.37a) (1.37b) where: KI F my A=(-) * --J(-) rn Em (1.38) A c F my =F y f c '(--) As (1.39) A c Em = E s + 0.2E c (--) As (1.40) where A c ' A SI E SI E CI Fy' and f c ' are the area of concrete (in 2 ), area of steel tube (in 2 ), modulus of elasticity of steel (ksi), modulus of elasticity of concrete (ksi), 39
56 specified minimum yield stress of steel tube (ksi), and specified compressive strength of concrete (ksi), respectively, ofthe cross-section. The design of CFT columns for combined axial compression and flexure according to the LRFD is similar to that specified for steel columns. The interaction of these forces shall be limited by the formulas given in equations H1-1 through H1-6 in chapter H of the LRFD [AISC, 1992]: P u for -- ~0.2 <DP n P u 8 M ux M uy -+-(-+ )~1.0 <DPn 9 <DbM nx <Db M ny (1.41) P u for -- < 0.2 <DP n Pu --+(-- +--) ~ 1.0 2<DPn <Db M nx <Db M ny (1.42) (1.43) 8 1 = C m P u ~ 1 (1--) P e M1 C m = ( - ) M 2 1 (1.44) (1.45) (1.46) 40
57 or (1.47) where: p u = required axial strength, kips Pn = nominal axial strength determined in accordance with Sect. 01, kips M u = required flexural strength, kip-in. <1> =resistance factor for tension <1>b = resistance factor for bending M nt =required flexural strength in member assuming there is no lateral translation of the frame, kip-in. Mit = required flexural strength in member as a result of lateral translation of the frame only, kip-in. ~oh = translation deflection of the story under consideration, in. LH = sum of all story horizontal forces producing ~oh' kips. L =story height, in. The above equations shall be used to determine the interaction of combined axial and flexure forces for composite columns with the following modifications: 41
58 M n = nominal flexural strength determined from plastic stress distribution on the composite cross section except when the axial term in Eqns and 1.42 is less than 0.3. In that case the nominal flexural strength shall be determined by straight line transition between the nominal flexural strength determined from the plastic distribution on the composite cross section at (P/$cPn) =0.3 and the flexural strength at Pu =O. where M =M =Z*F n p y (1.48) (1.49) $b =resistance factor for flexure from LRFD Section 13 where Pe is the elastic buckling load in kips. The resulting moment - axial load interaction diagram is shown in Figure The design specifications for a structural steel tube filled with concrete as stated in the 1992 ACI are as follows: (1) The strength of a composite member shall be computed for the same limiting conditions applicable to ordinary reinforced concrete members. The same rules used for computing the load-moment interaction strength for reinforced concrete beam columns, utilizing the concept of strain compatibility, 42
59 can be applied to composite sections. The ACI moment - axial load interaction surface is shown in Figure 1.21 for a CFT column similar to the test specimens of the current study reported herein. (2) Any axial load strength assigned to concrete of a composite member shall be transferred to the concrete by members or brackets in direct bearing on the composite member concrete. All axial load strength not assigned to concrete of a composite member shall be developed by direct connection to the structural tube. Direct bearing or direct connection can be developed through lugs, plates, or reinforcing bars welded to the structural tube before concrete is cast. (3) For evaluation of slenderness effects, the radius of gyration of a composite section shall be not greater than the value given by the following: (1.50) 5 where EI may be taken as either of the two following: 2.5 EI=--- (1.51) 43
60 5 EI =---+ Esl t 1 + Pd (1.52) In the above expressions E e, E s, I g, It, A g, At, and Pd are the modulus of elasticity of concrete (psi), modulus of elasticity of steel (psi), gross moment of inertia, moment of inertia of the structural steel tube about the centroidal axis of the composite member cross section, gross area of section (in\ the area of structural steel tube in the composite section (in 2 ), and the ratio of the maximum factored axial dead load to the maximum total factored axial load, respectively. (4) The eft composite sections should have a steel wall thickness large enough to attain longitudinal yield stress before buckling outward. This is accomplished by setting the minimum wall thickness t for each face of width b of the steel tube to be equal to: F y t= b~(-) 3E s (1.53) 1.5 Japanese CFT Column Design Provisions (A.I.J. Specifications) The Architectural Institute of Japan [AIJ, 1987] contains structural design codes which involve consideration of seismic effects due to the intense 44
61 seismicity of the Japanese islands. The provision research noted earlier in Section 1.3 led to a number of the provisions in the AIJ Specification. Typical CFT column to beam connections suggested by the AIJ can be seen in Figure The design specifications for a structural steel tube filled with concrete as stated in the 1987 AIJ are as follows: (1) The cross-sectional area of longitudinal steel members in a column or a compression member shall be not less than 0.8% of the gross area of concrete. (2) The width-to-thickness ratio, BIt, for a square or rectangular steel tube, shall be limited to the following: columns: b =:; (1.54) t ~F where F is the yield stress in MPa. (3) Calculation for the allowable axial force and bending moment in N = N c (1.55) (1.56) (1.57) 45
62 M= M s (1.58) When N < 0 (1.59) M= M s (1.60) where N, cnc, cn, sn, M, sma, cm, and sm are the design compressive force, allowable compressive force of concrete portion subjected to the ultimate compressive strength of concrete portion subjected to compression alone (equal to ca*f c '), allowable compressive force of concrete portion, allowable compressive force of steel portion, design bending moment, allowable bending moment of steel portion subjected to bending alone, allowable bending moment of concrete portion, and allowable bending moment of steel portion, respectively. (4) Calculation of allowable forces for a column subjected to combined axial force and bending moment may be made by the following, instead of the above equations: (1.61) (1.62) (5) Calculation of allowable forces for a column which has an effective buckling length exceeding 12 times the depth of the cross section shall conform to the requirements below: N = N c (1.63) 46
63 (1.64) (1.65) M =sm (1 ----) (1.66) where ev is the factor of safety and shall be taken as 3.0 and 1.5 for the long-term (serviceability) and the short-term (earthquake) stress conditions, respectively. N k is the buckling strength of the column. (6) sn is the allowable compressive strength of the steel portion as a long column, and shall be computed according to Design Standard for Steel Structures taking the slenderness effect into consideration. (7) en and enc are the allowable compressive strengths of the filled concrete portion as a long column, and shall be computed for the cross section subjected to bending moment equal to em multiplied by eb given below and axial compression en. However, end eccentricities not less than 5% of the depth of the concrete section shall be considered in the calculation described above. 1 eb=---- (1.67)
64 51/ (1.68) (8) Calculation for the allowable shear force of a concrete filled steel tubular column for long term stress condition shall be made by the following: (1.69) (1.70) Q =b' * J' * a * f r AL ~ 5 (1.71) 4 a=----- M --+1 and 1 ~ a ~ 2 (1.72) 7.5*sA p=--- b' * ḋ (1.73) rj =0.75*0 (1.74) where Q, QA, P, rqal' b', rj, f s ' M, rd, and 0 are the design shear force, allowable shear force, coefficient related to the type and dimension ofthe steel web, allowable shear force under long-term stress condition of concrete portion in column, effective width of concrete at steel flange, distance between centroids of tension and compression under flexure, allowable shear stress of concrete, design bending moment, distance between extreme compression fiber and 48
65 center of compression reinforcement, and depth of the flexural member, respectively. (9) Calculation for the allowable shear force of a concrete filled steel tubular column for short term stress condition shall be made by the following: 2 (1.75) where sqa, sa. and sfs are the allowable shear force of steel portion, area of steel portion, and the allowable shear stress of steel, respectively. (10) Bond between steel tube and concrete shall be investigated, where a part of the shear force in a beam is transferred as the compression force in the filled concrete portion of a column. (11) Calculation for shear force of a connection panel surrounded by columns and beams shall be made according to the following: (1.76) (1.77) (1.78) where cv, sv, h', h, sm 1, 5M2, ra, J~' s0, and snd are the volume of concrete portion of beam-to-column connection, volume of the steel web of beam-tocolumn connection, clear height of the column, story height, absolute value of allowable bending moment of steel portion at one end of member under short- 49
66 term stress condition, absolute value of allowable bending moment of steel portion at the other end ofmember under short-term stress condition, area of concrete portion, coefficient related to the shape of the beam-to-column connection with a concrete filled steel tubular column, diameter ofsteel tube, and the distance between the upper and lower chords or flanges ofthe steel beam, respectively. (12) The ultimate axial- flexural strength of a composite concrete and steel tubular member shall be computed as follows: Nu=eNu + mnu + snu Mu=eMu + mmu + smu (1.79) (1.80) where smushall be computed according to Table 1.13, and emu shall be computed according to Table 1.14, where eru = Nu, enu' mnuj snu' Mu' emu, mmu, and smuare the ultimate compressive strength of the composite member, ultimate compressive strength of the concrete portion, ultimate compressive strength ofthe main reinforcement (if any at all), ultimate compressive strength of the steel portion, ultimate flexural strength of the composite member, ultimate flexural strength of filled concrete portion, ultimate flexural strength of the main reinforcement, and the ultimate flexural strength of the steel portion. The superposed axial load - moment interaction strength ofa eft column is presented in Figure
67 (13) The ultimate shear strength of concrete filled steel tubular members shall be computed as shown below: (1.81) I' (1.82) (1.83) sa * scrr sqsu=--- 2 *..)3 (1.84) I' (1.85) where emu may be computed according to Table 1.15, I' is the clear span length of beam, equ is the ultimate shear strength of the concrete portion, sq u is the ultimate shear strength of the steel portion, sq su is the ultimate shear strength in squ controlled by shear yielding of steel portion, sq bu is the ultimate shear strength in squ controlled by flexural failure of steel portion, sa is area of steel portion, and scry is the yield stress of steel. (14) The ultimate shear strength of beam-to-column connections can be computed as follows: JM u =ev * JF s * j~ scry s V*--..)3 (1.86) 51
68 3.6F c (1.87) 100 (1.88) (1.89) (1.90) JM u ' cv, JFs, Fc' j~' ca, sa, and sv are ultimate shear strength of beam-tocolumn connection converted to bending moment, volume of concrete portion of beam-to-column connection, shear strength of concrete in beam-to-column connection, concrete compressive strength (kg/cm\ coefficient related to shape of concrete filled steel tubular column, cross sectional area of the concrete, cross sectional area ofthe steel tube section, and the volume ofsteel web of beam-tocolumn connection. The shear capacity ofa CFT-to-wide flange beam connection, computed using equations (1.86) through (1.90), increases linearly in relation to the increasing thickness of the structural steel tube, as shown in Figure The shear capacity ofthe connection seems to decrease exponentially with increasing beam depth, as shown in Figure 1.25, while it increases parabolically with increasing column width, as shown in Figure Objectives 52
69 The attributes ofthe materials and demonstrated performance from previous research indicates that the use of concrete filled steel tube composite columns appears to be a viable option for seismic resistant design. The application ofthis form of construction for seismic resistant design would be desirable because of its adequate member strength and ductility during seismic cyclic loading and its economic advantages due to the decrease of structural steel weight. Due to the lack of knowledge and data associated with the seismic behavior of the moment connections between a concrete filled steel tube column and wide flange beams, as well as design criteria applicable for U.S. design practice, a research program was conducted to study this topic. The study involved experimentally testing square CFT columns with rigid connections to wide flange beams, such as that which maybe used in a perimeter moment resisting frame for a seismic resistant structural system. The objectives of this research study are: (1) Experimentally assess the cyclic stiffness, strength and ductility of CFT column-to-beam and beam-to-column connections when subjected to combined axial and flexural loading under seismic conditions. (2) Experimentally assess the stiffness of CFT columns and beam-to-column connections. (3) Experimentally assess and analyze the force transfer mechanism and failure mode of the CFT column-to-wide flange beam connections under 53
70 seismic loading conditions, and develop recommendations that result in economical connection designs. 1.8 Scope This report is a summary of a portion of the research program which consisted of an experimental study of CFT column-to-wide flange beam full moment connections subjected to combined loading under seismic conditions. This study reported herein is part of a major ongoing investigation on the seismic connection behavior in CFT column systems. After the introduction given in Chapter 1, Chapter 2 of this report includes the prototype building design and the description of an experimental program which involved the testing of two full scale CFT column-to-wide flange beam subassemblages. The experimental behavior of each test specimen is described in Chapter 3. An analysis of the experimental results for column stiffness, connection strength, stiffness, and ductility, the force state developed with in the joint, and the separate components of interstory drift is presented in Chapter 4. Conclusions and a summary of recommended connection design based on the test program are given in Chapter 5. 54
71 Table Axial Load Data For CFT Columns. Furlong Test (1967) Shape Tube Wall f y As f c A c Po Pu PoiPu Size Thickness Computed Measured In. in. ksi in 2 ksi in 2 kips kips CJ1 CJ1 Round Round Square Square Square Square Square Round Round Round Round Round Round
72 Table 1,2 - Bending Plus Axial Load Data For CFT Columns, Furlong Tests (1968) Shape Tube Wall f, As f. Ae p. I M. Pu I Mu P.,IPu MJMu Size Thickness Computed Measured In, In, ksl In 2 ksl In 2 kips kip-in kips kip-in 01 (J) Square 5,00 0, , , ,0 0,381 0, ,0 430,0 0,381 0, ,0 450,0 0,254 0,978 Round 4,50 0,125 60,0 1,73 4,20 14, , , , , , , , ,0 0,153 1,007 Square 4,00 0,084 48,0 1, , ,0 44,3 0, ,0 44,6 0, , , ,182 1,128 20,10 114,10 0,181 1,229 Round , ,75 27,10 152, ,60 88, ,874 3,75 152,80 94,80 157, ,562 3,75 152,80 64,30 152, ,90 30, , , ,322 Square 4,00 0,125 48,00 1,95 4,18 14, , ,00 0,661 0,870 68,80 162,00 0,463 1,180 67,80 162,00 0,456 1,180 58,60 190,00 0,394 1,386 29,00 209,00 0,195 1,526 28,80 193,00 0,194 1,408 9,00 165,00 0,065 1,203 0,00 204,00 0, Round 5, ,10 17,90 142, ,80 78,00 0, , , ,00 140, ,50 126, ,60 140,50 0, ,80 150,50 0,483 1,560 60,00 156, , ,60 0, ,80 0, , ,069 1,346
73 Table 1,3 - DimensiQD.QLEJ:QQMti~f the Steel Tubes, TomB et al. (1977) Shape of Cross Section Circular Octagonal Square CJ1 '! Diameter or Length of Side (in) Wall Thickness (in) 0.118, 0.157, ,.126, ,.126, ,.126,.169 Diameter to Thickness Ratio 33, 25, 19 75, 47, 35 75, 47, 35 75, 47, 35 Length of Column (in) 3.3,7.3,11.2,15.2,19.1,23.0, , 17.7,23.6, ,17.7,23.6, ,17.7,23.6,29.5 Effective Length of Column (in) 12.8,16.7,20.7,24.6,28.5,32.5, ,23.6, , 17.7,23.6, , 17.7,23.6,29.5 Slenderness Ratio 12.8 to to to to 17.0 Effective Slenderness Ratio 10.6 to to to to 14.8 Total Number of Specimens
74 Table Measured Dimensions of Specimens in Inches. Morino et al. (1992) Specimen be te b p h p t p I b h h' CJ1 co SCP SCPOO SCP SCP20 / SCP SCC SCCOO SCC SCC SCC be : width of column t p : thickness of panel te : thickness of column I b : half length of beam b p : width of panel h : half length of column h p : height of panel h' : half clear length of column
75 Table List of Specimens. Kimura et al (1984) Test Matrix Specimen Void Thickness sno No Ratio % in ton ton A A A A A A
76 Table Dimensions of Specimens in Inches. Yokoyama et al. (1991) Test Matrix Specimen Column Beam Inner Ring Stiffener 0> o IS5-8 I IS7-13 I IS7-18 IV IS9-12 I cb x cb x ct x x x x x x x x bh x bb x btw x btf X rt x 6.30 x x x x 8.27 x x x x 8.27 x x x x x x x 1.28 db x d t 8.27 x x x x 0.354
77 Table Details of Specimens in Inches, Zhijun and Shanzhang (1991) Test Matrix (j)... Loading Specimen Type Steel Tub Stiffener Ring Manner D t H Sf h s t s One-way tension 1,2 I , wlo ax. compress. 3,4 IV , I One-way tension 6 I with ax. compress. 7 IV , IV I Two-way tension 10 I with axial 11 I compression 12 I IV 'L IV , I 8, Two-way tension 16 I with varying 17 I axial compress. 18 I , I I
78 Table Design Strength and Test Results, Matsui (1985) en N Specimen Steel Concrete Load Design Strength Test Qmax Mode of Failure Name Stiffener Beam Column sqa Yield Ulitmate Yield Ultimate Fc N sqa pqa Qmax Stress Stress Stress Stress (ksi) (ksi) (ksi) (ksi) (psi) (kip) (kip) (kip) (kip) A-M* fracture of A-C* stiffener B-M* " B-C* " C-M* local buckling C-C* ' of panel
79 Table Details of Specimens, Picard and Giroux Tests (1976)." L., (J) c..v Length of Strap Angles Category No. of Column Beam Strap Net Area Top Bottom Specimens Size Size Angles of Strap Angles [in] [in] [in] [in 2 ] [in] [in] A 4 8x8x1/4 W8x35 4x3x5/ B 4 10x10x1/4 W10x49 5x5x C 5 8x8x3/8 W8x35 4x4x3/ D 3 8x8x3/8 W8x35 4x4x5/ E 3 8x8x3/8 W8x35 4x4x9/ F 2 8x8x3/8 W8x35 4x4x3/
80 Table Details of Welding" of Each Strap Angle. Picard and Giroux Tests (1976) Welding to the Tube Welding to One Beam Top Angle Bottom Angle Category Size of Total Size of Total Size of Total Fillet Weld Length of Fillet Weld Length of Fillet Weld Length of Weld Weld Weld [in] [in] [in] [in] [in] [in] A B C,D,E F* *One-sided connection.
81 Table Details of Specimens. Picard and Giroux Tests (1976) Cl) CJ1 Length of Strap Angles Category No. of Beam Strap Net Area Top Bottom Web Connection Specimens Size Angles of Strap Angles [in] [in] [in 2 ] [in] [in] [in] G 1 W8X48 4X4X plate 5x3 1/2x1/4* H 5 W12X45 5X5X plate 5x3 1/2x1/4* I 1 W12X40 4X4X3/ plate 5x3 1/2x1/4* J 1 W12X45 5X5X3/ plate 5x3 1/2x1/4* K 1 W12X40 4X4X3/ plate 5x3 1/2x1/4* L 3 W12X45 5X5X3/ angles 4x4x1/4 1 M 1 W12X40 4X4X3/ angles 4x4x1/4 1 * Plate welded to tubular column and bolted to beam web. 1 Two angles welded to tubular column and beam web.
82 Table Details of Welding of Each Strap Angle Picard and Giroux Tests (1977) Welding to One Beam Top Angle Bottom Angle Category Size of Total Size of Total Fillet Weld Length of Fillet Weld Length of Weld Weld [in] [in] [in] [in] G H I J, L K,M
83 Table Ultimate Flexural Strength of Steel Portion [AIJ, 1987] --- Range of axial force Open-web section O~,NC/~,A'IIr,z, '''r-,nc/.,d/2 under strong-axis bending -,A,c1r ~,Nu~ 0,7"""r+,Nu',d/2,Mu I,a.. ',c1r~,nu~,a'iir d,z,.,c1r-t (,Nu-,a..,,c1 r ) Cross-shaped -,a..,c1r~,nu ~,a.. "c1r,z",c1r. open-web section -,A""r~,Nu~ -,a.. ',"r,z,,c1r +1 (,Nu+,a..' IIr) Full-web section,a. N, T'"r~, u~,a ',c1r '~"c1r-1 (,Nu- -i,a,a r ) under strong-axis,a. N,,a. bending and rec- --"ar~' U~-,c1r,z",a 2 2 r tangular tube N,,a. -,A"e1r~' u~ - T ',c1 r,,',c1r 2"",N + I1 T,a.,c1 r Full-web section (,a,+,a.),e1r~,nu~,a.,c1r under weak-ax~s -(,a,+,a.),c1rs,nu~(,a,+,a.),c1r,7.,,c1r bending \, -,A,c1r~,N,,~-(,I1,+,(.1.)'''r z +,d ( 1 ) Z,,b,,e1r-T( NI1-,a." c1r) Z h,', "'''r+'2(,nu+,a."ar) (2,al + 3 i~),c1r~,nu~,a ',c1r A d,d.t',e1,-.tt',nu... (,al+i,a.),c1r~,nu,z"c1, s( 2,a,+3 t ),l1r - b; (,,,:u-f,a."c1r) Cross-shaped 3 ). full-web.section ~ (,(.1,+ ~,a.),c1r -(,al +'2,a.,c1r~,Nu,Z",e1r -(2,a,+ 3 f-:),l1r~,nu.z,.", s.-(,al+~,a.),';r -obl ( 3 ) +2,Nil+ 2',a.',c1r -,A.,c1r~,NI1~-(2,al+ 3 ~ )'c1r,d't,~,+1-',ni1 0.2,A,c1,;S,Nu~,A,c1r 1.25 (1- ~11 J.Z,.,c1,' ',ti Circul~r t1,lbe -0.2,A"c1r~,Nu~0.2,A:,c1r,7.,,c1 r, -,A,c1r ;S,N I1 ;S -0.2,A,c1r 1.25 (l+ ::11 ),Z,.,c1r ',<1r 67
84 Table Ultimate Flexural Strength of Symmetrical Hollow Concrete Section [AIJ, 1987] r.1.nu/(bd.f,).mu/(bd'.f,) O~r.l~,dl - 1,Nu (I I,Nu) 2' bd F. -,T" bd'f, Square-hollow l [) 0 rectangular,r" Ir,,(1- ~ti) 1>.I - -;;(1-2yI.),Ij, -- - T,d,:ilr.1 2 'It. I section ~ 1-.tI. (1-2 x (r -,J.)l ~tfi3(.r,,-,i/.)tl-.r -,ti,)i X.2 Circula rectang section I-,dl~r.,.rul( r -~(1-2,tI )'1.ru r.i(i-r ) :;1 2 O:i.r.1 :;i,d, - 1,Nu (I I.Nu) 2' bd F. -:r;; bd.f, r-hollow.( D (I-,d.)' ( r (I-r ) ular.r" r --;;.,d.:ir.ru 2 ~1.. -,d. I-,d.~r., 1: II [) lro x(0, - sin O. cos0.)i [) (1-2,tI,)'. '0 I - b 12 Sin, -2,d')'1 r (1-r ).ru :ill ".r"-b".. 2 _,(1-2X ) 6.=cos 1-2.d, Table Ultimate Flexural Strength of Members [AIJ, 1987] Rectangular - -..,MII /( bv t./.:) section I,Nu (I 1-A) "2 bd'f, -;rublj'f,,nu/(,lj'./.:),mii/e,lj'./.:) Circular section ~~ (O.-~ill/1"COllo.).T" "ill' O. 12 " 68
85 o t --1~ '" <J <J <J,j '",j "'<J (j) CD t r- <J '" -~---1 b ';;4 \[U L1 '<'W '~) <J <1 (i.) Circular steel tube filled with concrete (ii.) Square steel tube filled with concrete (iii.) Structural steel shape encased in reinforced concrete Figure 1.1 Typical Forms of Composite Columns
86 Temporary Bracin System J~ steel Frame (10 floors max.) ~ Concrete Deck (4 floors max.) - Completed Composite Structure - "I- " " " " Figure 1.2 Construction Sequence of Building with SRC Composite Columns
87 OF'FICE UYOVT Figure 1.3 Three Houston Center Gulf Tower, Composite Tube Frame [Griffis, 1987] 71
88 :lo.o 2'0.0 5 I AO.O 5 I AO Floor Plan,,,,,, '--- STL.BEAMS --"'\ " I, \, \ \ \ \ STEEL BEAMS Composite Shear Wall and Perimeter Frame Figure 1.4 First City Tower Composite Shear Wall and Composite Perimeter Frame [Griffis, 1987] 72
89 ,,0,01>1 0 0 o N 0 I on o...; N ;:::' OlCO co) "'0.- (/) ::::l!e CC 0;:: COQ..!!!..!!!. rot;:: ~E Q)-... ~ ~"'O U C c t'o 00. O(/) "'Om Q) Q) -5ti5 c ::::l c Q.. E I ::::l 0(5 EO Q) Q)... ~ en (/)~ ase u 0 t'oo Q...c E:t:= ::::l :;... en c ~ Q) Q) E E o 0 ::EO LC) "r 73
90 ~~[D ~~11 ~~ [Q] i.'loj! -,n lsi on I no I ~J :..:;$6... ~_ v_n.,,1 outer...t..ie cornu colua.. allulw'l C01UM LcolUJlll'l JF;:lJ ': :'. :J'~ 'r~ I! ~ ; ~ Figure 1.6 CFT Column High Rise Condominium, Tokyo [Endoh et ai., 1991] Figure 1.7 FEM Analytical Model of Connection and Stress Flow in Diaphragm [Endoh et ai., 1991] 74
91 / 2V.. P c tIl~ P col Iv a. = compre~sion strut angle S = bearing width Be =compression strut width v Figure 1.8 Schematic of Panel Zone Shear Test Set-Up 75 '/
92 eft PANEL ZONE SHEAR STRENGTH MODEL st I J -----~ I I I I I I I 2 ' V c =SBcas a f c MODIFIED STRUT MODEL Cat:npressian Field Diaphragm a I..1 V =SBcas45 casa 0.85 ( c V =SBcas45 casa 0.85f ~ c + absin2~ 0.85f~ V c =Bh15 ff: (No Diaphragm) ACI V c =Bh20 ~ (Diaphragm) Figure 1.9 CFT Panel Zone Shear Capacity Models 76
93 ct. I.. 45 deg. ) Hydrostatic Prism.. Figure 1.10 Hydrostatic Prism Formed Along Primary Compression Strut 77
94 ..., Q) "'C (1)....- o "'C (1) :to. > cu... 5i 0.8 E.~ >< >(1) 0.4,...C\lM~ o Q) Q) Q) Q) (J)(J)(f)(J) ~~ ~~ ~-, o d... I )! Strut Model A Strut Model B ACI Figure 1.11 Comparison Between Predicted and Experimental Shear Capacity
95 , ~ 150 g IX <til :I: 100 CI) ~_-..~ SPEClMEN3 SPECIMEN 4 50 _._ _ _ _ _ _. _-_._._ _ _ _- -_. o TRANSVERSE DISPLACEMENT [in] Figure 1.12 Load versus Transverse Displacement of eft Panel Zone Test Specimens 79
96 en 150 C-.- ~"'-' 100 > 50 r- V s =122 kips 1 ~ v ~~ ~, 1/4 11 Diaphragm No Diaphragm o y(rad) Figure 1.13 Effect of Diaphragm on Experimental Shear-Deformation Response tn ~ '-'" > 100 bit =35, V s =122 kips bit =46, V s =86 kips Y(rad) \ - '--..- Figure 1.14 Effect of Tube Width-to-Thickness Ratio (bit) on Experimental Shear-Deformation Response 80
97 ..N.. No I ::. I :- ~ 1.. ;.... Circular column o Square column ;.1.l/~ ; ('."-./ i ' :'. } Ultimate load curve of campsite. "~~J~ structural steel~oncrete column ' '"... '~'" :~: /"" ~ Ultimate load curve of reinforced concrete column N = ultimate axial load No= nominal axial load capacity ~= nominal slenderness ratio o kl r Figure 1.15 Ultimate Capacity of CFT Columns Subjected to Concentric Axial Load [Tomi, 1991] 81
98 . ~ XF-22x75. --"--~6Or--'-'-""""",,--,,,,,,,--,,,,,,... ~..:....;. ~ '~."!o:::.~=;:-.:.~"~~=--.,-+-~~%;e:+==f=f;:===. 0 Figure 1.16 Load - Rotation Angle Correlation [Kato et ai., 1992] p l' PI B _ ts a) Type I b) Type" Figure 1.17 Beam-to-Column Connections [Matsui, 1985] 82
99 '- - ==.:=::0= ~ PLAN ;:=r ~ SECTION A-A ELEVATION PLAN VIEW OF TOP STRAP ANGLES Figure 1.18 Strap Angle Beam-to-CFT Moment Connections [Picard and Giroux, 1976] 83
100 ELEVATION SECTION A A PLAN ~.,.". -~ek- PLAN VIEw OF TOP STRAP ANGLES ::.:'::: :~:I I,0 I I \ ~Welding /,/ I III " I:::: == = ELEVATION ~Dr----- jwelding f==~ ~~~-=-=-"~ J PLAN VIEW OF BOTTOM STRAP ANGLES Figure 1.19 Revised Strap Angle Beam-to-CFT Moment Connections [Picard and Giroux, 1977] 84
101 Figure 1.20 LRFD Beam-Column Interaction Equations [AISC, 1992] 85
102 3000, 2500 co 0- m ai ~ ()... 0 Llm ~ ~ "'"" '" 500 o ~ o ( I, Moment, M (kip - ft) Figure CFT Interaction Curve, ACI Criteria with No Material Reduction Factors or Axial Strength Limitations
103 Internal Diaphragm Figure 1.22 Typical CFT Column-to-Beam Connections [AIJ, 1987] 87
104 N force transs 'ferred by bond concrete-filled stee"i tube M Figure 1.23 AIJ Beam-Column Interaction for CFT Columns [AIJ, 1987] 88
105 co CD III c ~ 'u 750 Ia c. Ia () ~ 700. Ia ell..c: (J) Tube Thickness (in) Figure 1,24 - Connection Shear Capacity per AIJ (1987) as a Function of CFT Wall Thickness
106 co o III Co :i... ~ 1000 '0 III Co III ụ. 900 III Q).c:: CJ) Beam Depth [in] Figure Connection Shear Capacity per AIJ [1987] as a Function of Beam Depth
107 co _ 1300 III Q. ~... ~ 1100 u co Q. co u co.c Q) en Column Width (in) Figure Connection Shear Capacity per AIJ [1987] as a Function of Column Width.
108 Chapter 2 Experimental Program 2.1 General The area of major interest in the experimental study reported herein was the connection between the wide flange beam sections and the concrete filled tube column (CFT) which governed the strength, stiffness, and capacity of the subassemblage. The design of the experimental setup had the requirement that each test specimen simulate as accurately as possible the forces which act on the connection in a multistory composite moment resisting frame (see Figure 2.1). This required that the boundary conditions and the force state in the vicinity of the connection of a test specimen must resemble those of a connection in the prototype building subjected to gravity and lateral seismic loading conditions. Furthermore, the proportions among the members of the material properties of the test specimen had to resemble closely that of the members in prototype structure. To meet these requirements, a subassembly was designed consisting of two wide flange beams attached to a CFT column by a rigid connection for a special moment resisting frame. The prototype building adopted for the study was designed in accordance with the NEHRP (1991), ACI, and LRFD [AISC, 1994] provisions. The NEHRP provision was used to determine the seismic design loads. The ACI and LRFD provisions were used to design the CFT column and wide flange steel beams, respectively. Each test specimen 92
109 represented a full scale model of the connection and adjacent beam and column members of an interior joint at the ninth floor of a perimeter moment resisting frame. The design of each test specimen connection focused on providing strength, stiffness, and ductility for cyclic loading. The force transfer mechanism was studied in order to evaluate the effectiveness of the steel panel zone, encased concrete, and the connection's diaphragm plates on member performance. The diaphragm plates used in the eft connections transferred beam flange forces through the connection, and were either internal (Specimen 1) or external (Specimen 3). 2.2 Prototype Building Frames The prototype building consisted of a 20 story office building structure (Seismic Hazards Exposure Group 2), located in a seismic zone where the effective peak ground acceleration (A a ) and effective peak velocity - related acceleration (A v ) were both equal to 0.4 g's. The assumed soil profile was Type S2 - consisting of a deep cohessionless or stiff clay conditions of depth greater than 200 feet. The prototype building is shown in Figure 2.2. The story height of the structure's first floor was 15'-0" with the remaining floors at 12'-0", resulting in a total height 243 feet. The building had 5 bays at 20'-0", for a total structural width 93
110 of 100 feet. The prototype structure was designed as a perimeter moment resisting frame, with an interior concrete shear wall which doubled as the elevator shaft. The plan ofthe structure (see Figure 2.3) depended on no interior columns, with eight large composite floor girders extending from the perimeter moment resisting frame to the concrete shear wall. These floor girders, in conjunction with floor stringers, supported a composite concrete-metal deck floor system. The design tributary area of each exterior frame in one direction was 30 feet wide by 100 feet long (the full length of the frame), while the concrete shear wall maintained a tributary area that consisted of its own 20' width plus 10' on each side for a total of 40' wide by 100' long. The design dead load for each perimeter frame was calculated from a 20' width by 100' length. The seismic design loads for the prototype structure were based the NEHRP Equivalent Lateral Force Procedure [NEHRP, 1991] (the 1994 edition was not published when the prototype structure was designed). In this procedure the fundamental period of the building (T) in the direction under consideration is first calculated by the following approximation: T a =C h t n 3 / 4 (2.1) where the fundamental period T based on substantiated structural analysis shall be: T~1.2Ta (2.2) 94
111 In Equation 2.1 C t = for moment resisting frame systems of steel which resist 100 percent of the required seismic force, and h n is the height in feet above the base to the highest level ofthe building. For the prototype frame, the period T was determined to be equal to seconds. The seismic base shear, V, is equal to the seismic design coefficient (C s ) multiplied by the total dead load and applicable portions of other gravity loads (W) according to Section 4.2 of the NEHRP, where V=cw 5 (2.3) For the prototype perimeter MRF, W was equal to 4740 kips. following: The seismic design coefficient (C s ) was determined according to the 1.2A v S C =-- 5 (2.4) where A v is the coefficient representing effective peak velocity acceleration, S is the coefficient for the soil profile characteristics ofthe site, and R is the response modification factor, respectively. The values used for A v ' S, and R for the prototype design were 0.4, 1.2, and, respectively 8, where the value of R is stipulated by NEHRP for special (ductile) moment resisting frames. The calculated value of C s using the above values was resulting in a base shear V of 174 kips for the MRF frame. 95
112 The lateral force (Fx) induced at any level representing the seismic forces, is computed per NEHRP from the following expressions: (2.5) where C vx =--- (2.6) in which G vx is the vertical distribution factor, Wi and W x are the portion of the total gravity load 0NJ of the building located or assigned to level i or x, and h x and hi are the heights in feet from the base to level i or x, respectively. In Equation 2.6. the exponent k is related to the building period. The value of 2.0 was used for k in designing a perimeter MRF for the prototype. The static lateral loads calculated above were combined with the standard dead and live loads in order to analyze the MRF for combined load effects. The roof dead and live loads were 60 psf and 30 psf, while the floor dead and live loads were both 80 psf. A live load reduction factor of 20% was applied to the floor live loading. The AISG LRFD load combinations [AISe - LRFD 1994] were checked in conjunction with additional cases recommended by NEHRP (1991), which are ( A v ) DL LL E ( A v ) DL E (2.7) (2.8) 96
113 The load combination controlling the design of most members was one recommended by AISC which is 1.2 DL LL + 1. ae (2.9) In the above expressions, DL, LL and E are the dead load, live load, and seismic loading, respectively, with A v equal to the NEHRP effective peak velocityrelated acceleration coefficient. For the purpose of comparison, two separate prototype frames were designed for the above loads. The first frame was designed utilizing standard wide flange column and beam steel sections in accordance with the LRFD Specifications (AISC, 1994). This resulting design is shown in Figure 2.4. The columns supporting the first eight stories were all W14x176 steel sections, while the columns supporting the ninth through twelfth floor levels were W14x159, and the columns supporting the remaining thirteenth through twentieth stories were W14x109. The girders of the first ten floor levels were W24x62 steel sections, the girders at the eleventh through nineteenth stores were W24x55, while the roof beams were W18x46. The second frame was a concrete filled tube composite column frame designed according to the LRFD specifications discussed in Section 1.3 of Chapter 1. The columns of this prototype frame supporting the first eight stories were each 16x16x5/8 steel tubes, the columns supporting the ninth through eleventh floor levels were 16x16x1/2 steel tubes, with the remaining columns supporting the eleventh though twentieth floor levels 97
114 16x16x3/8 steel sections. All of these steel tubes were designed to be filled with an 8000 psi strength concrete. The girders ofthis frame were identical to those of the wide flange column frame. The design of both frames was found to be controlled by interstory drift criteria per NEHRP [1991], where the drift Ox is based on the elastic displacement oxe from an equivalent lateral load analysis, which are multiplied by the factor CD: (2.10) A value of CD equal to 5.5 was used, where the interstory drift limit of 1.5% was required in accordance with NEHRP [1991]. The equivalent lateral loads for the strength design and drift control checks based on NEHRP criteria are shown in Figures 2.5 and 2.6, respectively. The loads associated with the drift check are smaller because the structural period T is not required to satisfy Equation 2.2. Both frames were checked to ensure that a weak beam - strong column design existed in accordance with NEHRP provision [NEHRP, 1991], where the beams are designed to yield during extreme lateral seismic loading, with the columns remaining essentially elastic. An economical comparison of the two separate frames was conducted in reference to steel weight of each frame, and summarized in Table 2.1. It was found that the composite CFT column frame offered a substantial steel weight 98
115 advantage if all other relative costs, such as the cost of connections, could be kept relatively equal. The experimental subassemblage was taken from the ninth floor at an interior beam - column of the CFT system, where the columns above and below this floor were 16x16x1/2 steel sections with 8000 psi concrete and the floor girders were W24x62 sections. The column design was based on the interaction curve relating the member's capacity to uniaxial bending and axial load for the calculated prototype seismic and gravity loads, in accordance with the LRFD and ACI provisions for composite columns, discussed in Section 1.3 of Chapter 1. The prototype column had a gravity load of approximately 500 kips, at which the flexural capacity per ACI was 12,394 kip-in accounting for material reduction factors. 2.3 Experimental Setup The experimental setup was based on the force state developed at the CFT to wide flange connection when the frame was subjected to gravity and lateral seismic loading (see Figure 2.7). The member forces include axial (P), shear M, and flexural forces (M). At column mid height between floors at the eighth and ninth level, and at midspan of the east and west beams of the prototype building, inflection points were assumed. The experimental setup subassembly resembled the column and beams between these inflection points, 99
116 having a specimen column height of 12 feet and a beam length of 10 feet to each side of the center of the column. The combined force state was introduced into the specimen by subjecting it simultaneously to axial load (P) and lateral load (H). The diagrams for axial load (P), shearm, and flexural force (M) for the test specimen, which represent those ofthe prototype subassembly, are shown in Figure 2.7(b). A schematic of the experimental setup is given in Figure 2.8, with a photograph of the actual experimental setup appearing in Figure 2.9. Under the applied axial load P and the horizontal load H, the subassembly had the requirement that it displace as shown in Figure 2.1 O(b) where the ends of all the members were free to rotate. The base of the column specimen in the experimental setup was bolted through a base plate to a clevis fixture attached to the laboratory floor. The clevis acted as a cylindrical bearing and was post tensioned to the laboratory's reaction floor in order to allow rotational movement yet restrict lateral displacement at the column base. The ends of both the east and west wide flange beams were attached to rigid links through a clevis (e.g. cylindrical bearing) each located 10 feet from the center of the column, as shown in Figure 2.8. The lower end of each rigid link was fastened to a clevis, which was post-tensioned to the floor. The rigid links and clevises arrangement enabled the beams to move freely in the east and west directions, while restricting only the movement at the ends of the beam in the vertical direction, 100
117 thus simulating a roller support as shown in Figure 2.1 Ob. The axial load (P) was applied to the specimen using a loading beam and a pair of three inch diameter tension rods, which were connected to a pair of clevis fixtures and posttensioned to the floor. Each rod was constrained at the load beam by a nut and washer placed on top of a calibrated load cell, which rest upon a hydraulic hollow core ram that reacted against the load beam, to create a tension load of 0.5P in the rod. This axial load setup enabled a constant load of P to be applied to the column using a pressure regulator in the hydraulic system for the hollow core jacks to maintain a constant axial load. A hydraulic actuator was mounted between the reaction wall and the specimen column, at a height of 12 feet above the center of the clevis at the base of the column. The actuator, secured in place by post-tensioning rods, was used to impose the lateral load (H) to cause lateral displacement (Ll) to the test specimen. The column of the test specimen was braced for out-of-plane displacement in the north-south direction utilizing a Watts bracing mechanism [Yura,1967l The Watts mechanism devices were essentially rigid links with spherical bearing at each end, which were attached to the specimen at the top and two feet above the base of the column. This scheme permitted displacement in the east-west direction of 11 inches, and in the vertical direction of up to 9 inches, while restricting movement in the north-south direction with minimal friction forces developing. The beams were each braced at five foot 101
118 intervals along their lengths, using channels to prevent out-of-plane movement (see Figure 2.11). This permitted movement in the East-West and vertical directions. Frictional forces between the beams and the channel flanges were minimized by greasing their surfaces. 2.4 Specimen Details A total of two specimens were designed and tested to date, and are noted as Specimens 1 and 3, respectively. The connection details for both specimens are given in Figures 2.12 and The connection details and panel zone were designed to resist the maximum expected beam forces that would develop, and which were based on a flexural moment of 1.25 M p, where M p is the beam flexural capacity that existed at the end of the cover plates (Specimen 1) or at the end of the structural tees (Specimen 3). Both specimens were constructed from 12'-0" long steel tubes of the same heat and filled with concrete batched on the same date. The concrete was placed after all welding was completed. Twelve foot long W24x62 beams were each framed into opposite sides ofthe column specimen at a height of 6'-0" above the center of the clevis' pin at the base of the column. Each specimen was mounted on a 21" x 21" x 1" bas~ plate that was fillet welded to the base of the column, utilizing eight-one inch A325 bolts which were post tensioned to secure the column base plate to the clevis fixture to minimize slippage. Although the distance from center line ofthe 102
119 column to the inflection point on the beam was 10 feet in the prototype and experimental models, 12 foot beams were acquired, leaving a two foot overhang. This permitted the beams to be reused in subsequent tests by removing them and turning their respective ends around. Both specimens were equipped with six 4 1/2" x 5/8" shear studs mounted on the reverse side of the shear tabs at a 3" spacing. A typical shear stud was mounted by drilling a 5/8" diameter hole on the outer face of the steel tube, inserting from inside the tube the stud approximately one half of the depth into the hole, and welding the stud to the steel tube using E70x18 welding material and the self shielded submerged metal arc welding (SMAW) process. Shear tabs on both specimens consisted of 4 1/2" x 15" x 1/2" plates, which were welded to the face of the tube using E70x18 welding material and a double bevel groove weld placed by the SMAW process. Each tab consisted of A36 material with five drilled 1 1/16" diameter holes for the five - one inch diameter A325 bolts necessary to resist the shear on the beam due to gravity and seismic loading. The access holes on the four beams were designed according to the LRFD seismic provisions, in order to prevent any notch effect from occurring. Specimen 1 was considered the base case for the experiment. This specimen was fabricated with two 5/8" thick diaphragm plates, each with a 6" diameter hole located at the center of the plate. The LRFD, ACI and NEHRP provisions offered little to no direction for the design of the diaphragm plates. 103
120 Consequently the design was based on the previous work of Matsui [1985] using Eqns and 1.80, along with the requirement that the diaphragm plate had to be at least as thick as the flange of the connecting beam flange [AIJ, 1987]. The design force spain Matsui's approach was equated to resist the maximum beam flange tensile force where Mmax Tmax = -- db (2.11 ) in which db is the beam's depth. In Eqn the moment Mmax is that at the face of the column and is based on extrapolating the maximum expected beam flexural capacity of 1.25 M p from the end of the connection region at the column face. These plates were welded to the inner face of the structural tubing using the flux core arc welding process in conjunction with E71T-1 electrodes and an argon - carbon dioxide shielding gas to create a single bevel groove weld with R=1/4" and a=45, where R and a are the root opening and groove angle, respectively. The structural steel tube was cut at two locations, one foot from both the top and bottom diaphragm positions, in order to weld the diaphragm plates to the inside of the tube. The tube was then welded shut using a single bevel full penetration groove weld. The flanges of the beams connected to the column of Specimen 1 were fastened, using field welding techniques. Each beam flange was beveled at a 45 angle and were welded to the specimen with a single bevel groove weld (R=1/4") using the self shielded flux core arc welding 104
121 (FCAW) process with NR311 Ni electrodes. All of the backing bars were removed, the exposed weld back-gouged, and using NR232 electrodes and the self shielded FCAW process a 1/4 inch fillet weld was placed. The shear tabs on both sides of the CFT column were welded to the web of the beam using E70x18 electrodes and SMAW over a 3 1/2" length on the top and bottom of the tab and a total of 8" in the vertical direction. These welds were required for a W24X62 and designed for a capacity of 20% of the web's moment capacity in accordance with the AISC - LRFD seismic provisions (AISC 1994). Coverplates for each beam flange were attached to the face of the structural tube by full penetration welds using NR-311Ni electrodes and the self-shielded FCAW process. The plates were welded to the beam flanges using 1/2 inch fillet welds. The coverplate stubs consisted of 7/8" x 3 1/2" x 6 3/4" plates for the top flanges and 7/8" x 3 1/2" x 7 1/4" plates for the bottom flanges. Specimen 3 was designed with external diaphragms. These diaphragms were fabricated from ST7.5x25 structural tee sections, and are shown in Figure The tees were designed to transfer to the panel zone the beam's maximum tensile flange force Tmax' which was calculated using Eqn (2.11) A section passing through the tee at an angle of e=19.29 from the face of the column, as shown in Figure 2.14, was assumed to resist one half of this flange force Tmax by yielding the tee's area As. Thus, on this basis to resist the flange force Tmax, it was required that: 105
122 (2.12) in which cry is the tee's yield stress and ~ the LRFD material reduction factor of 0.9. The tee sections were welded to the flange of the beam, as was the beam flanges welded to the column, using the same full penetration welding specification as in Specimen 1 for the beam flange to column weld. The edge of the beam flange and the cut web of the tees also were welded to the outer face of the column using this same full penetration weld as for the beam's flange with the NR-311 Ni electrodes. All welds were single bevel groove welds where u=45 and R varied slightly. Only the backing bars of the beam flanges were removed, the exposed material and debris backgouged, and 1/4 inch fillet weld placed. The vertical edge of the tee flanges were welded to the edge of the structural tube using E70-18 electrodes. A 1/4 inch E70-18 fillet weld was then placed on the backside of the tees' flanges as shown in Figure The shear tabs of specimen 3 were welded to the web of the beams in the same manner as Specimen 1. The panel zone shear capacity of both specimens was checked using the modified panel zone strength model (Eqns through 1.73), to ensure that it could resist the panel shear force caused by the flexural beam moments developed at the face of the column. These moments were based on extrapolating the flexural capacity of 1.25 M p at the end of the coverplates (Specimen 1) or structural tees (Specimen 3) to the face of the column. 106
123 Measured dimensions of the cross-sections of the wide-flange beams, columns, and critical connection details are given in Tables 2.2 through 2.5. Included in Tables 2.2 and 2.3 are calculated area (A), moments of inertia (Ix), and plastic section modulus (Zx) based on measured dimensions for the beams and column's steel tube. 2.5 Material Properties The design strengths for the structural tubing, fabricated from A500 Grade 8 material, were based upon a nominal yield strength of 46 ksi, with the nominal design strengths for the W24x62 beams based on A36 steel. The structural steel tubes were manufactured by a cold formed process, and were from all the same plate material produced in a single heat. The wide flange sections for Specimen 1 and Specimen 2 came from two separate heats. Material properties for the steel shapes and the interior diaphragms were determined from uniaxial tension tests in accordance with ASTM standard test methods for tension testing of metallic materials [ASTM, 1991]. The properties are presented in Tables 2.6 through 2.8, where E, Fy, and Fuare Young's modulus, the yield and the ultimate stress, respectively. The W24x62s used in Specimen 1 had an average measured yield stress of 49.6 ksi and 42.5 ksi in the web and flange, respectively, where Specimen 3 had 50.5 ksi and 43.3 ksi. Typical stress-strain curves for a beam's web and flange of Specimen 1 are shown in Figure
124 The average yield stresses for the top and bottom diaphragm plates of Specimen 1 were 41.0 ksi and 40.4 ksi, respectively, where the average yield stress for the structural tees for Specimen 3 were 40 ksi. The concrete's nominal 28 day - design strength was 8000 psi for both specimens, as noted previously. Actual concrete compressive strengths, fe' for the different specimens were determined from compression tests on six by twelve inch cylinders on the day of each test, as per ASTM standard test methods for compressive strength of cylindrical concrete specimens [ASTM, 1991]. Young's modulus, E, for each of the specimen cylinder tests were calculated according to the ACI code [ACI -1992], where: E = 57000~fe (fein psi) (2.13) The results ofthese tests are presented in Table 2.9. It was found that the average measured concrete compression strength of 6300 psi was below the specified nominal value of 8000 ksi. 2.6 Instrumentation The instrumentation used for each of the CFT column specimens was designed to measure response which was judged to be critical in determining the test specimen's performance under cyclic loading. These measurements included: lateral and vertical movement of the subassembly; axial, lateral, and rigid link loads; panel zone deformations; strains in the flanges of the W24x62 108
125 beams and steel tube of the column; as well as rotations of the column and beams. Except for minor strain gage location changes, the instrumentation plan for Specimens 1 and 3 was essentially consistent. Sting potentiometers were placed along the height of each test specimen in order to measure the lateral displacements of the column under cyclic lateral loading. The position of these instruments is shown in Figure As shown in this figure, lateral displacement measurements were taken at height locations corresponding to: the bottom of the column, 4 inches below the bottom of a beam, 4 inches above the top of a beam, and the top of the column (actuator height). An exception to these locations is where in Specimen 1 the lateral displacement above the beam was taken at inches at this location. A linear variable differential transformer (LVOT) was placed at the bottom of the clevis fixture at the base of the column in order to measure any lateral movement between this fixture and the floor. An LVOT was also place between this same clevis and the specimen to measure any relative movement between the two. Two string potentiometers were placed at the end of each beam in order to measure vertical and torsional movement of the beams at the rigid link locations. Typically, each string potentiometer was located at approximately 10 inches to the north and south sides from the centerline of the beam. To measure the deformation of the panel zone, two separate methods were used. In the first method two LVOTs were placed at each face of the eft 109
126 panel zone. These instruments extended diagonally across the panel zone from the far corners, at elevations where the beam flanges intersected with the column (see Figure 2.17). These LVOTs were effective in measuring the deformation /). along each diagonal, where the panel zone shear deformation (y) is calculated by: /).1 - /).2 d y= ( )*(-) 2 b*h (2.14) where /).1, /).2, h, b, and d are the change in length of one diagonal LVOT, the change in length of the other diagonal LVOT, the vertical distance between LVOT mounting ends, horizontal distance between LVOT mounting ends, and the gage length of the diagonal LVOT mounting system. Three rosettes were also placed on the outside surface at the center height of each face of the panel zone (Figure 2.18). The shear deformation y was determined using the strain information collected from these gauges from the following relationship: (2.15) In Eqn. 2.15, EO, EgO, and E45 are the recorded horizontal, vertical, and diagonal (45 ) strains, respectively, of a rosette. The rotations of the eft were measured at four locations along the height of the column on the north face using inclinometers. Each inclinometer was mounted to a metal plate bracket which, in turn, was fastened to the specimen 110
127 by a 1/4 inch by 1/2 inch long hex nut that had been tack welded to the steel tube. Rotations of both the east and west beams were measured using two inclinometers located on the web at center height of each beam adjacent to the shear tab. The position of all inclinometers are shown in Figure Strains in the steel tube and the W24X62 beams were measured using strain gauges. Pairs of strain gauges were placed on both the east and west outside surfaces of the structural tube at and 24 inches above and below the beam flange at a distance of 7 inches apart (see Figure 2.19), resulting in a total of 16 column gauges. A pair of strain gauges were also placed on the top and bottom flange of each beam, each gage spaced 4 inches apart. For Specimen 1, these gauges were located 2 inches from the edge of the cover plate stub, resulting in a distance of 5 1/2" from the east and west face of the 4~ CFT column. An additional pair were located at 4 feet from the CFT column face. A typical layout for the beam strain gages is given in Figure Strain gauges were also placed on the top and bottom interior diaphragms of Specimen 1 in order to observe force transfer through the diaphragm plates. The layout for the diaphragm plates is given in Figure 2.21 and For Specimen 3 the beam flange gauges were located at 5 1/2" and 4 feet from the east face of the column, on both the top and bottom flanges (see Figure 2.23). On the west beam of Specimen 3, two gauges were placed 4" apart on the beam flanges, at 2" and 4 feet from the face of the column. At the 2" 111
128 distance from the column face the west external diaphragm was gauged by placing strain gages on the web and flange of the structural tees (see Figure 2.23 and 2.24). Two strain gauges were also placed 4 inches apart on the flanges of both beams of Specimen 3, at 1 inch from the edge of the external diaphragm in order to detect beam yielding outside of the external diaphragm (see Figure 2.23). The east and west beams had their respective flanges gauged identically. Calibrated load cells were used to monitor the applied axial load P and lateral load H, as well as the reaction axial force developed in each rigid link. 2.6 Test Procedure Prior to testing, each specimen was white washed in the vicinity of the connection in order to visually detect any signs of the steel yielding. Each specimen was tested under cyclic lateral displacement control with respect to the top of the column. The displacement history is shown in Figure 2.25, and is in accordance with ATC-24 [1992]. The displacement history was imposed by the horizontal hydraulic actuator, using proportions of the yield displacement l1 y as a basis. A test proceeded with cycles of displacement amplitude of O.25I1 y O.5I1 y, O.75I1 y, l1 y y, 211 y 3I1 y... Prior to imposing lateral displacement, a targeted axial load of P=450 kips was applied to the column. Each cycle of displacement involved imposing symmetric displacements in the east and west direction with 112
129 respect to the initial plumb position of the column. The yield displacement fly was associated with the flexural capacity of the beams, and was determined from extrapolating from the displacements at first yield moment My in the beams to the displacements corresponding to beam flexural capacity M p. A test was terminated when either a specimen reached a displacement ductility of ~ = 6fly, or its capacity deteriorated below 80% of its peak resistance. Prior to conducting the above test, each specimen was subjected to a set of elastic cycles of displacement (e.g. fllessthan fly) to investigate the column's elastic lateral stiffness under different levels of axial force P. These initial sets of tests involved axial loads of 0 and 225 kips, respectively. 113
130 TABLE 2.1 ECONOMICAL COMPARISON OF CFT AND WF MOMENT RESISTING FRAMES (Complete Building) t>. Maximum Total Steel Approx. Approx. Total Factored Frame Weight Concrete Steel Cost Concrete Cost Inter-story [Ibs] [cy] [$] Cost [$] [$] Drift (%) CFT Column Frame WF Column Frame Cost Difference
131 Table 2.2 Average Beam Dimensions and Properties for Specimens 1 and 3 depth tw b f t f Area Ix Zx in in in in in 2 in 4 in Specimen 1 Measured - East Beam Measured - West Beam Nominal (W24x62) Specimen 3 Measured - East Beam Measured - West Beam Nominal (W24x62)
132 Table 2.3 Average Column Dimensions and Properties for Steel Tubes of Specimens 1 and ) Outer Wall Area I Z Dimens. Thickness in in in 2 in 4 in 3 Specimen #1 Measured , Nominal (16x16x1/2) Specimen #2 Measured Nominal (16x16x1/2) Table Average Measured Diaphragm Dimensions. Specimen 1 Hole Diameter [in] Plate Thickness [in] Top Diaphragm Bottom Diaphragm
133 Table Average Measured Dimesions for Specimen 3 Exterior Diaphragm It t f b f b t t 1 tw t 2 a..>...>. ---J [in.] [in.] [in.] [in.] [in.] [in.] [in.] [rad] East Side Connection North Top South Top North Bottom South Bottom Average West Side Connection North Top South Top North Bottom South Bottom Average Combined Average Note: It = the length of the tees along the beam t f = thickness of the tee flange b f = width of tee flange b t =depth of tee along eft measured from the edge of the beam flange to the outer tee flange t 1 = thickness of tee flange measured along beam flange tw = thickness of tee web t 2 =thickness of tee flange measured along CFT a = angle between beam flange and tee flange
134 Table 2,6 Measured Beam and Column Material Properties Specimen #1 Fy F u E ksi ksi ksi Beam Flanges * , Beam Web * 49, Nominal Columns ** 46.0 Specimen #2 Beam Flanges** Beam Web ** Nominal Columns ** 46,0 *Based on Tensile Tests **Based on Mill Report Table 2.7 Measured Diaphragm Plate Material Properties Specimen #1 Fy F u E ksi ksi ksi Top Diaphragm Plate * Bottom Diaphragm Plate * Nominal * Based on Tensile Tests 118
135 Table 2.8 Structural Tee Material Properties F y F u E ksi ksi ksi Specimen #1 Top Diaphragm Plate "" Bottom Diaphragm Plate "" Noniinal ""Based on Mill Report Table 2.9 Measured Concrete Material Properties fc psi E AC1 ksi 28 Day Strength Strength at Day of Test Strength at Day of Test
136 ./ t Assumed Inflection Point Diagonal Concrete Compression Strut.-- ~ o~ ~ N a hl(1:,~~:l)]d ~ ọ.,- <It Assumed Inflection Point ~ o~ t ' '-- Shear in Column and Panel Zone Moment in Column and Panel Zone 1----~~~~~~r~~--tI Figure Shear and Moment in Panel Zone Due to Seismic Lateral Loading
137 228'-0" " / / V V V,-V V /,- V " 100'-0" 20'-0" Figure 2.2 Prototype Building Elevation 121
138 Composite Floor~~ Girder ~ Perimeter Moment Resisting Frame (Typ.) 1;11 I?,.,..., / ~",,,:. ":' ".0:' - '... '... -:"--.O;:~P Concrete Ir Shear Wall 100'-0" 5 r-r CFTorWF 1/ Column (Typ.) Corregated Decking( f--pt- I \ k \ \ 100'-0" 5 20'-0" ~ WF Beams with Composite Slab Figure Prototype Typical Floor Plan 122
139 ->. N c.v I ~ ~lym /1... o u.. 20 ' " i Floor Beams Columns 20 W18x46 W14x109 16x16x3/8 19 W24X55 W14x109 16x16x3/8 18 W24X55 W14x109 16x16x3/8 17 W24X55 W14x109 16x16x3/8 16 W24X55 W14x109 16x16x3/8 15 W24X55 W14x109 16x16x3/8 14 W24X55 W14x109 16x16x3/8 13 W24X55 W14x109 16x16x3/8 12 W24X55 W14x159 16x16x3/8 11 W24X55 W14x159 16x16x3/8 10 W24X62 W14x159 16x16x1/2 9 W24X62 W14x159 16x16x1/2 8 W24X62 W14x176 16x16x5/8 7 W24X62 W14x176 16x16x5/8 6 W24X62 W14x176 16x16x5/8 5 W24X62 W14x176 16x16x5/8 4 W24X62 W14x176 16x16x5/8 3 W24X62 W14x176 16x16x5/8 2 W24X62 W14x176 16x16x5/8 1 W24X62 W14x176 16x16x5/8 Factored Interstory Drift Figure 2.4 Prototype Perimeter Moment Resisting Frame for CFT and WF Column Systems
140 [kip] I ~ ~'IA1M ~ Figure 2.5 NEHRP Equivilent Lateral Loads For Strength Design - eft and WF Column MRF Frames 124
141 [kip] I ~ ~la1u U Figure 2.6 NEHRP Equivale Lateral Loads for Inter-story Drift Design - CFT and WF Column MRF Frames 125
142 Gravity Load _~ ~ i j Jj N (J) "0 co o -l u 'E en 'Q) en J.. --.:f. -- (~h -- L:Zt ~ ~"'ll-+""l-rl TI--I _ P H + &Jh -it H t LiJ L p (X) ~D~ V(X) + M(X) ~~ - (a.) Prototype Structure (b.) Experimental Subassembly and Member Forces Figure 2.7 Test Configuration
143 Calibrated Axial Load Cell Load Cel Actuator (For Horizontal Cyclic Load) Hollow Core Actuator Axial Loading Beam Tension Rod (North & South Side of Specimen) CFT Column (16 x 16 x 1/2)... Ṉ --.l West CFT Column-to-Beam Connection East h Cylindric Bearings Load Cell Rigid Link "I I / Load Ce Rigid Lin L Figure 2.8 CFT Connection Structural Subassembly Test Setup

144 Figure Photograph of Test Setup 128
145 Figure Photograph of Test Setup 128
146 Gravity Load 6. t t Pin Earthquake Load...- _~--_..J--_...I-o-- r-:t:=--inflectio n points... N co I I ~ 1- interior -4--' joint...-~ 1 I...,'" steel beam Roller ~ West East (a) Prototype Composite CFT Joint (b) Experimental Setup Figure 2.10 Kinematics of (a) Prototype Structure in Connection Region, and (b) Experimental Setup
147 'ro< A - Watts Bracing Location ~ - Bracing Element C4x w o C8x11.5 SECTION A-A Figure 2.11 Elevation of Lateral Bracing
148 Interior Diaphragm NR-311 Ni NR232 f====~~:s::::s:::c::ic Cover Plate Jt 7/8x6 3/4x3 1/2 ==u:::a::;fr=~===== E70xx, Typ. W24x62 1" A325 Bolt I( 4x15x1/2. - Structura,l V:. Tube 16x16x1/2 E70xx, Typ. Cover Plate I( 7/8x7 1/4x3 1/2 1/2" Dia. x 4 1/2 Shear Stud _._..-_._._._~ ::: Section A-A E71T-1 Figure 2.12 Connection 1 131
149 NR-311 Ni NR232 [7 1/2" Dia. x 4 1/2 Shear Stud 17 1" A325 Bolt W24x62 FL 4x15x1/2 ST7.5x25 " Structural ~ Tube 16x16x1/2 'I..rr----< E70xx, Typ. v NR-311 Ni Section A-A DETAIL 1 E70x18 DETAIL 1 E70x18 Figure 2.13 Connection 3 132
150 I======~ o 19.3 rj -... T u o 19.3 Figure Section Resisting One Half of Flange Force, Specimen 3 133
151 70 Stress vs" Average Strain Tensile Coupon - Specimen 1 Beam Web l.... I! 40 VJ ~ Ul Ul Ql..... en Average Strain [in\in] Figure 2.15(a) - Typical Stress-Strain Curve for Beam Web of Specimen 1
152 Stress vs. Average Strain Tensile Coupon - Specimen I Beam Flange w I ~ III III Q) (/) Average Strain [in\in] Figure 2.15(b) - Typical Stress-Strain Curve for Beam Flange of Specimen 1
153 Inclinometer (Typ.) I... A String Pot- <t Lateral Load... w (J) West String Pot on Both Sides of Beam East and West 4'~ ttl Spec. 1 Only East J 11.25" I""" 0 String Pot t J 4" it ttl I... 0 u;::::::;:1j I -.t4" - t -, - p' LVDT------c... J Figure Lateral, Rotational, and Beam Displacement Transducer Instrumentation
154 b h W24x62 - Structural Tube 16x16x1/2 Sliding Mechanisms with LVDTS To Measure Diagonal Deformation of Panel Zone (Placed on both Faces) h b d in in in Specimen 1 North Face South Face Specimen 2 North Face South Face Figure Panel Zone Displacement Transducer Instrumentation 137
155 45 Deg. Rossette (Typ. Both Faces) W24x62 Structural Tube 16x16x1/2 Figure Panel Zone Strain Gage Instrumentation 138
156 m m Column Strain Gages - Typ. Both Faces 2 7/8" 2 1-0" W24x62 m [!] 27/8" 2'-0" m [!] I.. 7" ~ Figure Column Strain Gage Instrumentation (East and West Faces) 139
157
158
159
160
161
162
163
164
165
166
167 A photograph of Specimen 1 at the end of Cycle 24 is shown in Figure 3.7, where beam flange and web yielding is evident, as well as fracture in the upper beam flanges. The maximum plastic rotations that developed in the beams at the peak displacements in the west and east directions were and radians. Upon removing the cover plates from the top 'flanges of the beams following the test, minor cracks were detected in the east wall of the steel tube column. This cracking was located in the material of the tube wall that was between the interior diaphragm and beam flange, and appeared to have developed under the tension force exerted by the beam flange. A photograph of this crack is shown in Figure 3.8. Ultrasound tests were conducted before fabrication and indicated that no discontinuities or flaw existed in the through thickness direction of the steel tube. 3.2 Specimen 3 The lateral load-displacement (H-~) hysteretic response for Specimen 3 is shown in figure 3.9. A photograph of Specimen 3 taken at the onset of testing is shown in Figure Prior to imposing the ATC-24 displacement history, Specimen 2 was subjected to six cycles of elastic deformation with a column axial load, P, of 0 kips and seven cycles of elastic deformation with a column axial load, P, of 255 kips. The purpose of these thirteen cycles of displacement was to verify the 150
168 operation of the test setup and instrumentation, as well as, acquire data in order to evaluate the column's lateral stiffness under different levels of axial load. It was found that the average lateral stiffness in the test specimen for the first six cycles remained at approximately 68 kipslin. The average lateral stiffness in Specimen 3, when subjected to an axial load of 255 kips, was found to be 70 kips/in. The remaining portion of the test involved subjecting the specimen to the ATC-24 displacement history with a column axial load of kips, which resulted in 17 additional cycles before failure had occurred. Cycles 1 through 6 involved the application of the six elastic displacement cycles, while during Cycle 6 the displacement ductility Il was 0.75, which corresponded to 0.93 inches of lateral displacement and 71.2 kips of lateral load. The elastic lateral stiffness associated with the lateral displacement at the top of the column ofthe subassembly averaged 72 kips/in. Based on the measured displacement for Cycle 6, it was determined that the lateral displacement 1:1 corresponding to Il = 1.0 was 1.4 inches. During Cycles 7 through 9, Specimen 3 was subjected to the lateral displacement ductility of 1l=1.0, which required a horizontal load of H equal to 93.6 kips to achieve the displacement of1:1=1.4 inches. During these cycles yielding was observed to occur in the top and bottom flanges of the beams. The yielding extended to a distance of 40 inches from the face of the column where flaking of the whitewash were observed. The strain gauges, 151
169 which were located on the beam flanges at one inch outside of the tees, indicated that the beam flanges had yielded. According to the data which was collected during the experiment and analyzed after the completion of the test, the strain gauges on the web and flanges of the tees indicated that no yielding had yet developed in these elements. This was consistent with the fact that no cracks or flaking were observed in the whitewash placed on these elements. Also, at this load flaking in the whitewash that covered the beam's web below the ( \ yielded flanges was observed, indicating yielding in the region of the beams. No local flange buckling in either the beams or the tees was observed. A photograph showing the beam flange yielding in the connection region is given in Figure The next three cycles of displacement (C,ycles 10, 11, and 12) involved a displacement ductility of ~=1.5, which corresponded to I!::. equal to 2.1 inches. During Cycle 10 yielding occurred in the web of both beams next to the shear tab, as well as in the flanges of the four tee sections. This yielding, as well as that in the beam flanges continued during Cycles 11 and 12. No yielding was observed in the webs of the tee sections. The lateral load - displacement response (H-I!::.) remained stable, with a reduction in stiffness occurring at displacements in the east and west directions beyond I!::. equal to 1.4 inches due to beam yielding (see Figure 3.9). The applied lateral load was 112 and 115 kips when the west (pull) and east (push) displacements of I!::. equal to 2.1 inches 152
170 were achieved. At the completion of a ductility level of Jl=1.5 no local buckling in the beam flanges was observed. Cycles 13, 14, and 15 involved subjecting the top of the column to a displacement ductility of Jl=2.0, which corresponded to a displacement and interstory drift of 2.79 inches and 2%, respectively. The lateral load H corresponding to the peak west and east direction displacements was 124 and 121 kips. During these displacement cycles the yielding in the beams and the flanges of the tees became more pronounced, with yielding also occurring in the web of the tees. The onset of local flange buckling was observed in the beams, occurring just outside the connection region where the tees were located. The strain gages indicated that the flanges ofthe tees which corresponded to the tension flange of the beam developed significantly greater strain that the tees attached to the beam compression flanges. Figure 3.12 shows a photograph of.the connection region of Specimen 3 corresponding to a displacement of Jl=2.0. Cycle 16 involved a displacement amplitude of 0.5 inches, and therefore only elastic specimen deformations. During the first half of cycle 17, where the top of the column was subjected to a displacement ductility of Jl=3.0, a noticeable fracture developed at the edge of the east beam's top flange. This fracture initiated near the toe of the weld at the end of the tee, see Figure As the peak displacement /). of 4.35 inches was achieved, corresponding to Jl=3.0 and requiring a lateral load of H 153
171 equal to 129 kips, the crack had propagated about 1.5 inches across the beam's flange towards the web. Similar, but only minor fractures were also observed in the other beam flanges. The strain gauges located 1 inch from the flange fractures measured tensile strains between 10 to 12 times the yield strain, indicating that a strain concentration existed at the flanges where cracks occurred. This provided evidence that the fractures were caused by strain concentrations in the flanges. The tensile strain in the tee section webs, according to the strain gauges, had just approached yield, with the tensile strain in the flange of the tees showing 8 times yield. A photograph of Specimen 3 at the end of Cycle 17 is shown in Figure 3.13 and 3.14, where beam flange yielding is evident. The maximum plastic rotations, 8 p, that developed in the beams was radians, which occurred at the peak displacement of /). equal to 4.35 inches in the east direction. Upon completing the first half of Cycle 17 the test was terminated. Although the hysteretic response was stable and showed no signs of deterioration, it was decided to avoid further fracture by stopping the test in order that the specimen be rehabilitated to reduce strain concentrations. The repaired specimen would be then be tested at a later date. 154
172 150 Load vs. Displacement Specimen #1 100 Push (East) ->. c.j1 c.j1... c. I~ I " 0 Cll -I I if Y /1!?'/ /' Pull -100 I /I I ~ (West) -150 ', o Displacement - Delta [in] Figure 3.1 Lateral Load - Displacement Response, Specimen 1.
173 8 6 Pull I. I I. 4 ~ :i:i 2 0 :::J c: Q) E Q) 0-2 m Co In (5-4 Elastic R:f:ngePlastic Range L.., ~~nl II..1 Cycle 7-2 inch lateral displacement over 1 half cycle to bring column to vertical position. I 3.0 I...Irl. I CJ1 (» Push -8 I Cycle Number Figure 3.2 Modified Displacement History Involving Seven Initial Cycles, Followed by ATC-24, Specimen 1
174 ;."-~...,. /' -/-, -\.,-, 1 '(, ~;I--/ - - j l I I I. \ Figure Specimen 1 Before Testing 157
175 Figure Specimen 1 Before Testing 157
176 \ "'tl~<~::.:',;} f. ~.!r" ~ ~ -:..,--:-;-._-... ' '.. >f~\,\':" ','I...,. \ ~..._IIL!J_-", -II,:': '.~' CFT_ calm SPE~-.! " \ JUllE DISP CYCLE ' ~ ~~TERAL LOAO. ----'1-k'PS "~-~'" ~....-;- Figure Specimen 1 - Cycle 7 158
177 FIgure Specimen 1 - CycIe 7 158
178 Figure Specimen 1 - Cycle 22 (ll =2.0) 159
179 Figure Specimen 1 - Cycle 22 (fl =2.0) 159
180 Figure Specimen 1 - Cycle 24 (~ = 3.0) 160
181 Figure Specimen 1 - Cycle 24 (~l =3.0) 160
182 Figure Specimen 1 - End of Cycle 24 (~ =3.0) 161
183
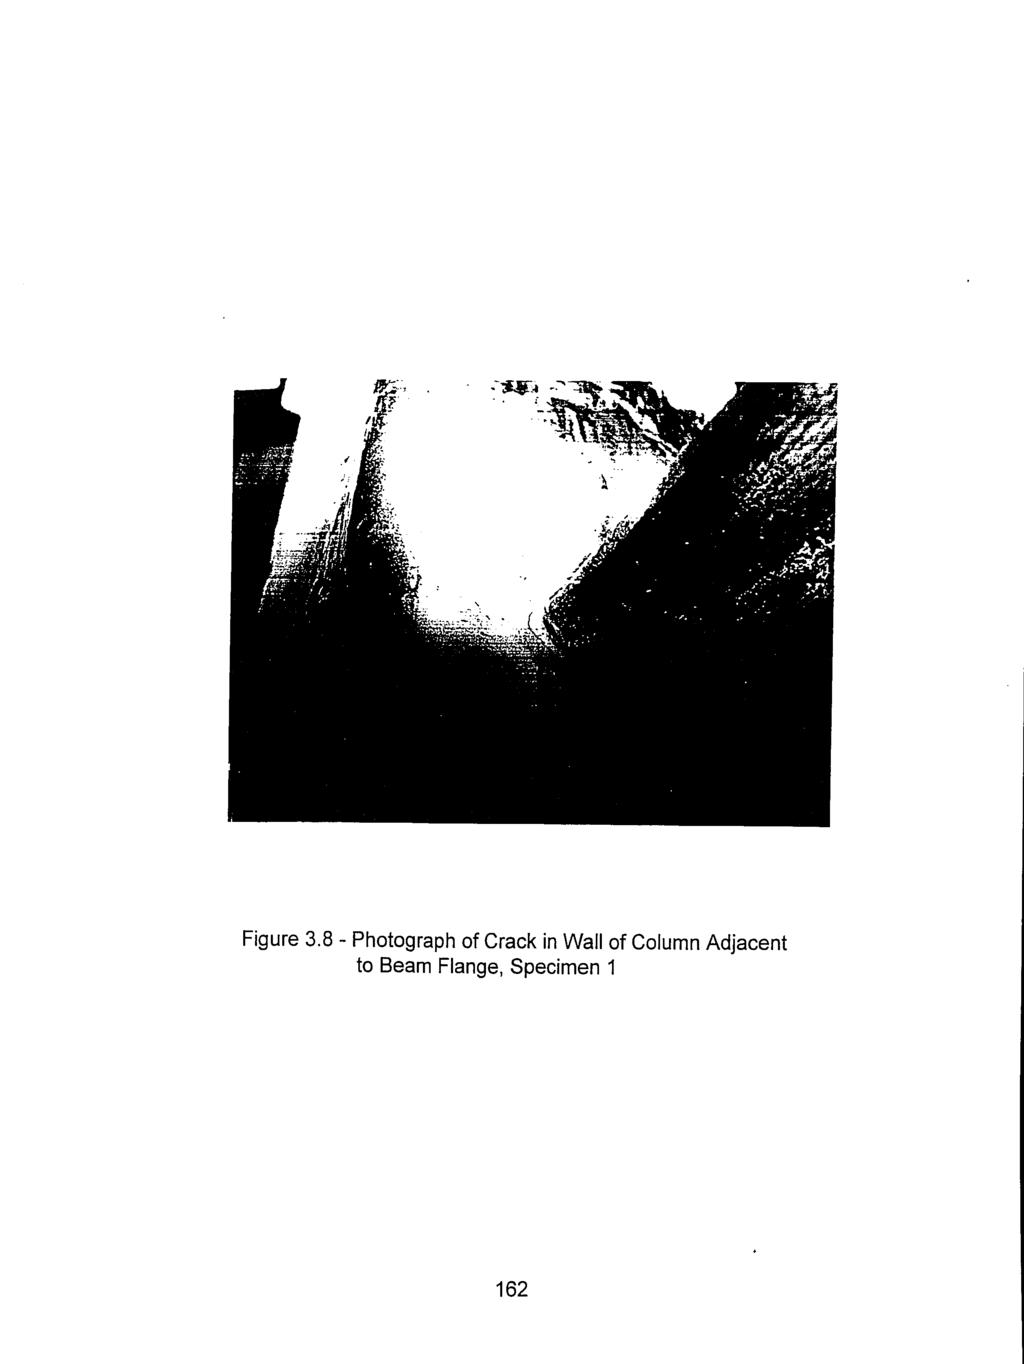
184