ICF/Building System FSTC Test Report
|
|
|
- Gwenda Nelson
- 5 years ago
- Views:
Transcription
1 REP ICF STC test.doc 1of C/o Michel Philippe IntegraSpec Insulating Concrete Forms (ICF) Building System By: Phil-Insul Corporation 735 Arlington Park Place, 11U Kingston, ON, K7M 8M8 TEL: (613) FAX: (613) ICF/Building System FSTC Test Report Dear Mr. Philippe, Following is the report on the two FSTC tests we performed on February 28, 2003, in Embrun, La Croissé St., units 3,4 and 5, for two different demising walls. Measurement Instruments Sound level measurements were carried out using fully calibrated acoustic test measurement equipment, consisting of the following: Larson Davis Type 1/2" Condenser Microphone Cartridge Larson Davis Type Microphone Preamplifier Brüel and Kjær Type 4220 Pistonphone Calibrator Larson Davis Type 2900B Real Time Analyzer & Noise Generating Source Quad amplifier and loudspeakers Associated Connecting Cables The sound level measuring system was calibrated prior to the first test. Following the last test, a calibration check was carried out to determine any deviation in the system from its first calibration. There was no deviation found in sound levels between the first calibration and the final calibration check. STATE OF THE ART ACOUSTIK INC Polytek Street Ottawa, ON K1J 9J3 E:sota@sota.ca T: F:
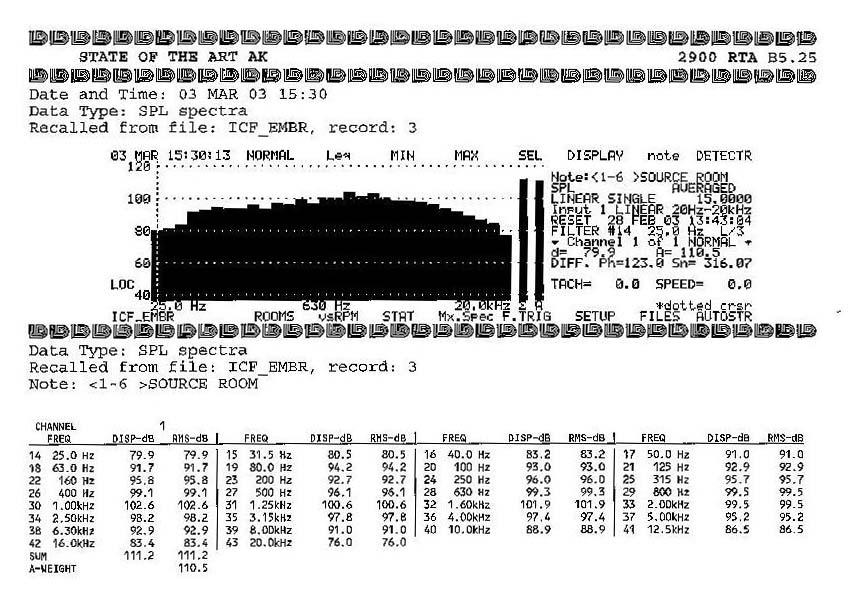
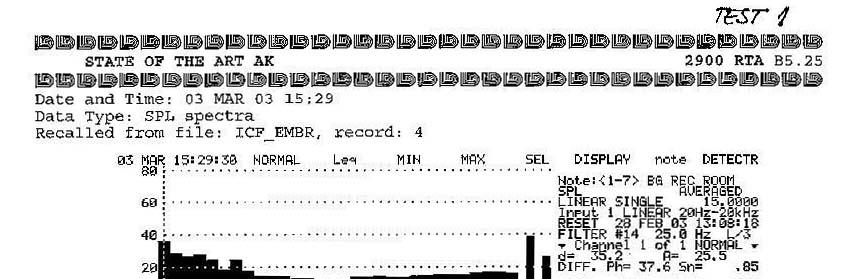
2 REP ICF STC test.doc 2of5 A Weighted Sound Levels When evaluating the general sound level in a space, the recorded levels in db are usually weighted with the A scale, a function which is approximately representative of the frequency response of the human ear, which is less sensitive to low frequency than to middle frequency sound. The sound level measure is expressed as dba. Measurement Procedure Test data for each test was collected and arrayed according to the ASTM (American Society for Testing and Materials) E standard test method for the measurement of airborne sound insulation in buildings. Measurements were made in 1/3-octave bands between 100 Hz and 4000 Hz. We were not provided with a copy of the floor plans, but we physically measured the relevant dimensions. The fist test was carried for the demising wall between units 4 and 5. We choose the following layout for the first test: We used as Source Room the first room to the left of the front entrance in unit 4. We used as Receive Room the first room to the right of the front entrance in unit 5 that has a common wall with the Source Room. Background noise level was charted before the testing began and was found to be 25.5 dba in the Receive Room (see record # 4). The second test was carried for the demising wall between units 3 and 4. We choose the following layout for the second test: We used as Source Room the main bedroom in unit 3. We used as Receive Room the main bedroom in unit 4 that has a common wall with the Source Room. Background noise level was charted before the testing began and was found to be 25.2 dba in the Receive Room (see record # 1). For each test, after measuring the background noise level in the Receive Room, the sound source was installed in the Receiving Room and the rate of sound decay was measured for calculation of reverberation time (amount of time required for sound to decay through 60 decibels). STATE OF THE ART ACOUSTIK INC Polytek Street Ottawa, ON K1J 9J3 E:sota@sota.ca T: F:
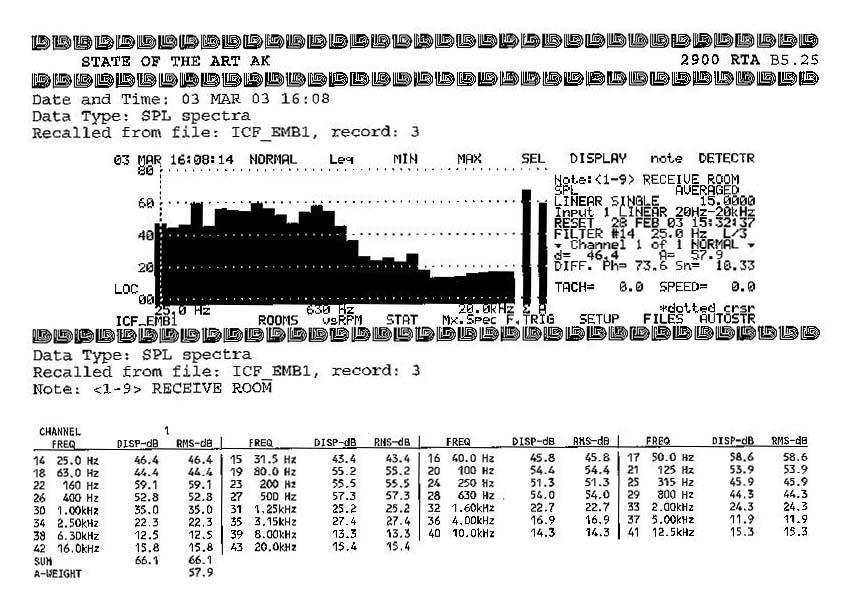
3 REP ICF STC test.doc 3of5 Then, the sound source was installed in the Source Room. The speakers were located away from the test partition, along the wall opposite to the one tested, near the corners, having random orientation to provide the most uniform sound field possible. Six microphone measurement positions were used for the Source Room levels for both tests and seven measurement positions for the first, respective nine for the second test, were used for the Receiving Room levels for, all with sound source on. Partition descriptions The tested partitions were the demising wall assemblies between the Source Room and the Receive Room for each of the tests. We performed FSTC tests of the wall assemblies that took into account the field conditions. The tests accounted for flanking noise and electrical outlet openings in the common wall. This is why the FSTC rating of a wall is usually few points under the STC rating of the same wall type. The wall construction, as described to us, was: Drywall Styrofoam Concrete Styrofoam Drywall. The only dimension we were provided is that for the thickness of the concrete, which was 4 for the 4 to 5 partition and 6 for the 3 to 4 partition. Test Conditions For all tests taken at this location, the following apply: -Microphone minimum of 1 m from any surface -Exterior windows closed -Ambient air temperature approximately 20 deg. Celsius -The rooms were unfinished, with drywall walls and ceilings and hardwood floors. STATE OF THE ART ACOUSTIK INC Polytek Street Ottawa, ON K1J 9J3 E:sota@sota.ca T: F:
4 REP ICF STC test.doc 4of5 Measurement Results In the accompanying data sheets and graphs we present the results of all our measurements. The 1/3 octave spectrum of sound transmission loss for the test location is shown on the graphs along with an equivalent STC curve for comparison purposes. The Sound Transmission Class (STC) is a numerical value used to rate acoustic barriers such as walls, partitions, doors, etc. for their effectiveness in blocking human speech sounds. STC ratings for partitions are measured under optimum laboratory conditions, which are rarely achieved in actual construction. Field STC (FSTC) ratings incorporate all elements located within a building and are more representative of actual sound isolation of a party wall for the occupants on both sides of the partition. The following table summarizes the parameters of the FSTC tests: Parameter Test 1 (units 4-5) Test 2 (units 3-4) Value Printout # Value Printout # Receive Room Background SPL (dba) (source OFF) Source Room SPL (dba) (source ON) Receive Room SPL (dba) (source ON) Noise Reduction (dba) Test Wall area (m 2 ) Receive Room volume (m 3 ) Receive Room RT FSTC Table 1 FSTC tests parameters For Test 1, our measurements determined Field STC-50 (printout #4) for the wall assembly between the units 4 and 5 and for Test 2 to be FSTC-51 (printout #3) for the wall assembly between the units 3 and 4. Since flanking sound transmission (around the partition) was not evaluated, the FSTC results above should be considered minimum values. NOTE: The ASTM standard E test method stipulates a minimum test room volume of 40 m 3 for measurements at 125 Hz to be valid. For Test 1, the Receive Room tested does not have the required minimum volume for valid measurements at 125 Hz. Its volume was 20.9 m 3. One way to increase the reliability of measurements at 125 Hz in small rooms is to take a very high number of microphone positions and average them to obtain less effect from the room modes. The E standard stipulates a minimum of six positions for tests to be valid. We used seven microphone positions to increase precision STATE OF THE ART ACOUSTIK INC Polytek Street Ottawa, ON K1J 9J3 E:sota@sota.ca T: F:
5 REP ICF STC test.doc 5of5 The measured FSTC results for Test 1 might vary slightly from the value we obtained if the tests were performed in rooms meeting the minimum volume requirement of 40 m3. There is no such issue for Test 2. Should you have any questions regarding this report, please do not hesitate to contact us. Sincerely, Tiberiu Spulber Consultant STATE OF THE ART ACOUSTIK INC Polytek Street Ottawa, ON K1J 9J3 E:sota@sota.ca T: F:
6

7
8
9
10
11
12