From feasibility to processing: a time-lapse seismic experiment on Al Khalij field offshore Qatar
|
|
|
- Lily Jacobs
- 5 years ago
- Views:
Transcription

.")
1 IPTC From feasibility to processing: a time-lapse seismic experiment on Al Khalij field offshore Qatar Fabrice Cantin, Bruno Pagliccia, Total E&P Qatar; Patrick Charron, Emmanuelle Brechet, Eddy Brozille Total S.A.; Michael Emang, Qatar Petroleum Copyright 2014, International Petroleum Technology Conference This paper was prepared for presentation at the International Petroleum Technology Conference held in Doha, Qatar, January This paper was selected for presentation by an IPTC Programme Committee following review of information contained in an abstract submitted by the author(s). Contents of the paper, as presented, have not been reviewed by the International Petroleum Technology Conference and are subject to correction by the author(s). The material, as presented, does not necessarily reflect any position of the International Petroleum Technology Conference, its officers, or members. Papers presented at IPTC are subject to publication review by Sponsor Society Committees of IPTC. Electronic reproduction, distribution, or storage of any part of this paper for commercial purposes without the written consent of the International Petroleum Technology Conference is prohibited. Permission to reproduce in print is restricted to an abstract of not more than 300 words; illustrations may not be copied. The abstract must contain conspicuous acknowledgment of where and by whom the paper was presented. Write Librarian, IPTC, P.O. Box , Richardson, TX , U.S.A., fax Abstract Time lapse seismic survey (aka 4D seismic) is a geophysical tool used by the industry to guide and maximize field development. It has been proven successful mainly in clastic deposits environment (Gulf of Mexico, Gulf of Guinea, North sea, ) but sparsely tested on carbonate fields because of seismic quality concerns. Total E&P Qatar engaged in 2012 a proof of concept 4D pilot study on its operated Al Kahlij field offshore Qatar- to demonstrate the value of information provided by a 4D seismic in a middle-east carbonate field under development. This study is made of: A feasibility study which aims to quantify the expected 4D effect by using a petro-elastic model and several chosen depletion scenarii. These input data are used to compute a synthetic time-lapse seismic dataset through a massive seismic modeling. A 4D pilot seismic survey shot in summer 2012 (monitor) which was designed to repeat the first seismic survey shot in 1998 (base). A dedicated seismic processing of both base and monitor in Total s 4D processing dedicated center followed by a specific inversion process (time warping) to extract the awaited 4D signal. The main objective on Al Khalij field is to validate that 4D seismic is able to calibrate the reservoir model and make it more predictive. If successful, the time-lapse seismic survey concept can be envisaged for other carbonates field in Qatar and in the Arabic Gulf area for field development optimization. Introduction The Al Khalij field is an oil producing field located in Block6, offshore Qatar (Figure 1). Total E&P Qatar has been developing the field with Qatar Petroleum since A 3D seismic survey was shot in 1998 and has been processed several times until 2009 to build the reservoir model used to monitor and further develop the field. The Al Khalij field is situated in transition zone, its water production rapidly increased to reach around 90% water-cut. Water arrival on the field is complex and implies several kinds of phenomena: short and long range injections, bottom and edge aquifer, large scale conductive events bringing water influx, etc. The field yields however large remaining reserves and it is planned to redevelop it. A better understanding of the water behavior is needed at a larger than well scale. Time-lapse seismic is a proven technique in clastic environments to assess fluid saturation changes both in time and space. Its efficiency in carbonate environments is still to be demonstrated in the Arabic gulf area. Figure 1: Al Khalij location map
2 2 IPTC Definitions Time-lapse (or 4D) seismic refers to repeated 3D seismic surveys in time. The principle is to repeat the initial survey (called base ) with a newer survey (called monitor ) acquired after several years of oil/gas production. By comparing the seismic signal characteristics (amplitude, phase, time shift) from the two surveys at the reservoir levels, the detected differences should represent a spacially comprehensive view of the field behavior between the 2 seismic acquisitions. Repeatability noise: noise measured on the difference cube between base and monitor in an area where no difference is expected. Because the seismic experiment is not perfectly repeatable, this noise is never equals to zero. 4D detectability: a concept issued from the radar technology and the interferometry. A signal can be detectable with a time-shift that could be smaller than the sampling rate. NRMS: (from 0 to 200%), defined by Kragh and Christie in NRMS represents the normalized RMS difference between base and monitor traces. If base and monitor are perfectly anti-correlated, NRMS=200%. If the amplitude of the base trace is exactly half the amplitude of the monitor trace, NRMS=66,7%. NRMS is routinely used to measure non repeatability but is sensitive to amplitude, phase and time-shift. It should decrease at each step of the processing sequence. Seismic traces of base and monitor are not two random signals. NRMS for two white Gaussian noises is = 141%. Seismic signals acquired in different location have a lot in common. NRMS above reservoirs will represents mainly the 4D noise in case of non compacting reservoirs. The best NRMS correspond in lower values in this case. Inside reservoirs, NRMS represents 4D signal and will show higher values. SWD stands for Shallow Water Demultiple: the algorithm identifies and extracts the seabed multiples from the seismic with the help of the bathymetric data and is able to reconstruct a seismic marker for the seabed from these identified multiples. SRME stands for Surface Related Multiple Elimination: it was developed for deep-offshore seismic where the seabed is visible and works by substracting a model of seabed multiple from the seismic data. In shallow water (less than 100 m), it is used in combination with the SWD which feeds SRME with the needed seabed seismic marker. HR Radon is broadly used in the industry to identify and remove multiple by its specific curvature at long offset. Feasibility study The purpose of this study was to model the 4D signal obtained for different production scenarios for the reservoir layers in Al-Khalij and analyse the sensitivity of 4D seismic attributes to changes in fluid pressure and saturations. The study is based on a massive seismic modeling approach (internal tool Cassis1D tm ) based on 1D well log data of the exploration well ALK1 for the static properties of the reservoir. For the dynamic changes of pressure and water saturation, the seismic modeling was performed according to production scenarios defined by reservoir engineers. As no full rock physics model was available at the date of the feasibility study, a simplified rock physics model has been built in order to perform the study. As no acoustic measurements on cores were available on Al-Khalij for pressure laws; velocity laws were taken from an internal carbonates database compiled from our carbonate fields around the globe. Therefore, uncertainties still remain on pressure laws.
 represented in the upper panel.")
3 IPTC Figure 2: Massive seismic 1D modeling, each modeled seismic trace from the lower panel corresponds to one scenario of pressure/water saturation change with a given reservoir layers distribution (from Layer 5 down to Layer 0) represented in the upper panel. The upper part of the figure 2 represent the different scenarii of the seismic modeling for saturation and pressure effects for all the reservoir layers (from Layer 0 to Layer 5). The four colurs represent pressure changes in the reservoir from +40 to -80 bars. For each pressure scenario (for each coloured zone), water saturation changes from 0 to 100% is simulated for a given reservoir level starting from the top of the reservoir (Layer 5) in a pyramidal way: Layer 5 isd divided in three saturation scenarii, for each scenario, the layer below (Layer 4 in that case) is also subdivided in three saturation scenarii, and so on for all the layers below. This pyramidal distribution lead to a set of synthetic traces shown in the lower part of figure 2, each trace represents one scenario of saturation/pressure within one possible reservoir layers distribution. From the massive seismic modelings performed (see Figure 2), the main conclusions of the study are the following: Pressure effects (depletion effect): The time shift effect is very significant and in some cases it reaches approximately 5 times (maximum: -1.8 ms for a maximum depletion of -80 bars) the limit of expected detectability (350 µs). At the top of the reservoir (Top Mishrif) the amplitude effects are below the expected limit of repeatability (15 %). 4D seismic is likely to bring quantitative information through the analysis of the 4D time shift. However, monitoring pressure effects are subject to uncertainties since the 4D effect due to pressure is modelled according to a common carbonate database. Saturation effects: The time shift effect predicted (~ 60 μs) is well below the limit of expected repeatability (350 μs) and will not be detectable. Amplitude effects are in general small (with the exception of Layer 3). Layer 3 is likely to be detected with a streamer on streamer survey (provided the expected repeatability noise of 15 % is reached). Layer 0 is at the limit of repeatability. This feasibility study, considering its internal limits (no core data, rock physics model incomplete, a priori repeatability noise level), was assessed a encouraging indicator to shoot a seismic pilot survey to confirm the existence of a 4D signal with the
4 4 IPTC real data. 4D pilot seismic acquisition In order to be in position to detect a viable 4D signal produced by the field depletion, it is mandatory to repeat the same seismic experiment as the one did with the base seismic. The monitor survey must be shot with the same seismic acquisition parameters. Of course, between 1998 and 2012, the technology changed with a quick pace and it is often not possible to use exactly the same seismic equipment. Nevertheless, we succeed to shoot the pilot monitor survey with similar parameters (Figure 3). The main difference is coming from the streamer group interval of 12.5 m instead of the 6.25 m used for the base survey as nowadays no streamers are available on the market with such a short group interval, but the same processing bin is obtained by decimating the base trace interval to match the monitor one. Figure 3: seismic acquisition spread of the monitor survey and comparison of acquisition parameters between the base and the monitor surveys.
.")

5 IPTC Because of operational constraints, it was decided to shoot the monitor pilot survey outside of the safety area of the existing platform while keeping the same acquisition direction as the base survey. Two swathes from 1998 base survey have been repeated for an acquisition surface of 52 sq.km compared to the 390 sq.km of the original seismic survey (see Figure 4). For such a small survey, the challenge was to find a vessel for an affordable cost and in August 2012 a vessel opportunity allowed us to shoot this pilot monitor survey. Unfortunately, the weather window was totally different from the one of the base survey as the 1998 seismic was shot in winter time, so the sea state and the currents were different between the base and the monitor leading to different level of ambient noise and different streamer feathering. To mitigate this issue, a dedicating 4D navigation team was placed onboard the vessel to optimize the repeatability of the source/streamer positioning to match the base survey. At the end of the acquisition, roughly 10% of the sail lines were not repeatable within acceptable limits but the 4D binning of the processing sequence was able to correct this effect. Figure 4: extent of the base survey (amplitude map in orange-grey scale) and of the monitor survey (amplitude map in red-blue scale). Arrows indicate acquisition directions and black dots the surface obstructions. 4D pilot seismic processing Seismic processing was performed by the dedicated 4D processing team operated by CGG and located inside the Total technical centre in Pau, south-west of France. From the beginning, the complexity of the project, specifically the demultiple process, was identified and it was decided to consider this project at an R&D level rather than a production job with a well-known processing sequence. A huge effort was performed by an extensive testing of each algorithm of the processing sequence (Figure 5). As for the seismic acquisition, seismic processing was designed to minimize all the artifacts not linked to any geological events: base and monitor survey were reprocessed at the same time, with the same contractor, with the same version of the processing sopftware and by the same geophysicist. Along the reprocessing work, it was found that the base survey has much more random noise than the monitor. This is due to the fact that the base was shot in winter time with a significant weather stand-by (around 25 %) whereas the monitor shot in summer time with a very low weather stand-by (around 2 %). Figure 5: processing sequence used for base and monitor surveys Multiple is the most challenging issue in this reprocessing, the processing centre spent months in testing all possible combinations of the three algorithms (SWD, SRME and Radon) and their impact on a 4D signal. Indeed, distinguishing a 4D

6 6 IPTC signal from seismic noise is not a trivial task. Figure 6 represents a stack section of the time-lapse seismic experiment at the SRME stage. On the left, the seismic sections of the base, the monitor and the difference before application of the SRME, on the right the same sections after SRME application. Figure 6: seismic sections of the base, the monitor and the difference before and after SRME application The difference between base and monitor could be considered as a rough 4D experiment and is used for QC only. More sophisticated tools are needed for a proper 4D signal extraction from these two datasets. Anyway, figure 6 shows that SRME generates more signal in the difference section than before its application. It could have two significations: SRME is very efficient on both base and monitor survey and a meaningfull 4D signal related to fluid movement or field depletion appears in the data. SRME removes the multiples model from the data by proceeding to an adaptative substraction. For a classical 3D processing, this adaptative substraction is very powerfull because for each shot point, the multiples model is adapted to match the energy of the shot so the model is very close to real multiples. For a 4D processing, as the base and the monitor surveys are not perfectely repeated, the SRME can introduce, by its adaptative substraction, a 4D effect which is not related to any fluid or pressure changes in the reservoir. In other words, the multiples model substracted from the seismic data could be different in the base and monitor datasets. On this dataset, SRME behavior is very suspicious as differences between base and monitor seismic sections are also visible outside of the reservoir levels, phenomena you do not expect in a time-lapse seismic experiment. It means that in this experiment, the multiples are not repeatable between the base and the monitor. This could come from the fact that the base survey was shot in December-January whereas the monitor was shot in August with different sea-state. It could be also due to seismic sources which are not perfectely similar (in terms of type of airgun and source configuration) for the two seismic vessels used 15 years apart. Another way to look at the data is to monitor the progress of the seismic processing through assessment of seismic repeatability with maps of the difference between the base and monitor. Figure 7 is a concertina of maps along the seismic sequence. The attribute used is the Normalised RMS amplitude (NRMS) computed in a window above the reservoir levels (called the overburden), area where no 4D signal is expected. Red color indicates strong NRMS amplitudes in the difference between base and monitor, blue color indicates weak NRMS values in the difference between base and monitor. From a general point of view, the NRMS value decreases while the processing sequence is moving towards the final stage. At the last step, a FK filter applied to denoise the final cubes, the NRMS values of the overburden is close to zero showing the processing repeatability for the base and monitor is of enough quality to be in position to see a 4D signal in the reservoir levels.

7 IPTC Figure 7: monitoring of the NRMS value of the overburden along the processing sequence computed on the difference cube (monitor base) Looking at these maps in details shows that the SRME application boosts the NRMS amplitude of the difference between base and monitor where a diminution is expected. From the above considerations, it has been decided to not apply the 3D SRME in the processing sequence. Conclusion 4D Al Khalij pilot survey is one of the first time-lapse seismic experiments in offshore Qatar. It was also one of the only surveys shot in carbonate environments within Total group worldwide. This lack of previous experience was a strong limitation for the feasibility study and some arbitrairy hypothesis (like awaited repeatability noise level) were introduced. However, the feasibility study results were good enough to take the decision to acquire a 4D pilot survey to validate the concept in real life. The seismic acquisition ran smoothly and occurred in a favourable weather window with a very low ambient noise. It is an important aspect to pinpoint because the first reaction of people when a time-lapse seismic survey is envisaged is that you should whatever possible to repeat the base survey, even shooting in the same weather windows. Unfortunately the ambient noise is not repeatable and shooting in summer for the monitor (base was shot in winter) was proven effective as the processing centre had to deal with ambient noise on the base only. Seismic processing highlights the following points: Multiples elimination without affecting a possible 4D signal was the main challenge. From more than 10 4D processing projects performed within Total in the past 5 years, AL Khalij was by far the most difficult one. A lot of time and efforts were spent to monitor the effectiveness of the demultiple algorithm and the processing in general At the end of the processing sequence, the repeatability noise (around 10 %) is of good level and in the low range of all the previous 4D shot within Total group. Geophysicists are now confident enough in the seismic dataset of the base and monitor to start the 4D signal extraction if any. At the time of this paper, the 4D signal extraction and interpretation are on-going and, if successful, will help Al Khalij field redevelopement for the next decade.
8 Paper No From feasibility to processing: a time-lapse seismic experiment on Al Khalij field offshore Qatar Michael Emang, Bruno Pagliccia*, Fabrice Cantin, Patrick Charron, Emmanuelle Brechet, Benoit Blanco, Eddy Brosille, Michel Radigon
 3D seismic survey shot in winter 1998 4D seismic pilot survey shot in summer")
9 Slide 2 Al Khalij Field Location Geography Water depth about 60 m Burial about 1100 m Discovered in May 1991, first oil in March 1997 Limestone reservoir of Cenomanian age (mid-cretaceous) 3D seismic survey shot in winter D seismic pilot survey shot in summer 2012


10 Slide 3 TIME-LAPSE EXPERIMENT 4D PILOT on Al Khalij : baseline shot in 1998 monitor shot in 2012
) 500 Ambient noise level 0 0 5000 10000 Base amplitude")
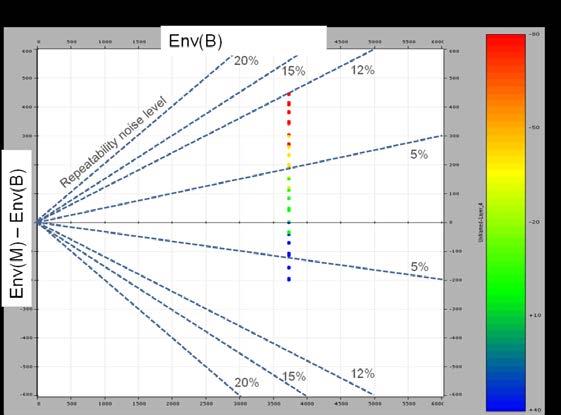
11 Slide 4 TIME-LAPSE EXPERIMENT - NOISE CONCEPT 1000 Ambient noise : weather, Rep. Noise : acq. parameters, 4D amplitude (Env(Monitor Base)) 500 Ambient noise level Base amplitude (Env(Base))
12 Slide 5 PRESENTATION OUTLINE FEASIBILITY STUDY Seismic modeling Time & Amplitude difference SEISMIC ACQUISITION Survey Definition Acquisition Parameters SEISMIC PROCESSING Processing sequence Demultiple strategy Quality Control D amplitude (Env(Monitor Base)) 500 Ambient noise level Base amplitude (Env(Base))
13 Slide 6 ΔP ΔSw 4D FEASIBILITY STUDY : and scenarii massive 1D modeling


14 Slide 7 4D FEASIBILITY STUDY : RESULTS


15 Slide 8 4D PILOT : SEISMIC ACQUISITION DATA EXTENT Baseline 1998 Monitor 2012


16 Slide 9 4D PILOT : SEISMIC ACQUISITION main parameters

17 Slide 10 4D PILOT : SEISMIC ACQUISITION RAW SHOTS

18 Slide 11 4D PILOT : SEISMIC PROCESSING - SEQUENCE


19 Slide 12 4D PILOT : SEISMIC PROCESSING IMPACT OF DEMULTIPLE

20 Slide 13 4D PILOT : SEISMIC PROCESSING NOISE MONITORING

21 Slide 14 CONCLUSION Feasibility said : up to 1.7 ms time-shift and amplitude difference below 12 % of repeatability noise 4D pilot data said : up to 1 ms of time-shift, repeatibility noise of 12 % but amplitude difference above that threshold Feasibility study is a study with limited data input A real field test is a must (4D pilot) Acquisition design to maximise as much as possible the experiment repeatability Seismic processing must be identical between base & monitor to reduce noise

22 Slide 15 Acknowledgements / Thank You / Questions The authors gratefully acknowledge Qatar Petroleum and Total E&P Qatar for permission to publish this paper