PUBLIC/PRIVATE PARTNERSHIPS
|
|
|
- Oliver Miller
- 5 years ago
- Views:
Transcription
1 UW MEDICINE TITLE OR EVENT SCHOOL OF MEDICINE TRADELINE CONFERENCE PUBLIC/PRIVATE PARTNERSHIPS THE PUBLIC SECTOR PERSPECTIVE & COMPARISON CASE STUDY JILL MORELLI, FAIA, DIRECTOR OF FACILITIES, UW SCHOOL OF MEDICINE COLLEGE & UNIVERSITY SCIENCE FACILITIES: TRADELINE CONFERENCE OCTOBER 27 & 28, 2013
2 TYPICAL TYPES OF P3 S Infrastructure Housing Public facilities.but, building types using P3s are expanding greatly.


3 TYPES OF P3 S
4 PUBLIC/PRIVATE PARTNERSHIPS Contractual relationship between a public sector entity and a private sector company to accomplish a mutually beneficial goal.
5 VARIABLES FOR P3 S Finance Management of process Design Construction Operation Maintenance
6 Characteristics of a Successful Partnership Knowledgeable partners Honest in their communication Creative, flexible problem solvers Ability to execute the deal Public sector partner must be willing to step outside conventional processes Private sector partner must be tolerant of approval process of public partner
7 It can be difficult working with Public Sector Taxpayer dollars & the public trust Consensus based decision making which makes for longer timelines Layers of approvals Must have clear benefit Your mission is not necessarily ours There may be legal disincentives

8 SOM SLU ORGANIZATIONAL STRUCTURE Land owner A/E & consultants Contractors & Subs Project Mgmt.. 501(c)3 Financing Bond Holders SoM University of Washington

9 MolES Organizational Structure A/E & consultants Contractors & Subs CoE Capital Projects Office University of Washington Internal UW Parties
10 P3 PERCEPTIONS Timeliness perception: projects take less time Quality & Control perception: projects are lower quality perception: Institution has many decision making entities Cost perception: projects cost less but, what is true?
11 SCHOOL OF MEDICINE TRADELINE CONFERENCE COMPARISON CASE STUDY SLU 3.1 & MOLECULAR ENGINEERING & SCIENCE BUILDING

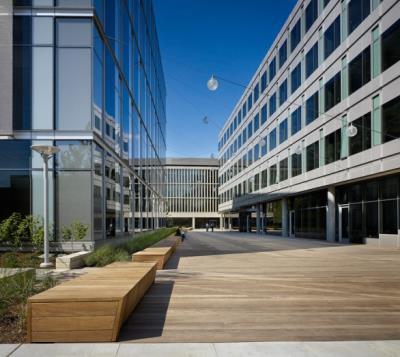
12 UW SOM SOUTH LAKE UNION Ben Benschnieder/Perkins+Will

13 MOLECULAR E & S Ben Benschnieder/ZGF
14 DIFFICULTIES IN COMPARING No two buildings are the same ever Different site conditions Different size/type/vision Some big items you keep in because of the difficulty in identifying the cost Some small items you delete because it is easy to do so. Always open to criticism Goal: Tried to be fair
15 SIMILARITIES SLU 3.1 (P3) & MolES (GC/CM) Scientists like working in both buildings Wet bench science Urban sites LEED Gold Layout of typical floor Seattle permitting/review processes Tax deferral on equipment & research Second phase not constructed but needing support work in first phase Contingencies, furniture, equipment in soft costs are considered all spent


16 FLOOR PLATES
17 DIFFERENCES SLU 3.1 (P3) 216,019 GSF (7 flrs+) 128,891 ASF BSL-3/SA, 2 interstitial spaces, 4 bay loading dock; pad built for $109.6M TPC (adj.) $ 92.0M TCC (adj.) MolES (GC/CM) 90,374 GSF (4 flrs) 47,060 ASF minimal vibration and electromagnetic interference; radiant floors; bldg. expandable for Phase 2. $72.6M TPC (adj.) $58.6M TCC (adj.)

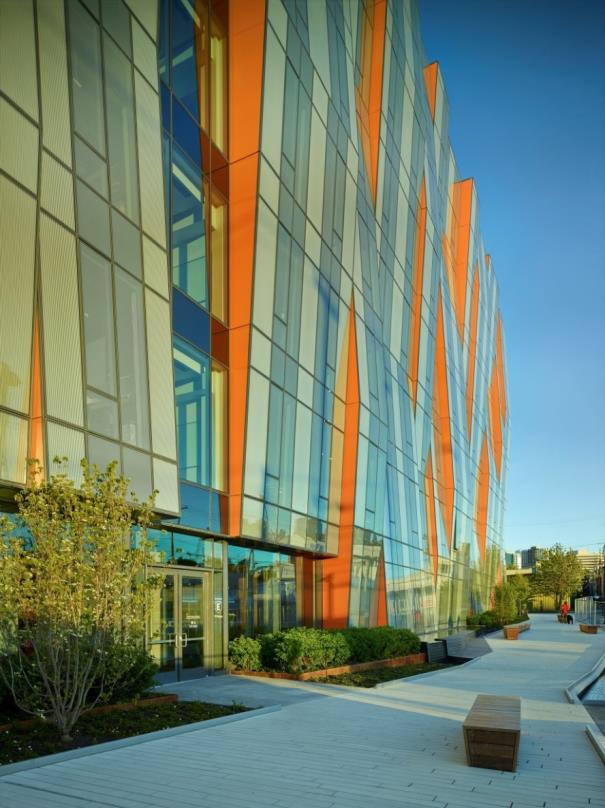
18 SLU 3.1 MolES Ben Benschnieder/Perkins+Will Ben Benschnieder/ZGF
19 SLU 3.1 (P3) Modified IPD Ground breaking: July 2011 Opened: April 2013 Construction time: 21 months Impacts: fire June 16, All space built out; all space fully occupied 8 weeks after opening. TIMELINESS MolES (GC/CM) GC/CM, subs as advisors Ground breaking: October 2009 Opened: September 2012 Construction time: 35 months Impacts: fit out designed during construction; not fully occupied at time of opening. SLU 3.1 was delivered in 14 months less time.
20 ARCHITECTURAL QUALITY SLU 3.1 UW EHS & UW IT are responsible for SLU 3.1 Did not have to abide by UW standards for construction SoM has long term investment strategy MolES UW EHS & UW IT are responsible for MolES Had to abide by UW standards for construction 100 year building There is no observable difference in [architectural] quality between the two buildings. Ron Maus, consultant, interview 26 September 2013
21 SLU 3.1 Built to mixed standards Major pieces of equipment are to UW standards Mechanical distribution systems standards are relaxed MEP QUALITY MolES Built to UW standards Major pieces of equipment are to UW standards Mechanical distribution systems to UW standards SLU was built to a long term investment strategy consistent with the longevity of scientific infrastructure and planning. John Slattery, SoM Vice Dean for Research
22 SLU 3.1 Clear vision by SoM of desired outcome Clear concept of quality desired Short decision making chain with few peripheral players CONTROL MolES Clear vision by CoE of desired outcome Clear concept of quality to be received Complex decision making chain, many peripheral players SoM was consistent in the vision for the project from the beginning and made decisions quickly. Lessons Learned Session, Full set of team members, September 2013
23 COSTS Cost data from Original Budgets: SLU s soft costs were 38% less than MolES SLU s costs for consultants were 12% less SLU s costs for construction were 6% less SLU s contingencies were 80% less ~ $426 TCC/GSF: SLU 3.1 (26% cheaper) ~ $574 TCC/GSF: MolES Using TPC/GSF, SLU cost less by 14%, including financing, to 29% less without inclusion of financing.
24 THE TRADELINE THREE Timeliness Quality & Control Cost perception: P3 s take less time reality: True; SLU 3.1 took less time by 13% - 33%. perception: P3 s are of a lower quality reality: False, a different approach to maintenance drives different decisions.. perception: Institution has many decision making entities reality: True; SLU had discrete group of SoM decision-makers. perception: P3 s cost less reality: True, by 14% to 29%
25 YMWV Questions? Credit where credit is due: Capital Projects Office, University of Washington. Eric C. Smith, Steve Tatge National Development Council, John Finke and Misty Baskett; Sellen Construction Inc., Todd Lee, Tracy Winter AEI, Engineers, Inc, Dean Erickson MRW Advisory, LLC, Ron Maus.