Crop Outlook: Now What?!
|
|
|
- Clyde Robertson
- 5 years ago
- Views:
Transcription
1 Crop Outlook: Now What?! Frayne Olson, PhD Crop Economist/Marketing Specialist NDSU Extension Service ND Agricultural Experiment Station Dept. of Agribusiness & Applied Economics STUDENT FOCUSED LAND GRANT RESEARCH UNIVERSITY
2 All Wheat Supply & Demand Table U.S. All Wheat 2012/ /2014 (est.) 2014/2015 (Feb) Planted A Mill. A Mill. A Mill. A. Harvested A Mill. A Mill. A Mill. A. Yield/Harvest A bu bu bu. Begin Stocks 743 Mill. Bu. 718 Mill. Bu. 590 Mill. Bu. Production 2,252 Mill. Bu. 2,135 Mill. Bu. 2,026 Mill. Bu. Imports 123 Mill. Bu. 169 Mill. Bu. 160 Mill. Bu. Total Supply 3,118 Mill. Bu. 3,021 Mill. Bu. 2,776 Mill. Bu. Food 945 Mill. Bu. 952 Mill. Bu. 960 Mill. Bu. Seed 73 Mill. Bu. 77 Mill. Bu. 74 Mill. Bu. Feed & Residual 370 Mill. Bu. 226 Mill. Bu. 150 Mill. Bu. Exports 1,012 Mill. Bu. 1,176 Mill. Bu. 900 Mill. Bu. Total Use 2,400 Mill. Bu. 2,431 Mill. Bu. 2,084 Mill. Bu. Ending Stocks 718 Mill. Bu. 590 Mill. Bu. 692 Mill. Bu. USDA WASDE February 10, 2015
3 All Wheat Supply & Demand Table U.S. All Wheat 2012/ /2014 (est.) 2014/2015 (Feb) Planted A Mill. A Mill. A Mill. A. Harvested A Mill. A Mill. A Mill. A. Yield/Harvest A bu bu bu. Begin Stocks 743 Mill. Bu. 718 Mill. Bu. 590 Mill. Bu. Production 2,252 Mill. Bu. 2,135 Mill. Bu. 2,026 Mill. Bu. Imports 123 Mill. Bu. 169 Mill. Bu. 160 Mill. Bu. Total Supply 3,118 Mill. Bu. 3,021 Mill. Bu. 2,776 Mill. Bu. Food 945 Mill. Bu. 952 Mill. Bu. 960 Mill. Bu. Seed 73 Mill. Bu. 77 Mill. Bu. 74 Mill. Bu. Total Production is down 5.1% from last year. Feed & Residual 370 Mill. Bu. 226 Mill. Bu. 150 Mill. Bu. Exports 1,012 Mill. Bu. 1,176 Mill. Bu. 900 Mill. Bu. Total Use 2,400 Mill. Bu. 2,431 Mill. Bu. 2,084 Mill. Bu. Ending Stocks 718 Mill. Bu. 590 Mill. Bu. 692 Mill. Bu. USDA WASDE February 10, 2015
4 2000/ / / / / / / / / / / / / / /15 1,400 1,200 1, U.S. All Wheat Disappearance (Million Bushels) Food Exports Feed & Residual Seed USDA WASDE Feb. 10, 2015 & USDA Wheat Yearbook Table 5 Million Bushels
5 All Wheat Supply & Demand Table U.S. All Wheat 2012/ /2014 (est.) 2014/2015 (Feb) Food use changes with U.S. population growth and flour extraction rates. Planted A Mill. A Mill. A Mill. A. Harvested A Mill. A Mill. A Mill. A. Yield/Harvest A bu bu bu. Begin Stocks 743 Mill. Bu. 718 Mill. Bu. 590 Mill. Bu. Production 2,252 Mill. Bu. 2,135 Mill. Bu. 2,026 Mill. Bu. Imports 123 Mill. Bu. 169 Mill. Bu. 160 Mill. Bu. Total Supply 3,118 Mill. Bu. 3,021 Mill. Bu. 2,776 Mill. Bu. Food 945 Mill. Bu. 952 Mill. Bu. 960 Mill. Bu. Seed 73 Mill. Bu. 77 Mill. Bu. 74 Mill. Bu. Feed & Residual 370 Mill. Bu. 226 Mill. Bu. 150 Mill. Bu. Exports 1,012 Mill. Bu. 1,176 Mill. Bu. 900 Mill. Bu. Total Use 2,400 Mill. Bu. 2,431 Mill. Bu. 2,084 Mill. Bu. Ending Stocks 718 Mill. Bu. 590 Mill. Bu. 692 Mill. Bu. USDA WASDE February 10, 2015
6 All Wheat Supply & Demand Table U.S. All Wheat 2012/ /2014 (est.) 2014/2015 (Feb) Planted A Mill. A Mill. A Mill. A. Harvested A Mill. A Mill. A Mill. A. Yield/Harvest A bu bu bu. Exports are critical for strong U.S. wheat prices. Begin Stocks 743 Mill. Bu. 718 Mill. Bu. 590 Mill. Bu. Production 2,252 Mill. Bu. 2,135 Mill. Bu. 2,026 Mill. Bu. 23.5% decrease from last year. Imports 123 Mill. Bu. 169 Mill. Bu. 160 Mill. Bu. Total Supply 3,118 Mill. Bu. 3,021 Mill. Bu. 2,776 Mill. Bu. Food 945 Mill. Bu. 952 Mill. Bu. 960 Mill. Bu. Seed 73 Mill. Bu. 77 Mill. Bu. 74 Mill. Bu. Feed & Residual 370 Mill. Bu. 226 Mill. Bu. 150 Mill. Bu. Exports 1,012 Mill. Bu. 1,176 Mill. Bu. 900 Mill. Bu. Total Use 2,400 Mill. Bu. 2,431 Mill. Bu. 2,084 Mill. Bu. Ending Stocks 718 Mill. Bu. 590 Mill. Bu. 692 Mill. Bu. USDA WASDE February 10, 2015
7 All Wheat Supply & Demand Table U.S. All Wheat 2012/ /2014 (est.) 2014/2015 (Feb) Planted A Mill. A Mill. A Mill. A. Harvested A Mill. A Mill. A Mill. A. Forecast for lower Exports is due to strong world wheat production and price competition from corn for feeding. Yield/Harvest A bu bu bu. Begin Stocks 743 Mill. Bu. 718 Mill. Bu. 590 Mill. Bu. Production 2,252 Mill. Bu. 2,135 Mill. Bu. 2,026 Mill. Bu. Imports 123 Mill. Bu. 169 Mill. Bu. 160 Mill. Bu. Total Supply 3,118 Mill. Bu. 3,021 Mill. Bu. 2,776 Mill. Bu. Food 945 Mill. Bu. 952 Mill. Bu. 960 Mill. Bu. Seed 73 Mill. Bu. 77 Mill. Bu. 74 Mill. Bu. Feed & Residual 370 Mill. Bu. 226 Mill. Bu. 150 Mill. Bu. Exports 1,012 Mill. Bu. 1,176 Mill. Bu. 900 Mill. Bu. Total Use 2,400 Mill. Bu. 2,431 Mill. Bu. 2,084 Mill. Bu. Ending Stocks 718 Mill. Bu. 590 Mill. Bu. 692 Mill. Bu. USDA WASDE February 10, 2015

8 U.S. Dollar Index DTN Prophet X am

9 U.S. Dollar Index DTN Prophet X am
10 Production by Major Export Competitor to / / / / / Million Metric Tons USDA WASDE February 10, 2015 & PSD Custom Query
11 Million Metric Tons Exports by Major Export Competitor to / / / / /2015 USDA WASDE February 10, 2015 & PSD Custom Query
12 Top 5+ All Wheat Export Destinations 1,000 Metric Tons Will these sales be repeated in 2014/15? (1,000 Metric Ton) Japan Nigeria Mexico Philippines Egypt China Brazil U.S. Wheat Associates Commercial Sales Reports (07/10/14)
13 All Wheat Supply & Demand Table U.S. All Wheat 2012/ /2014 (est.) 2014/2015 (Feb) Planted A Mill. A Mill. A Mill. A. Harvested A Mill. A Mill. A Mill. A. Yield/Harvest A bu bu bu. Begin Stocks 743 Mill. Bu. 718 Mill. Bu. 590 Mill. Bu. Production 2,252 Mill. Bu. 2,135 Mill. Bu. 2,026 Mill. Bu. Imports 123 Mill. Bu. 169 Mill. Bu. 160 Mill. Bu. Despite poor HRWW yields, Total Supply 3,118 Mill. Bu. 3,021 Mill. Bu. 2,776 Mill. Bu. U.S. wheat supplies are Food adequate and 945 Ending Mill. Bu. Stocks 952 Mill. Bu. 960 Mill. Bu. Seed are increasing. 73 Mill. Bu. 77 Mill. Bu. 74 Mill. Bu. Feed & Residual 370 Mill. Bu. 226 Mill. Bu. 150 Mill. Bu. Exports 1,012 Mill. Bu. 1,176 Mill. Bu. 900 Mill. Bu. Total Use 2,400 Mill. Bu. 2,431 Mill. Bu. 2,084 Mill. Bu. Ending Stocks 718 Mill. Bu. 590 Mill. Bu. 692 Mill. Bu. USDA WASDE February 10, 2015
14 U.S. All Wheat Total Prod. & Use (Billion Bushels) Stocks to Use Total Production Total Use Billion Bushels 1994/ / / / / / / / / / / / / / / / / / / / /15 Stocks to Use Ratio February 10, 2015 WASDE Report & Wheat Yearbook Table 6
15 World Wheat Prod, Use & Stocks/Use (Million Metric Ton) Stocks to Use Total Production Total Dom. Use Million Metric Tons 1980/ / / / / / / / / / / / / / / / / /15 Stocks to Use Ratio USDA WASDE February 10, 2015 & PSD Custom Query
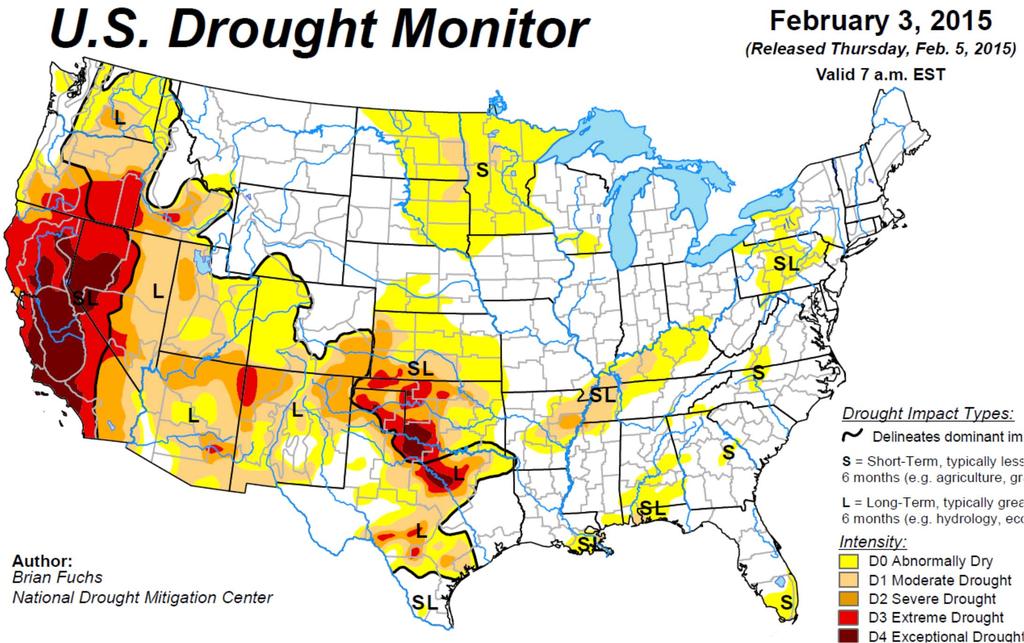
16 Wheat Market Comments Australian wheat production was below average, but not bad. Wheat quality is still unknown. U.S. HRWW region is in Moderate to Severe drought conditions, but recent snow storms have helped mitigate problems. Russian winter wheat condition is poor and the Russian economy is struggling. Russian export taxes have been implemented, but recent export pace has been aggressive.
17
18 Winter Wheat Seedings Estimates (Million Acres) Crop 2014 USDA Average Low High 2015 Est. Hard Red Winter Soft Red Winter White Winter Total Winter
19 U.S. & Canadian All Wheat Prod. 3,000 (Million Bushels) 2,500 Million Bushels 2,000 1,500 1, U.S Production Canadian Production USDA Wheat Yearbook Table 5 and Statistics Canada Dec. Production Report
20 U.S. & Canadian Spring Wheat Prod (Million Bushels) 1000 Million Bushels U.S Production Canadian Production USDA Wheat Yearbook Table 8 and Statistics Canada Dec. Production Report
21 U.S. and Canadian Durum Production 300 (Million Bushels) 250 Million Bushels U.S Production Canadian Production USDA Wheat Yearbook Table 11 and Statistics Canada Dec. Production Report
22 Cash Durum Prices by Grade Cents per Bushel 04/07/11 05/12/11 06/16/11 07/21/11 08/25/11 09/29/11 11/03/11 12/08/11 01/12/12 02/16/12 03/22/12 04/26/12 05/31/12 07/05/12 08/09/12 09/13/12 10/18/12 11/22/12 12/27/12 01/31/13 03/07/13 04/11/13 05/16/13 6/20/2013 7/25/2013 8/29/ /3/ /7/ /12/2013 1/16/2014 2/20/2014 3/27/2014 5/1/2014 6/5/2014 7/10/2014 8/14/2014 9/18/ /23/ /27/2014 1/1/2015 2/5/2015 Milling Durum Hard Amber Durum Amber Durum Ordinary Durum
23 1999/ / / / / / / / / / / / / / / Premium or Discount 2014/ Daily Protein Spreads for Hard Red Spring Wheat - Portland OR June 1, February 10, % Discount (13% - 14%) 15% Premium (15% - 14%)
24 Discount for 13% Protein Hard Red Spring Wheat - Portland OR June 1, 2008 to February 10, June July August September October November December January February March April May / / / / / / / Day in Marketing Year beginning on June 1
25 Premium for 15% Protein Hard Red Spring Wheat - Portland OR June 1, 2008 to February 10, / / / / / / / June July August September October November December January February March April May Day in Marketing Year beginning on June 1
26 Data from USDA- AMS Graph prepared by Frayne Olson - NDSU Daily Protein Spreads for Hard Red Spring Wheat - Minneapolis, MN June 1, 2002 February 9, Premium or Discount / / / / / / / / / / / / / Date 13% Discount (13% - 14%) 15% Premium (15% - 14%)
27 Questions?