Crop Outlook: Now What?!
|
|
|
- Aron Conley
- 5 years ago
- Views:
Transcription
1 Crop Outlook: Now What?! Frayne Olson, PhD Crop Economist/Marketing Specialist NDSU Extension Service ND Agricultural Experiment Station Dept. of Agribusiness & Applied Economics STUDENT FOCUSED LAND GRANT RESEARCH UNIVERSITY
2 All Wheat Supply & Demand Table U.S. All Wheat 2012/ /2014 (est.) 2014/2015 (Feb) Planted A Mill. A Mill. A Mill. A. Harvested A Mill. A Mill. A Mill. A. Yield/Harvest A bu bu bu. Begin Stocks 743 Mill. Bu. 718 Mill. Bu. 590 Mill. Bu. Production 2,252 Mill. Bu. 2,135 Mill. Bu. 2,026 Mill. Bu. Imports 123 Mill. Bu. 169 Mill. Bu. 160 Mill. Bu. Total Supply 3,118 Mill. Bu. 3,021 Mill. Bu. 2,776 Mill. Bu. Food 945 Mill. Bu. 952 Mill. Bu. 960 Mill. Bu. Seed 73 Mill. Bu. 77 Mill. Bu. 74 Mill. Bu. Feed & Residual 370 Mill. Bu. 226 Mill. Bu. 150 Mill. Bu. Exports 1,012 Mill. Bu. 1,176 Mill. Bu. 900 Mill. Bu. Total Use 2,400 Mill. Bu. 2,431 Mill. Bu. 2,084 Mill. Bu. Ending Stocks 718 Mill. Bu. 590 Mill. Bu. 692 Mill. Bu. USDA WASDE February 10, 2015
3 All Wheat Supply & Demand Table U.S. All Wheat 2012/ /2014 (est.) 2014/2015 (Feb) Planted A Mill. A Mill. A Mill. A. Harvested A Mill. A Mill. A Mill. A. Yield/Harvest A bu bu bu. Begin Stocks 743 Mill. Bu. 718 Mill. Bu. 590 Mill. Bu. Production 2,252 Mill. Bu. 2,135 Mill. Bu. 2,026 Mill. Bu. Imports 123 Mill. Bu. 169 Mill. Bu. 160 Mill. Bu. Total Supply 3,118 Mill. Bu. 3,021 Mill. Bu. 2,776 Mill. Bu. Food 945 Mill. Bu. 952 Mill. Bu. 960 Mill. Bu. Seed 73 Mill. Bu. 77 Mill. Bu. 74 Mill. Bu. Total Production is down 5.1% from last year. Feed & Residual 370 Mill. Bu. 226 Mill. Bu. 150 Mill. Bu. Exports 1,012 Mill. Bu. 1,176 Mill. Bu. 900 Mill. Bu. Total Use 2,400 Mill. Bu. 2,431 Mill. Bu. 2,084 Mill. Bu. Ending Stocks 718 Mill. Bu. 590 Mill. Bu. 692 Mill. Bu. USDA WASDE February 10, 2015
4 2000/ / / / / / / / / / / / / / /15 Million Bushels 1,400 U.S. All Wheat Disappearance (Million Bushels) 1,200 1, Food Exports Feed & Residual Seed 0 USDA WASDE Feb. 10, 2015 & USDA Wheat Yearbook -Table 5
5 All Wheat Supply & Demand Table U.S. All Wheat 2012/ /2014 (est.) 2014/2015 (Feb) Food use changes with U.S. population growth and flour extraction rates. Planted A Mill. A Mill. A Mill. A. Harvested A Mill. A Mill. A Mill. A. Yield/Harvest A bu bu bu. Begin Stocks 743 Mill. Bu. 718 Mill. Bu. 590 Mill. Bu. Production 2,252 Mill. Bu. 2,135 Mill. Bu. 2,026 Mill. Bu. Imports 123 Mill. Bu. 169 Mill. Bu. 160 Mill. Bu. Total Supply 3,118 Mill. Bu. 3,021 Mill. Bu. 2,776 Mill. Bu. Food 945 Mill. Bu. 952 Mill. Bu. 960 Mill. Bu. Seed 73 Mill. Bu. 77 Mill. Bu. 74 Mill. Bu. Feed & Residual 370 Mill. Bu. 226 Mill. Bu. 150 Mill. Bu. Exports 1,012 Mill. Bu. 1,176 Mill. Bu. 900 Mill. Bu. Total Use 2,400 Mill. Bu. 2,431 Mill. Bu. 2,084 Mill. Bu. Ending Stocks 718 Mill. Bu. 590 Mill. Bu. 692 Mill. Bu. USDA WASDE February 10, 2015
6 All Wheat Supply & Demand Table U.S. All Wheat 2012/ /2014 (est.) 2014/2015 (Feb) Planted A Mill. A Mill. A Mill. A. Harvested A Mill. A Mill. A Mill. A. Yield/Harvest A bu bu bu. Exports are critical for strong U.S. wheat prices. Begin Stocks 743 Mill. Bu. 718 Mill. Bu. 590 Mill. Bu. Production 2,252 Mill. Bu. 2,135 Mill. Bu. 2,026 Mill. Bu. 23.5% decrease from last year. Imports 123 Mill. Bu. 169 Mill. Bu. 160 Mill. Bu. Total Supply 3,118 Mill. Bu. 3,021 Mill. Bu. 2,776 Mill. Bu. Food 945 Mill. Bu. 952 Mill. Bu. 960 Mill. Bu. Seed 73 Mill. Bu. 77 Mill. Bu. 74 Mill. Bu. Feed & Residual 370 Mill. Bu. 226 Mill. Bu. 150 Mill. Bu. Exports 1,012 Mill. Bu. 1,176 Mill. Bu. 900 Mill. Bu. Total Use 2,400 Mill. Bu. 2,431 Mill. Bu. 2,084 Mill. Bu. Ending Stocks 718 Mill. Bu. 590 Mill. Bu. 692 Mill. Bu. USDA WASDE February 10, 2015
7 All Wheat Supply & Demand Table U.S. All Wheat 2012/ /2014 (est.) 2014/2015 (Feb) Planted A Mill. A Mill. A Mill. A. Harvested A Mill. A Mill. A Mill. A. Forecast for lower Exports is due to strong world wheat production and price competition from corn for feeding. Yield/Harvest A bu bu bu. Begin Stocks 743 Mill. Bu. 718 Mill. Bu. 590 Mill. Bu. Production 2,252 Mill. Bu. 2,135 Mill. Bu. 2,026 Mill. Bu. Imports 123 Mill. Bu. 169 Mill. Bu. 160 Mill. Bu. Total Supply 3,118 Mill. Bu. 3,021 Mill. Bu. 2,776 Mill. Bu. Food 945 Mill. Bu. 952 Mill. Bu. 960 Mill. Bu. Seed 73 Mill. Bu. 77 Mill. Bu. 74 Mill. Bu. Feed & Residual 370 Mill. Bu. 226 Mill. Bu. 150 Mill. Bu. Exports 1,012 Mill. Bu. 1,176 Mill. Bu. 900 Mill. Bu. Total Use 2,400 Mill. Bu. 2,431 Mill. Bu. 2,084 Mill. Bu. Ending Stocks 718 Mill. Bu. 590 Mill. Bu. 692 Mill. Bu. USDA WASDE February 10, 2015

8 U.S. Dollar Index DTN Prophet X am
9 U.S. Dollar Index DTN Prophet X am
10 Million Metric Tons Production by Major Export Competitor to / / / / / USDA WASDE- February 10, 2015 & PSD Custom Query
11 Million Metric Tons Exports by Major Export Competitor to / / / / /2015 USDA WASDE- February 10, 2015 & PSD Custom Query
12 1,000 Metric Tons Top 5+ All Wheat Export Destinations Will these sales be repeated in 2014/15? (1,000 Metric Ton) Japan Nigeria Mexico Philippines Egypt China Brazil U.S. Wheat Associates Commercial Sales Reports (07/10/14)
13 All Wheat Supply & Demand Table U.S. All Wheat 2012/ /2014 (est.) 2014/2015 (Feb) Planted A Mill. A Mill. A Mill. A. Harvested A Mill. A Mill. A Mill. A. Yield/Harvest A bu bu bu. Begin Stocks 743 Mill. Bu. 718 Mill. Bu. 590 Mill. Bu. Production 2,252 Mill. Bu. 2,135 Mill. Bu. 2,026 Mill. Bu. Imports 123 Mill. Bu. 169 Mill. Bu. 160 Mill. Bu. Despite poor HRWW yields, U.S. wheat supplies are adequate and Ending Stocks are increasing. Total Supply 3,118 Mill. Bu. 3,021 Mill. Bu. 2,776 Mill. Bu. Food 945 Mill. Bu. 952 Mill. Bu. 960 Mill. Bu. Seed 73 Mill. Bu. 77 Mill. Bu. 74 Mill. Bu. Feed & Residual 370 Mill. Bu. 226 Mill. Bu. 150 Mill. Bu. Exports 1,012 Mill. Bu. 1,176 Mill. Bu. 900 Mill. Bu. Total Use 2,400 Mill. Bu. 2,431 Mill. Bu. 2,084 Mill. Bu. Ending Stocks 718 Mill. Bu. 590 Mill. Bu. 692 Mill. Bu. USDA WASDE February 10, 2015
14 1994/ / / / / / / / / / / / / / / / / / / / /15 Billion Bushels Stocks-to-Use Ratio U.S. All Wheat Total Prod. & Use (Billion Bushels) Stocks-to-Use Total Production Total Use February 10, 2015 WASDE Report & Wheat Yearbook Table 6
15 1980/ / / / / / / / / / / / / / / / / /15 Million Metric Tons Stocks-to-Use Ratio World Wheat Prod, Use & Stocks/Use (Million Metric Ton) Stocks-to-Use Total Production Total Dom. Use USDA WASDE- February 10, 2015 & PSD Custom Query
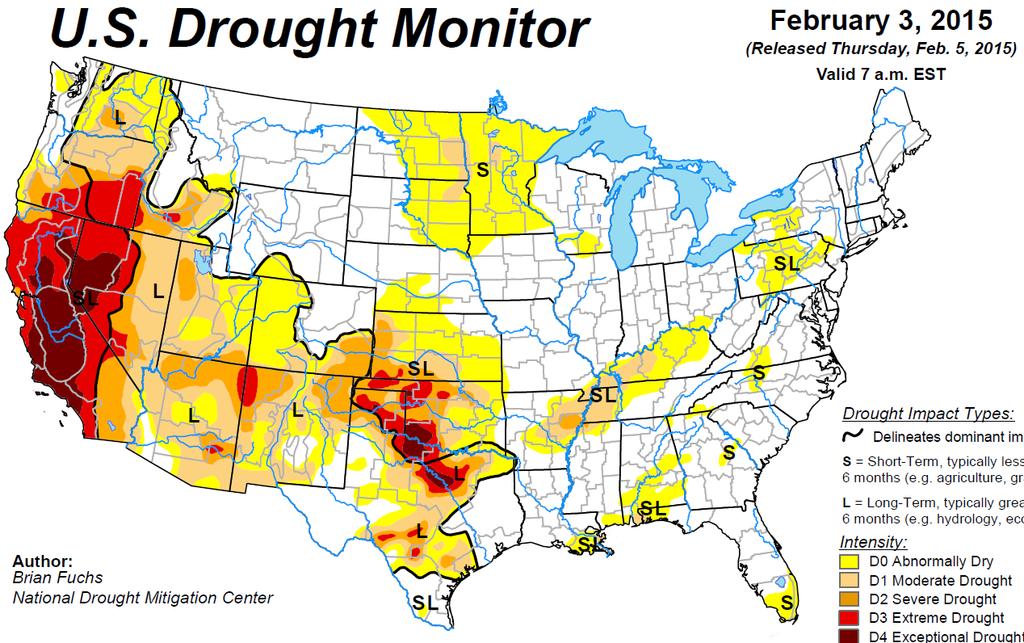
16 Wheat Market Comments Australian wheat production was below average, but not bad. Wheat quality is still unknown. U.S. HRWW region is in Moderate to Severe drought conditions, but recent snow storms have helped mitigate problems. Russian winter wheat condition is poor and the Russian economy is struggling. Russian export taxes have been implemented, but recent export pace has been aggressive.
17
18 Winter Wheat Seedings Estimates (Million Acres) Crop 2014 USDA Average Low High 2015 Est. Hard Red Winter Soft Red Winter White Winter Total Winter
19 Million Bushels U.S. & Canadian All Wheat Prod. (Million Bushels) 3,000 2,500 2,000 1,500 1, U.S Production Canadian Production USDA Wheat Yearbook -Table 5 and Statistics Canada Dec. Production Report
20 Million Bushels U.S. & Canadian Spring Wheat Prod. (Million Bushels) U.S Production Canadian Production USDA Wheat Yearbook -Table 8 and Statistics Canada Dec. Production Report
21 Million Bushels U.S. and Canadian Durum Production (Million Bushels) U.S Production Canadian Production USDA Wheat Yearbook -Table 11 and Statistics Canada Dec. Production Report
22 04/07/11 05/12/11 06/16/11 07/21/11 08/25/11 09/29/11 11/03/11 12/08/11 01/12/12 02/16/12 03/22/12 04/26/12 05/31/12 07/05/12 08/09/12 09/13/12 10/18/12 11/22/12 12/27/12 01/31/13 03/07/13 04/11/13 05/16/13 6/20/2013 7/25/2013 8/29/ /3/ /7/ /12/2013 1/16/2014 2/20/2014 3/27/2014 5/1/2014 6/5/2014 7/10/2014 8/14/2014 9/18/ /23/ /27/2014 1/1/2015 2/5/2015 Cash Durum Prices by Grade Milling Durum Hard Amber Durum Amber Durum Ordinary Durum
23 Premium or Discount 1999/ / / / / / / / / / / / / / / / Daily Protein Spreads for Hard Red Spring Wheat - Portland OR June 1, February 10, % Discount (13% - 14%) 15% Premium (15% - 14%)
24 June July August September October November December January February March April May Discount for 13% Protein Hard Red Spring Wheat - Portland OR June 1, 2008 to February 10, / / / / / / / Day in Marketing Year beginning on June 1
25 June July Premium for 15% Protein Hard Red Spring Wheat - Portland OR June 1, 2008 to February 10, 2015 August September October November December January February March April May / / / / / / / Day in Marketing Year beginning on June 1
26 Premium or Discount 2002/ / / / / / / / / / / / /15 Data from USDA- AMS Graph prepared by Frayne Olson - NDSU Daily Protein Spreads for Hard Red Spring Wheat - Minneapolis, MN June 1, 2002 February 9, Date 13% Discount (13% - 14%) 15% Premium (15% - 14%)
27 Questions?
28 Corn Supply & Demand Table U.S. Corn 2012/ /2014 (est.) 2014/2015 (Feb) Planted A Mill. A Mill. A Mill. A. Harvested A Mill. A Mill. A Mill. A. Yield/Harvest A bu bu bu. Begin Stocks 989 Mill. Bu. 821 Mill. Bu. 1,232 Mill. Bu. Production 10,755 Mill. Bu. 13,829 Mill. Bu. 14,216 Mill. Bu. Imports 160 Mill. Bu. 36 Mill. Bu. 25 Mill. Bu. Total Supply 11,904 Mill. Bu. 14,686 Mill. Bu. 15,472 Mill. Bu. Feed & Residual 4,315 Mill. Bu. 5,036 Mill. Bu. 5,250 Mill. Bu. Food, Seed, Ind. 6,038 Mill. Bu. 6,501 Mill. Bu. 6,645 Mill. Bu. Ethanol 4,641 Mill. Bu. 5,134 Mill. Bu. 5,250 Mill. Bu. Exports 730 Mill. Bu. 1,917 Mill. Bu. 1,750 Mill. Bu. Total Use 11,083 Mill. Bu. 13,454 Mill. Bu. 13,645 Mill. Bu. Ending Stocks 821 Mill. Bu. 1,232 Mill. Bu. 1,827 Mill. Bu. USDA WASDE February 10, 2015
29 Corn Supply & Demand Table U.S. Corn 2012/ /2014 (est.) 2014/2015 (Feb) Planted A Mill. A Mill. A Mill. A. Harvested A Mill. A Mill. A Mill. A. Yield/Harvest A bu bu bu. Begin Stocks 989 Mill. Bu. 821 Mill. Bu. 1,232 Mill. Bu. Production 10,755 Mill. Bu. 13,829 Mill. Bu. 14,216 Mill. Bu. Imports 160 Mill. Bu. 36 Mill. Bu. 25 Mill. Bu. Total Supply 11,904 Mill. Bu. 14,686 Mill. Bu. 15,472 Mill. Bu. Feed & Residual 4,315 Mill. Bu. 5,036 Mill. Bu. 5,250 Mill. Bu. 14,216 Mill. Bu. is the second record corn crop in a row! (2.8% increase) Food, Seed, Ind. 6,038 Mill. Bu. 6,501 Mill. Bu. 6,645 Mill. Bu. Ethanol 4,641 Mill. Bu. 5,134 Mill. Bu. 5,250 Mill. Bu. Exports 730 Mill. Bu. 1,917 Mill. Bu. 1,750 Mill. Bu. Total Use 11,083 Mill. Bu. 13,454 Mill. Bu. 13,645 Mill. Bu. Ending Stocks 821 Mill. Bu. 1,232 Mill. Bu. 1,827 Mill. Bu. USDA WASDE February 10, 2015
30 Billion Bushels 7.00 Corn - Total Use (Billion Bushels) Feed & Residual Ethanol Non-Ethanol Food, Seed & Industrial Exports 0.00 Feb. 10, 2015 WASDE Report & USDA Feed Grains Data Base Table 4
31 Corn Supply & Demand Table Feed & Residual is forecast to increase 4.2%. U.S. Corn 2012/ /2014 (est.) 2014/2015 (Feb) Planted A Mill. A Mill. A Mill. A. Harvested A Mill. A Mill. A Mill. A. How fast will livestock numbers increase and what impact will slaughter weights have? Yield/Harvest A bu bu bu. Begin Stocks 989 Mill. Bu. 821 Mill. Bu. 1,232 Mill. Bu. Production 10,755 Mill. Bu. 13,829 Mill. Bu. 14,216 Mill. Bu. Imports 160 Mill. Bu. 36 Mill. Bu. 25 Mill. Bu. Total Supply 11,904 Mill. Bu. 14,686 Mill. Bu. 15,472 Mill. Bu. Feed & Residual 4,315 Mill. Bu. 5,036 Mill. Bu. 5,250 Mill. Bu. Food, Seed, Ind. 6,038 Mill. Bu. 6,501 Mill. Bu. 6,645 Mill. Bu. Ethanol 4,641 Mill. Bu. 5,134 Mill. Bu. 5,250 Mill. Bu. Exports 730 Mill. Bu. 1,917 Mill. Bu. 1,750 Mill. Bu. Total Use 11,083 Mill. Bu. 13,454 Mill. Bu. 13,645 Mill. Bu. Ending Stocks 821 Mill. Bu. 1,232 Mill. Bu. 1,827 Mill. Bu. USDA WASDE February 10, 2015
32 Corn Supply & Demand Table Both Ethanol and other Industrial use are forecast to increase slightly. U.S. Corn 2012/ /2014 (est.) 2014/2015 (Feb) Planted A Mill. A Mill. A Mill. A. Harvested A Mill. A Mill. A Mill. A. Yield/Harvest A bu bu bu. Expansion is possible if exports expand. Begin Stocks 989 Mill. Bu. 821 Mill. Bu. 1,232 Mill. Bu. Production 10,755 Mill. Bu. 13,829 Mill. Bu. 14,216 Mill. Bu. Imports 160 Mill. Bu. 36 Mill. Bu. 25 Mill. Bu. Total Supply 11,904 Mill. Bu. 14,686 Mill. Bu. 15,472 Mill. Bu. Feed & Residual 4,315 Mill. Bu. 5,036 Mill. Bu. 5,250 Mill. Bu. Food, Seed, Ind. 6,038 Mill. Bu. 6,501 Mill. Bu. 6,645 Mill. Bu. Ethanol 4,641 Mill. Bu. 5,134 Mill. Bu. 5,250 Mill. Bu. Exports 730 Mill. Bu. 1,917 Mill. Bu. 1,750 Mill. Bu. Total Use 11,083 Mill. Bu. 13,454 Mill. Bu. 13,645 Mill. Bu. Ending Stocks 821 Mill. Bu. 1,232 Mill. Bu. 1,827 Mill. Bu. USDA WASDE February 10, 2015
33 Jun 04, 2010 Sep 04, 2010 Dec 04, 2010 Mar 04, 2011 Jun 04, 2011 Sep 04, 2011 Dec 04, 2011 Mar 04, 2012 Jun 04, 2012 Sep 04, 2012 Dec 04, 2012 Mar 04, 2013 Jun 04, 2013 Sep 04, 2013 Dec 04, 2013 Mar 04, 2014 Jun 04, 2014 Sep 04, 2014 Dec 04, 2014 Mar 04, ,000 Barrels/Day 1,000 Weekly Ethanol Production (06/04/ /30/2015) Weekly Production USDA Est. Corn Use EIA September Short Term Energy Outlook & EIA Custom Query
34 Corn Supply & Demand Table U.S. Corn 2012/ /2014 (est.) 2014/2015 (Feb) Planted A Mill. A Mill. A Mill. A. Harvested A Mill. A Mill. A Mill. A. Exports are forecast to decrease 8.7% due to strong world competition and large feed wheat supplies. Yield/Harvest A bu bu bu. Begin Stocks 989 Mill. Bu. 821 Mill. Bu. 1,232 Mill. Bu. Production 10,755 Mill. Bu. 13,829 Mill. Bu. 14,216 Mill. Bu. Imports 160 Mill. Bu. 36 Mill. Bu. 25 Mill. Bu. Total Supply 11,904 Mill. Bu. 14,686 Mill. Bu. 15,472 Mill. Bu. Feed & Residual 4,315 Mill. Bu. 5,036 Mill. Bu. 5,250 Mill. Bu. Food, Seed, Ind. 6,038 Mill. Bu. 6,501 Mill. Bu. 6,645 Mill. Bu. Ethanol 4,641 Mill. Bu. 5,134 Mill. Bu. 5,250 Mill. Bu. Exports 730 Mill. Bu. 1,917 Mill. Bu. 1,750 Mill. Bu. Total Use 11,083 Mill. Bu. 13,454 Mill. Bu. 13,645 Mill. Bu. Ending Stocks 821 Mill. Bu. 1,232 Mill. Bu. 1,827 Mill. Bu. USDA WASDE February 10, 2015
35 Corn Supply & Demand Table U.S. Corn 2012/ /2014 (est.) 2014/2015 (Feb) Planted A Mill. A Mill. A Mill. A. Harvested A Mill. A Mill. A Mill. A. Yield/Harvest A bu bu bu. Export pace should be watched closely for price direction! Begin Stocks 989 Mill. Bu. 821 Mill. Bu. 1,232 Mill. Bu. Production 10,755 Mill. Bu. 13,829 Mill. Bu. 14,216 Mill. Bu. Imports 160 Mill. Bu. 36 Mill. Bu. 25 Mill. Bu. Total Supply 11,904 Mill. Bu. 14,686 Mill. Bu. 15,472 Mill. Bu. Feed & Residual 4,315 Mill. Bu. 5,036 Mill. Bu. 5,250 Mill. Bu. Food, Seed, Ind. 6,038 Mill. Bu. 6,501 Mill. Bu. 6,645 Mill. Bu. Ethanol 4,641 Mill. Bu. 5,134 Mill. Bu. 5,250 Mill. Bu. Exports 730 Mill. Bu. 1,917 Mill. Bu. 1,750 Mill. Bu. Total Use 11,083 Mill. Bu. 13,454 Mill. Bu. 13,645 Mill. Bu. Ending Stocks 821 Mill. Bu. 1,232 Mill. Bu. 1,827 Mill. Bu. USDA WASDE February 10, 2015
36 1,000 Metric Ton 18,000 Top Six U.S. Corn Export Destinations 16,000 14,000 12,000 10,000 8,000 6,000 4,000 2, Japan Mexico South Korea Colombia China Taiwan USDA Quick Stats Custom Query
37 U.S. Dollar Index DTN Prophet X pm

38 U.S. Dollar Index DTN Prophet X pm
39 Corn Supply & Demand Table U.S. Corn 2012/ /2014 (est.) 2014/2015 (Feb) Planted A Mill. A Mill. A Mill. A. Harvested A Mill. A Mill. A Mill. A. Yield/Harvest A bu bu bu. Begin Stocks 989 Mill. Bu. 821 Mill. Bu. 1,232 Mill. Bu. Corn Ending Stocks are forecast to be almost as large as the TOTAL U.S. WHEAT PRODUCTION (2,026 Mill. Bu.) Production 10,755 Mill. Bu. 13,829 Mill. Bu. 14,216 Mill. Bu. Imports 160 Mill. Bu. 36 Mill. Bu. 25 Mill. Bu. Total Supply 11,904 Mill. Bu. 14,686 Mill. Bu. 15,472 Mill. Bu. Feed & Residual 4,315 Mill. Bu. 5,036 Mill. Bu. 5,250 Mill. Bu. Food, Seed, Ind. 6,038 Mill. Bu. 6,501 Mill. Bu. 6,645 Mill. Bu. Ethanol 4,641 Mill. Bu. 5,134 Mill. Bu. 5,250 Mill. Bu. Exports 730 Mill. Bu. 1,917 Mill. Bu. 1,750 Mill. Bu. Total Use 11,083 Mill. Bu. 13,454 Mill. Bu. 13,645 Mill. Bu. Ending Stocks 821 Mill. Bu. 1,232 Mill. Bu. 1,827 Mill. Bu. USDA WASDE February 10, 2015
40 Corn Supply & Demand Table U.S. Corn 2012/ /2014 (est.) 2014/2015 (Feb) Planted A Mill. A Mill. A Mill. A. Harvested A Mill. A Mill. A Mill. A. Yield/Harvest A bu bu bu. Begin Stocks 989 Mill. Bu. 821 Mill. Bu. 1,232 Mill. Bu. Stocks to Use Ratio is forecast to increase from 9.1% to 13.4%, almost double 2012/13. Production 10,755 Mill. Bu. 13,829 Mill. Bu. 14,216 Mill. Bu. Imports 160 Mill. Bu. 36 Mill. Bu. 25 Mill. Bu. Total Supply 11,904 Mill. Bu. 14,686 Mill. Bu. 15,472 Mill. Bu. Feed & Residual 4,315 Mill. Bu. 5,036 Mill. Bu. 5,250 Mill. Bu. Food, Seed, Ind. 6,038 Mill. Bu. 6,501 Mill. Bu. 6,645 Mill. Bu. Ethanol 4,641 Mill. Bu. 5,134 Mill. Bu. 5,250 Mill. Bu. Exports 730 Mill. Bu. 1,917 Mill. Bu. 1,750 Mill. Bu. Total Use 11,083 Mill. Bu. 13,454 Mill. Bu. 13,645 Mill. Bu. Ending Stocks 821 Mill. Bu. 1,232 Mill. Bu. 1,827 Mill. Bu. USDA WASDE February 10, 2015
41 1994/ / / / / / / / / / / / / / / / / / / / /15 Billion Bushels Stocks-to-Use Ratio Corn Total U.S. Production & Use (Billion Bushels) Stocks-to-Use Total Production Total Use February 10, 2015 WASDE Report & USDA Feed Grains Data Base Table 4
42 Million Metric Tons Stocks-to-Use Ratio 1, World Corn Prod, Use & Stocks/Use (Million Metric Ton) Stocks-to-Use Total Production Total Use February 10, 2015 USDA -WASDE & PSD Custom Query
43 Million Metric Tons Stocks-to-Use Ratio 1, World Corn Prod, Use & Stocks/Use (Million Metric Ton) Stocks-to-Use Total Production Total Use Who holds corn ending stocks? China 41.8% U.S. 24.5% Brazil 9.3% February 10, 2015 USDA -WASDE & PSD Custom Query
44 Soybean Supply & Demand Table U.S. Soybean 2012/ /2014 (est.) 2014/2015 (Feb) Planted A Mill. A Mill. A Mill. A. Harvested A Mill. A Mill. A Mill. A. Yield/Harvest A bu bu bu. Begin Stocks 169 Mill. Bu. 141 Mill. Bu. 92 Mill. Bu. Production 3,042 Mill. Bu. 3,358 Mill. Bu. 3,969 Mill. Bu. Imports 41 Mill. Bu. 72 Mill. Bu. 25 Mill. Bu. Total Supply 3,252 Mill. Bu. 3,570 Mill. Bu. 4,086 Mill. Bu. Crushings 1,689 Mill. Bu. 1,734 Mill. Bu. 1,795 Mill. Bu. Exports 1,317 Mill. Bu. 1,647 Mill. Bu. 1,790 Mill. Bu. Seed 89 Mill. Bu. 97 Mill. Bu. 92 Mill. Bu. Residual 16 Mill. Bu. 0 Mill. Bu. 24 Mill. Bu. Total Use 3,111 Mill. Bu. 3,478 Mill. Bu. 3,701 Mill. Bu. Ending Stocks 141 Mill. Bu. 92 Mill. Bu. 385 Mill. Bu. USDA WASDE February 10, 2015
45 Soybean Supply & Demand Table U.S. Soybean 2012/ /2014 (est.) 2014/2015 (Feb) Planted A Mill. A Mill. A Mill. A. Harvested A Mill. A Mill. A Mill. A. Yield/Harvest A bu bu bu. Begin Stocks 169 Mill. Bu. 141 Mill. Bu. 92 Mill. Bu. Production 3,042 Mill. Bu. 3,358 Mill. Bu. 3,969 Mill. Bu. Imports 41 Mill. Bu. 72 Mill. Bu. 25 Mill. Bu. Total Supply 3,252 Mill. Bu. 3,570 Mill. Bu. 4,086 Mill. Bu is new record for Total Production. Previous record was 3,359 Mill. Bu. in (18% increase) Crushings 1,689 Mill. Bu. 1,734 Mill. Bu. 1,795 Mill. Bu. Exports 1,317 Mill. Bu. 1,647 Mill. Bu. 1,790 Mill. Bu. Seed 89 Mill. Bu. 98 Mill. Bu. 92 Mill. Bu. Residual 16 Mill. Bu. 0 Mill. Bu. 24 Mill. Bu. Total Use 3,111 Mill. Bu. 3,478 Mill. Bu. 3,701 Mill. Bu. Ending Stocks 141 Mill. Bu. 92 Mill. Bu. 385 Mill. Bu. USDA WASDE February 10, 2015
46 2000/ / / / / / / / / / / / / / /15 Million Bushels 2,000 1,800 1,600 1,400 1,200 1, U.S. Soybean Use Crushings Exports Seed & Residual February 10, 2015 WASDE Report & Oil Yearbook Table 3
47 Soybean Supply & Demand Table U.S. Soybean 2012/ /2014 (est.) 2014/2015 (Feb) Use for Crushing is forecast to increase 3.5%. Planted A Mill. A Mill. A Mill. A. Harvested A Mill. A Mill. A Mill. A. Record crush was 1,808 Mill. Bu. in 2006 Yield/Harvest A bu bu bu. Begin Stocks 169 Mill. Bu. 141 Mill. Bu. 92 Mill. Bu. Production 3,042 Mill. Bu. 3,358 Mill. Bu. 3,969 Mill. Bu. Imports 41 Mill. Bu. 72 Mill. Bu. 25 Mill. Bu. Total Supply 3,252 Mill. Bu. 3,570 Mill. Bu. 4,086 Mill. Bu. Crushings 1,689 Mill. Bu. 1,734 Mill. Bu. 1,795 Mill. Bu. Exports 1,317 Mill. Bu. 1,647 Mill. Bu. 1,790 Mill. Bu. Seed 89 Mill. Bu. 98 Mill. Bu. 92 Mill. Bu. Residual 16 Mill. Bu. 0 Mill. Bu. 24 Mill. Bu. Total Use 3,111 Mill. Bu. 3,478 Mill. Bu. 3,701 Mill. Bu. Ending Stocks 141 Mill. Bu. 92 Mill. Bu. 385 Mill. Bu. USDA WASDE February 10, 2015
48 Soybean Supply & Demand Table Soybean Oil use is forecast to be unchanged U.S. Soybean 2012/ /2014 (est.) 2014/2015 (Feb) Planted A Mill. A Mill. A Mill. A. Harvested A Mill. A Mill. A Mill. A. Soybean Meal use is forecast to be up 5.5% Yield/Harvest A bu bu bu. Begin Stocks 169 Mill. Bu. 141 Mill. Bu. 92 Mill. Bu. Production 3,042 Mill. Bu. 3,358 Mill. Bu. 3,969 Mill. Bu. Imports 41 Mill. Bu. 72 Mill. Bu. 25 Mill. Bu. Total Supply 3,252 Mill. Bu. 3,570 Mill. Bu. 4,086 Mill. Bu. Crushings 1,689 Mill. Bu. 1,734 Mill. Bu. 1,795 Mill. Bu. Exports 1,317 Mill. Bu. 1,647 Mill. Bu. 1,790 Mill. Bu. Seed 89 Mill. Bu. 98 Mill. Bu. 92 Mill. Bu. Residual 16 Mill. Bu. 0 Mill. Bu. 24 Mill. Bu. Total Use 3,111 Mill. Bu. 3,478 Mill. Bu. 3,701 Mill. Bu. Ending Stocks 141 Mill. Bu. 92 Mill. Bu. 385 Mill. Bu. USDA WASDE February 10, 2015
49 Soybean Supply & Demand Table U.S. Soybean 2012/ /2014 (est.) 2014/2015 (Feb) Exports are forecast to increase 8.7%. Planted A Mill. A Mill. A Mill. A. Harvested A Mill. A Mill. A Mill. A. Yield/Harvest A bu bu bu. 1,790 Mill. Bu. would be a new record. Begin Stocks 169 Mill. Bu. 141 Mill. Bu. 92 Mill. Bu. Production 3,042 Mill. Bu. 3,358 Mill. Bu. 3,969 Mill. Bu. Imports 41 Mill. Bu. 72 Mill. Bu. 25 Mill. Bu. Total Supply 3,252 Mill. Bu. 3,570 Mill. Bu. 4,086 Mill. Bu. Crushings 1,689 Mill. Bu. 1,734 Mill. Bu. 1,795 Mill. Bu. Exports 1,317 Mill. Bu. 1,647 Mill. Bu. 1,790 Mill. Bu. Seed 89 Mill. Bu. 98 Mill. Bu. 92 Mill. Bu. Residual 16 Mill. Bu. 0 Mill. Bu. 24 Mill. Bu. Total Use 3,111 Mill. Bu. 3,478 Mill. Bu. 3,701 Mill. Bu. Ending Stocks 141 Mill. Bu. 92 Mill. Bu. 385 Mill. Bu. USDA WASDE February 10, 2015
50 Soybean Supply & Demand Table U.S. Soybean 2012/ /2014 (est.) 2014/2015 (Feb) Planted A Mill. A Mill. A Mill. A. Harvested A Mill. A Mill. A Mill. A. Watch seasonal export patterns! Yield/Harvest A bu bu bu. Begin Stocks 169 Mill. Bu. 141 Mill. Bu. 92 Mill. Bu. Production 3,042 Mill. Bu. 3,358 Mill. Bu. 3,969 Mill. Bu. This could influence local basis values. Imports 41 Mill. Bu. 72 Mill. Bu. 25 Mill. Bu. Total Supply 3,252 Mill. Bu. 3,570 Mill. Bu. 4,086 Mill. Bu. Crushings 1,689 Mill. Bu. 1,734 Mill. Bu. 1,795 Mill. Bu. Exports 1,317 Mill. Bu. 1,647 Mill. Bu. 1,790 Mill. Bu. Seed 89 Mill. Bu. 98 Mill. Bu. 92 Mill. Bu. Residual 16 Mill. Bu. 0 Mill. Bu. 24 Mill. Bu. Total Use 3,111 Mill. Bu. 3,478 Mill. Bu. 3,701 Mill. Bu. Ending Stocks 141 Mill. Bu. 92 Mill. Bu. 385 Mill. Bu. USDA WASDE February 10, 2015
51 Metric Tons/Week 3,000,000 Weekly Soybean Export Sales (06/10/ /29/2015) 2,500,000 2,000,000 1,500,000 1,000, , /09/ /09/ /09/ /09/ /09/2014 USDA Exports Actual Exports USDA-FSA Weekly Export Sales Report & Feb. 10, 2015 WASDE
52 Soybean Supply & Demand Table U.S. Soybean 2012/ /2014 (est.) 2014/2015 (Feb) Planted A Mill. A Mill. A Mill. A. Harvested A Mill. A Mill. A Mill. A. Yield/Harvest A bu bu bu. Begin Stocks 169 Mill. Bu. 141 Mill. Bu. 92 Mill. Bu. Production 3,042 Mill. Bu. 3,358 Mill. Bu. 3,969 Mill. Bu. Ending Stocks are expected to increase 418% Imports 41 Mill. Bu. 72 Mill. Bu. 25 Mill. Bu. Total Supply 3,252 Mill. Bu. 3,570 Mill. Bu. 4,086 Mill. Bu. Crushings 1,689 Mill. Bu. 1,734 Mill. Bu. 1,795 Mill. Bu. Exports 1,317 Mill. Bu. 1,647 Mill. Bu. 1,790 Mill. Bu. Stocks to Use is 10.4% Seed 89 Mill. Bu. 98 Mill. Bu. 92 Mill. Bu. Residual 16 Mill. Bu. 0 Mill. Bu. 24 Mill. Bu. Total Use 3,111 Mill. Bu. 3,478 Mill. Bu. 3,701 Mill. Bu. Ending Stocks 141 Mill. Bu. 92 Mill. Bu. 385 Mill. Bu. USDA WASDE February 10, 2015
53 1994/ / / / / / / / / / / / / / / / / / / / /15 Billion Bushels Stocks-to-Use Ratio Soybean Total Prod. & Use (Billion Bushels) Stocks-to-Use Total Production Total Use February 10, 2015 WASDE Report & Oil Yearbook Table 3
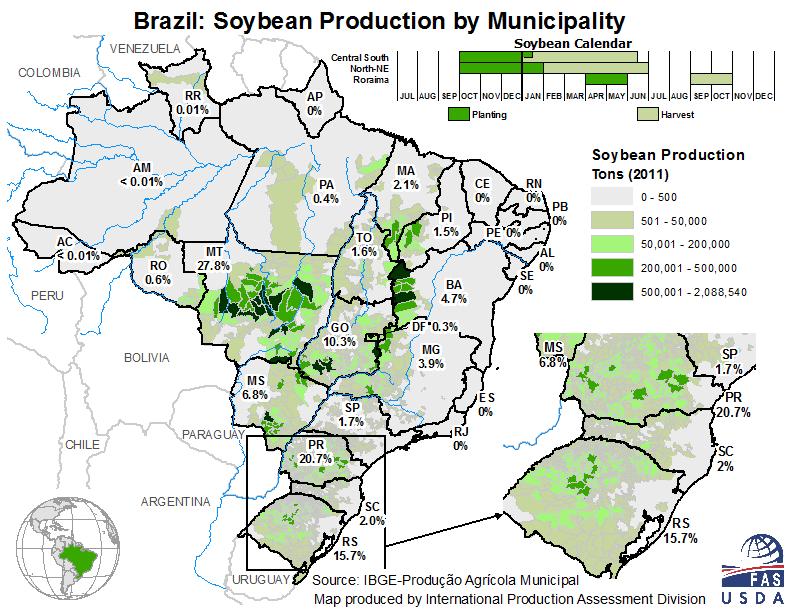
54 1998/ / / / / / / / / / / / / / / / /15 Million Metric Ton Historical Soybean Production (Million Metric Ton) United States Brazil Argentina February 10, 2015 WASDE Report & PSD Tables 21, 22 and 23
55
56
57
58
59 Million Metric Tons Stocks-to-Use Ratio World Soybean Prod, Use & Stocks/Use (Million Metric Ton) Stocks-to-Use Total Production Total Use February 10, 2015 USDA -WASDE & PSD Custom Query
60 Million Metric Tons Stocks-to-Use Ratio World Soybean Prod, Use & Stocks/Use (Million Metric Ton) Stocks-to-Use Total Production Total Use Who holds soybean ending stocks? Argentina 38.9% Brazil 27.8% China 15.9% U.S. 11.7% February 10, 2015 USDA -WASDE & PSD Custom Query
61 Questions?

62 WTI Crude Oil DTN Prophet X pm

63 WTI Crude Oil DTN Prophet X pm

64 March CBOT Corn Futures DTN Prophet X pm

65 December CBOT Corn Futures DTN Prophet X pm

66 March CBOT Soybean Futures DTN Prophet X pm
67 November CBOT Soybean Futures DTN Prophet X pm

68 March MGEX Spring Wheat Futures DTN Prophet X pm

69 September MGEX Spring Wheat Futures DTN Prophet X pm
70 Bushels /Acre What is the new U.S. trend line yield? Average Yield Outlook Trend Line USDA 2014 Annual Production Summary Feed Grains Data Base Table 1
71 Bushels /Acre What is the new U.S. trend line yield? bu/a is 7.0 bu above trend line = 10.6 bu above 2004 = 16.1 bu above 1994 = 14.2 bu above 1992 = 11.0 bu above Average Yield Outlook Trend Line USDA 2014 Annual Production Summary Feed Grains Data Base Table 1
72 Price per Bushel 8.50 Corn Price vs. Stocks/Use Ratio with Inflation Adjustment 1993/94 to 2012/ Percent Stocks-to-Use Historical Price Forecasted Price
73 Bushels /Acre What is the new U.S. trend line yield? Average Yield Outlook Trend Line USDA 2014 Annual Production Summary Feed Grains Data Base Table 1
74 Bushels /Acre What is the new U.S. trend line yield? Average Yield 47.8 bu/a is 2.9 bu above trend line = 1.4 bu above 2005 = 2.3 bu above 1994 = 5.8 bu above Outlook 1992 Trend = 3.0 Line bu above USDA 2014 Annual Production Summary Feed Grains Data Base Table 1
75 Price per Bushel Soybean Price vs. Stocks/Use Ratio with Inflation Adjustment and Data Screening 1993/94 to 2013/ Percent Stocks to Use Historicial Price Forecasted Price
76 Price per Bushel Wheat Price vs. Stocks/Use Ratio 1993/94 to 2012/ Percent Stocks-to-Use Pre 2007 Post