THE ECONOMIC IMPORTANCE OF FORESTRY IN THE SOUTHERN U.S.
|
|
|
- Megan Ryan
- 5 years ago
- Views:
Transcription


1 THE ECONOMIC IMPORTANCE OF FORESTRY IN THE SOUTHERN U.S. THE PATH FORWARD FOR WOOD PRODUCTS: A GLOBAL PERSPECTIVE Belle of Baton Rouge Baton Rouge, LA October 5 th, 2016 Leslie Boby & Bill Hubbard Southern Regional Extension Forestry Omkar Joshi Texas A&M University James Henderson Mississippi State University Shaun Tanger Louisiana State University


2 FOREST ECONOMIC IMPACT DATA Forest Economic Contribution or Forest Economic Impact Analysis Information reported as: * Total Sales * Jobs * Value- Added * Wages and Salaries Importance of Forestry and Forest Products to the State s or Region s Economy Information valuable to: * State Forestry Agencies * University Forestry Programs * Forestry and Forest Products Advocacy Organizations Information goes to Public and Private Sectors Political Decision-makers Economic Decision Makers

3

4 FOREST ECONOMIC SUMMIT LITTLE ROCK, AR MARCH 2015 Comparing forest economic reports not an easy task! Summarizing forest economic data for the region... Not an easy task! How do we compare apples to apples? What are the issues that need to be resolved for better comparison of forest economic data?
 Forestry Industries GDP includes the final cost of goods and services, excludes the value of intermediate goods Total output includes the value of intermediate")
5 ISSUES FOR COMPARING FOREST ECONOMIC DATA 4. Output vs. Gross 5. Definition of Domestic Product (GDP) Forestry Industries GDP includes the final cost of goods and services, excludes the value of intermediate goods Total output includes the value of intermediate goods Different analysts include different sectors when assessing the forest products industry Identify which sectors are being included as part of the direct effect


6 A STANDARD FOREST ECONOMIC ANALYSIS METHOD Survey sent to 60 identified Southern forest economists or those who may use the data- 48 responded! Survey results will guide development of the standard Next steps! Analyze survey data Write the standard
7
8 PERCENTAGE CHANGES Wages declining more quickly than employment from Employment Wages and salaries ($MM) Sector * * L&WP -37% 4% -28% -9% WF -37% -26% -25% -33% P&AP -26% -4% -15% -12% Total -34% -9% -21% -17% South Total 5% 3% 15% -12%
9 PERCENTAGE CHANGES Total Output ($MM) Total value-added ($MM) Sector * * L&WP -36% 7% -29% -1% WF -15% -28% -19% -31% P&AP 16% 0% 3% 4% Total -7% -4% -12% -5% South Total 23% 6% 19% 8%
10 A WEAK RECOVERY UP TO THIS POINT SOME INDICATORS

11

12 Net private domestic investment indicates the total amount of investment in capital by the business sector that is actually used to expand the capital stock. In general, capital depreciation is between 50 to 85 percent of gross invest ment.

13 refers to investment in fixed capital or to the replacement of depreciated fixed capital.

14 Looks good right?

15 The Capital Consumpti on Allowance (CCA) is the portion of the Gross Domestic Product (GDP) which is due to depreciation. measures the amount of expenditure that a country needs to undertake in order to maintain, as opposed to grow, its productivity
16

17

18

19
20

21
22

23
24

25
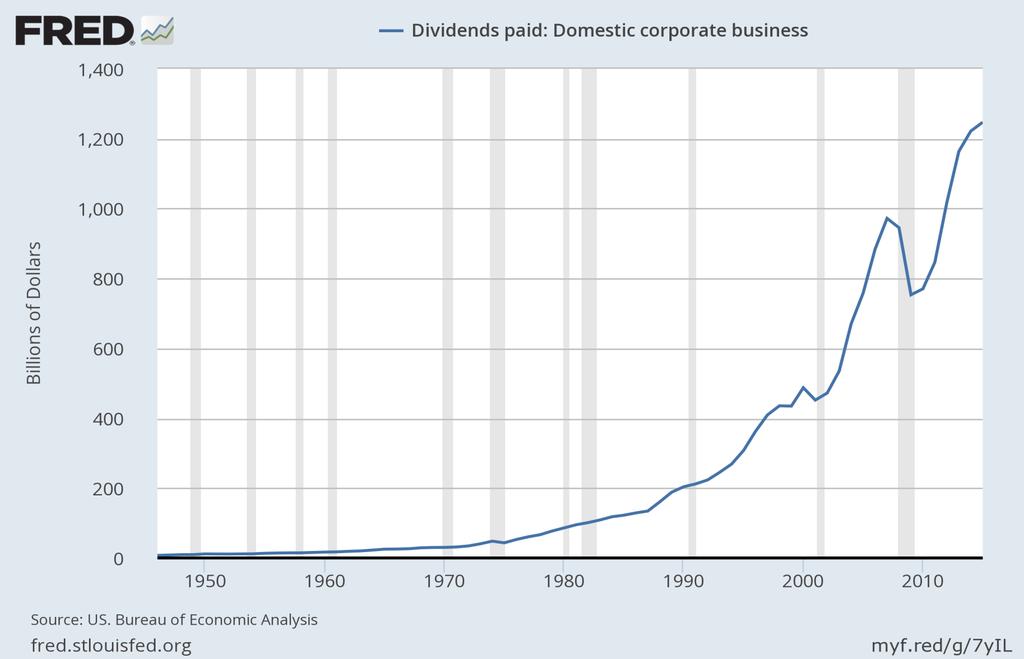
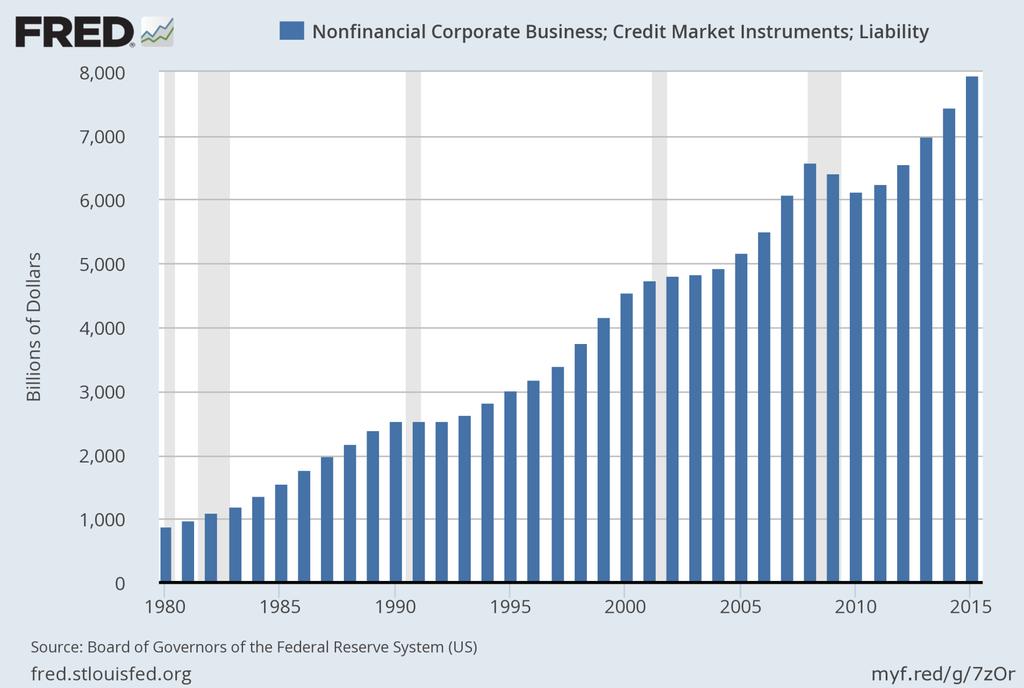
26 IMPORTANT NEXT STEP Test the IMPLAN models to see if corporate profits and other property type payments* are increasing in share of overall tax contributions and in REAL (inflation adjusted) terms, while the rest of the sector has shrank over that same time period. It appears this is less prevalent in the forest products sector as compared to the economy generally. Also, if this is occurring we need to make policy prescriptions as to how to handle more leverage that has been taken on by companies in our sector. Ultimately, we need aggregate demand to increase so that we can move away from this behavior. *Other Property Type Income payments for rents, royalties, and dividends*
27 HOUSING STARTS (SAAR) hstart 2plus 5plus
28 0% 5% 10% 15% 20% 25% 30% 35% 40% % of HOUSING THAT IS MULTIFAMILY ptwoplus pfiveplus
29 WOOD PRODUCTS USE (per UNIT) 75% of structural wood products go to housing (new construction plus remodeling) 50% or more of hardwoods go to housing related activities. BF per unit *Lumber SF(3/8) per unit - Panels 0 single family multi family mobile homes Lumber Panels Source: Wood Products Council Table #7 and #13, ES4, 2006 (*Lumber includes BFE of engineered wood per unit)
30 Declines in primary product mills for the southern region states
31 0 5,000,000 10,000,000 15,000,000 20,000,000 25,000,000 30,000,000 35,000, _Q1 2006_Q2 2006_Q3 2006_Q4 2007_Q1 2007_Q2 2007_Q3 2007_Q4 2008_Q1 2008_Q2 2008_Q3 2008_Q4 2009_Q1 2009_Q2 2009_Q3 2009_Q4 2010_Q1 2010_Q2 2010_Q3 2010_Q4 2011_Q1 2011_Q2 2011_Q3 2011_Q4 2012_Q1 2012_Q2 2012_Q3 2012_Q4 2013_Q1 2013_Q2 2013_Q3 2013_Q4 2014_Q1 2014_Q2 2014_Q3 2014_Q4 2015_Q1 2015_Q2 2015_Q3 2015_Q4 2016_Q1 LUMBER
32 6,000,000 5,000,000 4,000,000 3,000,000 2,000,000 1,000,000 0 Plywood and Vaneers
33 TOTAL NORTH AMERICAN SOFTWOOD LUMBER CAPACITY BBF %Ch 2016 %Ch USA West % % South % % Other % % Total % % Canada BC % % EOR % % Total % % North America % % Copyright 2014 RISI, Inc. Proprietary Information
34 2006_Q1 2006_Q3 2007_Q1 2007_Q3 2008_Q1 2008_Q3 2009_Q1 2009_Q3 2010_Q1 2010_Q3 2011_Q1 2011_Q3 2012_Q1 2012_Q3 2013_Q1 2013_Q3 2014_Q1 2014_Q3 2015_Q1 2015_Q3 2016_Q1 6,000,000 5,000,000 4,000,000 3,000,000 2,000,000 1,000,000 0 OSB
35 2006_Q1 2006_Q3 2007_Q1 2007_Q3 2008_Q1 2008_Q3 2009_Q1 2009_Q3 2010_Q1 2010_Q3 2011_Q1 2011_Q3 2012_Q1 2012_Q3 2013_Q1 2013_Q3 2014_Q1 2014_Q3 2015_Q1 2015_Q3 2016_Q1 42,000,000 41,000,000 40,000,000 39,000,000 38,000,000 37,000,000 36,000,000 35,000,000 34,000,000 33,000,000 32,000,000 PULP AND PAPER
36 6,200,000 6,400,000 6,600,000 6,800,000 7,000,000 7,200,000 7,400, _Q1 2006_Q2 2006_Q3 2006_Q4 2007_Q1 2007_Q2 2007_Q3 2007_Q4 2008_Q1 2008_Q2 2008_Q3 2008_Q4 2009_Q1 2009_Q2 2009_Q3 2009_Q4 2010_Q1 2010_Q2 2010_Q3 2010_Q4 2011_Q1 2011_Q2 2011_Q3 2011_Q4 2012_Q1 2012_Q2 2012_Q3 2012_Q4 2013_Q1 2013_Q2 2013_Q3 2013_Q4 2014_Q1 2014_Q2 2014_Q3 2014_Q4 2015_Q1 2015_Q2 2015_Q3 2015_Q4 2016_Q1 CHIP MILLS
37 NORTH AMERICAN TISSUE SUPPLY WILL SURGE About 400,000 tons of new capacity will be built in 2016 and 2017 (about 4% of market) while annual demand will grow 1%. Company Location Capacity (000Tons) Start-up Date DoubleTree Arizona, USA Cascades Oregon, USA Orchids Paper Mexicali, Mexico von Drehle Mississippi, USA First Quality South Carolina,USA St. CroixTissue Maine, USA First Quality Pennsylvania,USA St. CroixTissue Maine, USA Resolute Forest Products Tennessee,USA Procter & Gamble Utah, USA Orchids Paper South Carolina,USA SofidelAmerica Ohio, USA Source: RISI, Company Reports 2016 Outlook Global Paper and Forest Products
38 MARKET PULP SUPPLY WILL CONTINUE TO GROW Company Location Capacity (000 Tonnes) Grade Startup CMPC Rio Grande do Sul, Brazil 1300 hardwood 2015 Paper Excellence Chetwynd, Canada 240 BCTMP 2015 Klabin Paraná, Brazil 1500 hardwood / softwood 2016 RayonierAM Jesup, GA 220 softwood/fluff 2016 International Paper Riegelwood,NC 400 softwood/fluff 2016 Domtar Ashdown, AR 500 softwood/fluff 2016 Fibria (Tres Lagoas II) Tres Lagoas, Brazil 1850 hardwood 2017 Eldorado Tres Lagoas, Brazil 2000 hardwood 2019 Approximately 1 million tonnes of BEK (4% of capacity) and 2 million tonnes of fluff/softwood pulp capacity (9% of capacity) will ramp up in 2016 versus annual demand growth of 1%-2%
39 CONTAINERBOARD SUPPLY WILL SURGE About 1.9 million tons of new and converted containerboard capacity will ramp up in North America (about 5% of market) over the next two years. Demand will grow 1%-2% annually. Company Location Capacity (000Tons) Start-up Date Smurfit Kappa Group Townsend Hook, UK 260 Q Klabin Goiania, Brazil 110 Q International Paper Valliant, Oklahoma 360 Q SPFiber Newberg,Oregon 300 Q Pratt Industries Valparaiso, Indiana 370 Q Kruger Trois-Rivières, Quebec Corrugated Supplies* Bedford Park, Illinois Outlook Global Paper and Forest Products

40 QUESTIONS?