Crop Mask for Sugarcane, Rice and Cotton Crops in Punjab & Sindh, Pakistan
|
|
|
- Bennett Bailey
- 5 years ago
- Views:
Transcription


1 Crop Mask for Sugarcane, Rice and Cotton Crops in Punjab & Sindh, Pakistan
2 ii ii
3 i i
4 ii Table of Contents 1. Introduction Objectives Basic Guidelines Quality Control Development of Crop Mask for Kharif Crops ( ) Study Area Work Flow st Acquisition of Satellite Data Ground Truthing Surveys for Collecting Training Samples Digitization of Segments Masking of Sugarcane Crop nd Acquisition of Satellite Data Classification of Satellite Images Ground Validation Surveys Ground Truth/Validation Surveys in Sindh Province Ground Truth/Validation Surveys in Punjab Province Accuracy Assessment of Satellite Image Classification Accuracy Assessment of Satellite Image Classification - Sindh Province Accuracy Assessment of Satellite Image Classification- Punjab Province Extraction of Target Crop Classes Vectorization of Target Crop Classes Cross Checking of Vectorized Data Supplementary Quality Control of Vectorized Data Merging of Polygons for Final Crop Mask Kharif Crop Mask-Sindh Province Kharif Crop Mask-Sindh Left Zone Kharif Crop Mask-Sindh Right Zone Kharif Crop Mask-Punjab Province Kharif Crop Mask-Punjab Southern Zone Kharif Crop Mask-Punjab Central Zone Kharif Crop Mask-Punjab North East Zone Statistics of Crop Mask Data for Kharif ( )... 94
5 iii 6.1. Kharif Crop Mask ( ) - Sindh Province Kharif Crop Mask ( ) - Sindh Left Zone (SLZ) Kharif Crop Mask ( ) - Sindh Right Zone (SRZ) Kharif Crop Mask ( ) - Punjab Province Kharif Crop Mask ( ) - Punjab Southern Zone (PSZ) Kharif Crop Mask ( ) - Punjab Central Zone (PCZ) Kharif Crop Mask ( ) -Punjab North East Zone Conclusion
6 iv List of Figures Figure 1: Map Showing Study Area for Development of Kharif Crop Mask... 2 Figure 2: Work Flow Chart... 2 Figure 3 : Digitized Segments... 3 Figure 4: Original and Masked Images... 4 Figure 5: Training Samples for Spectral Signatures... 5 Figure 6: Classified Image... 5 Figure 7: Field observation Figure 8: a) Thatta Classified image, b) Extracted Sugarcane Crop Class of Thatta Figure 9: Cross Checking of Vectorized Data Figure 10: Kharif Crop Mask Area-Sindh Left Zone Figure 11: Kharif Crop Mask Area-Sindh Right Zone Figure 12: Kharif Crop Mask Area- Punjab South Zone Figure 13: Kharif Crop Mask Area- Punjab Central Zone Figure 14: Kharif Crop Mask Area- Punjab North East Zone
7 v List of Tables Table 1: Ground Truth Survey Pictures for Sindh Left Zone Table 2: Ground Validation Survey Pictures for Sindh Left Zone Table 3: Ground Truth Survey Pictures for Right Sindh Zone Table 4: Ground Validation Survey Pictures for Right Sindh Table 5: Ground Truth Survey Pictures for Punjab South Zone Table 6: Ground Validation Survey Pictures for Punjab South Zone Table 7: Ground Truth Survey Pictures for Punjab Central Zone Table 8: Ground Validation Survey Pictures for Punjab Central Zone Table 9: Ground Truth Survey Pictures for Punjab North East Zone Table 10: Ground Validation Survey Pictures for Punjab North East Zone Table 11: Accuracy Assessment Mechanism Table 12: Accuracy Assessment-Sindh Left Zone Table 13: Accuracy Assessment- Sindh Right Zone Table 14: Accuracy Assessment- Punjab South Zone Table 15: Accuracy Assessment- Punjab Central Zone Table 16: Accuracy Assessment- Punjab North East Zone... 43
8 1. Introduction Information on agricultural land use is one of the most important parameters required for policy and decision support regarding availability of reliable crops statistics, sustenance of food security and management of environmental hazards. Keeping in view increasing population pressure in Pakistan, there is a need for improved management of the agricultural resources as irrigation water management, fertilizer availability, plant protection and administering other farm resources. For the purpose, it is imperative to gather reliable data related to agricultural land use of crops. The understanding of the climate change issues and adaptive strategy can also be fine-tuned through availability of reliable information on agriculture land use at local, regional and country wide scales. 2. Objectives The prime objective of the project is to develop crop mask showing spatial distribution for rabi (Wheat and Potato crops) and kharif (Sugarcane, Rice and Cotton crops). The area of interest (AOI) comprises of Punjab and Sindh provinces. 3. Basic Guidelines The basic guidelines document provided to all the team members covered the project related data storage hierarchy scheme, satellite data nomenclature, processing levels, crops colour coding and other parameters. Two satellite image acquisitions were made. The 1st acquisition was made during May-June 2014 covering period of early crop growth. The 2nd acquisition was carried out during August-September 2014 at peak crop growth. An appropriate record of satellite acquisitions was maintained. All images were spatially enhanced with single approach as per documentation. These images were rectified with baseline ortho-rectified spot images. The subsets of these images were prepared according to administrative district boundary. These subsets were named according to nomenclature rule given below: KharifSugarcaneMultanSPOT acquisition1.img K S MN S A1.img KharifCottonMultanSPOT acquisition1.img K C MN S A1.img 4. Quality Control A standard operating procedure (SOP) was documented for this program to: Develop standard and harmonized procedures for quality control Arrange homogeneous adoption of procedures for quality control Different teams were formed which were provided with standardized procedure documents. These documents covered all the steps including basic guidelines, classification steps, post classification accuracy assessment, vectorization, refinement, keeping records of files and others. 5. Development of Crop Mask for Kharif Crops ( ) 5.1 Study Area The kharif crop mask was developed for Punjab (except Potohar zone) and Sindh provinces as shown in the map in Fig 1 1


9 5.2 Work Flow Figure 1: Map Showing Study Area for Development of Kharif Crop Mask Figure 2: Work Flow Chart 2


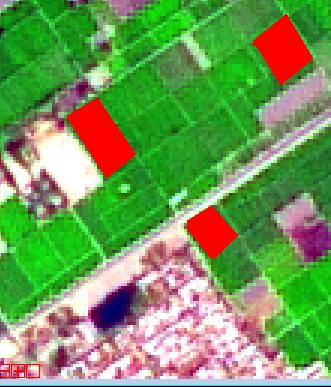
10 5.3 1 st Acquisition of Satellite Data Minimum cloud cover SPOT (2.5, 5 & 10 m) data was acquired for the study area. After preparation of all the acquired images, the defined segments were overlayed on them. The print out of all the segments were taken at a scale of 1: Ground Truthing Surveys for Collecting Training Samples Pre-classification field surveys were carried out for Kharif crops ( ) based on randomly selected segments. The information about areas other than selected segments were also collected randomly to gather maximum number of training samples. 5.5 Digitization of Segments After completing pre-classification field surveys of the entire study area, the segments were digitized based on collected information about each field within the segments. Figure 3 : Digitized Segments 5.6 Masking of Sugarcane Crop Prior to classification, the field surveys of randomly selected segments for Kharif crops ( ) were carried out. The supervised classification was carried out on 1st acquisition satellite data for extracting special distribution of sugarcane crop. This extracted sugarcane crop was then masked as off on 2nd acquisition satellite data. The purpose was to assure minimal inter-crop anomalies. 3
 from the 2nd acquisition satellite data.")
11 Figure 4: Original and Masked Images nd Acquisition of Satellite Data Minimum cloud cover SPOT5 (2.5, 5 & 10 m) data were acquired for defined agricultural zones. After preparation, registrations of these images were checked against those of 1st acquisition. Already developed mask on 1st acquisition was omitted ( off ) from the 2nd acquisition satellite data Classification of Satellite Images Each ground survey team was assigned responsibility for classification of satellite data of the respective areas surveyed. Supervised classification was run on multi-date data. The training areas were created based on digitized segments and other randomly collected points to obtain reliable classification statistics. Some other training areas were also created through visual comparison with those created based on field survey. All the images/subsets were classified based on these training areas using Gaussian Maximum Likelihood Supervised technique. The already developed mask for sugarcane and other crops were also used during classification phase. Uniform nomenclature and crop colour codes were followed. 4


12 Figure 5: Training Samples for Spectral Signatures Figure 6: Classified Image 5
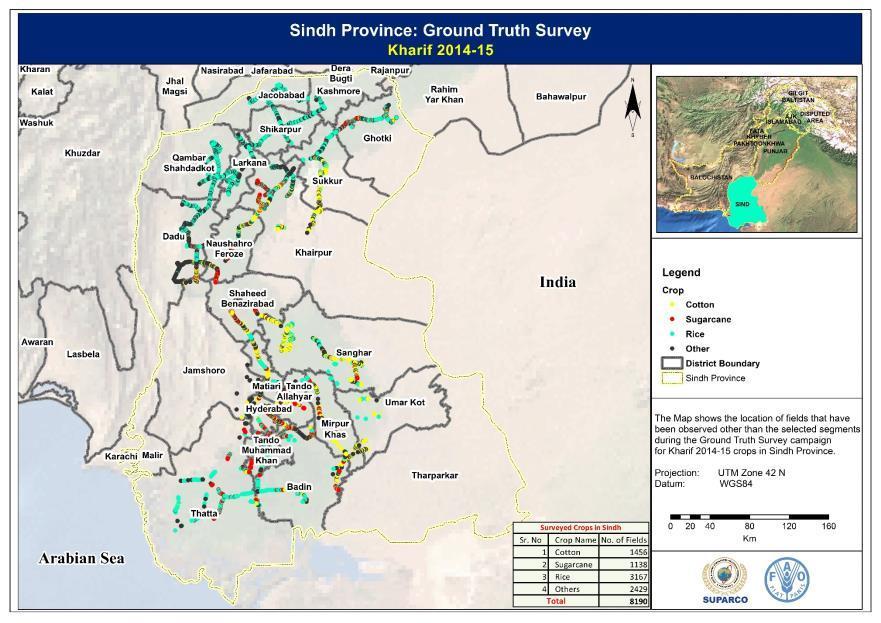
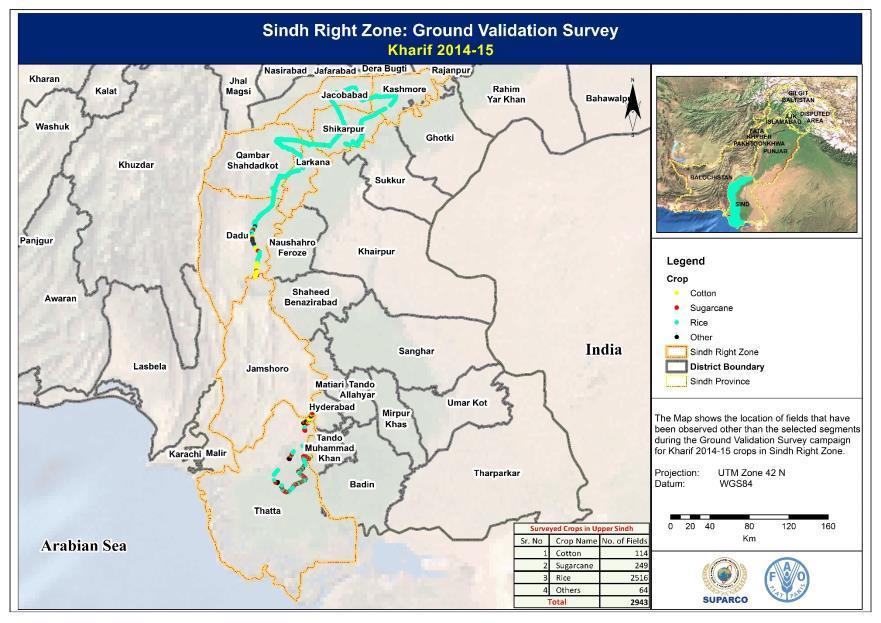
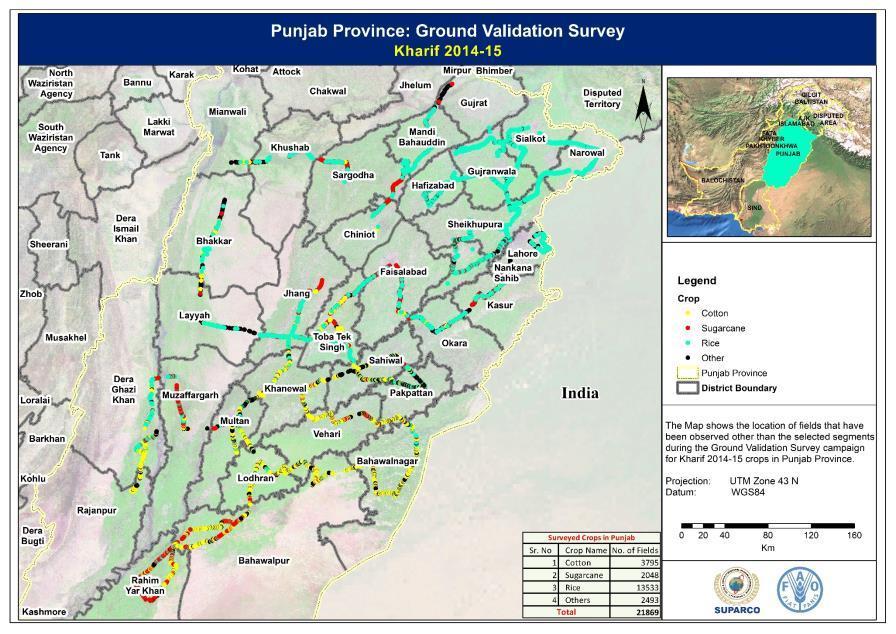
13 5.9. Ground Validation Surveys The stratified random sampling technique was used for ground validation of image classification results for Kharif ( ). Sampling sites and number of points were based on crop density and heterogeneity. District wise ground truth points (Lat, Long) were collected for whole of the study area in Punjab and Sindh. These teams carried out surveys of each district twice covering different areas Ground Truth/Validation Surveys in Sindh Province Two teams each comprising of two members were sent to collect ground validation data of Sindh Province covering 21 districts in right and left Sindh zones. Each team surveyed each district twice during different timelines covering various areas. 6
14 7
15 8
 During 1st and 2nd survey of Sindh Left Zone (SLZ) the thirteen (13) districts covered were: Badin, Ghotki, Hyderabad, Khairpur, Matiari, Mirpur Khas, Naushahro Feroze,")
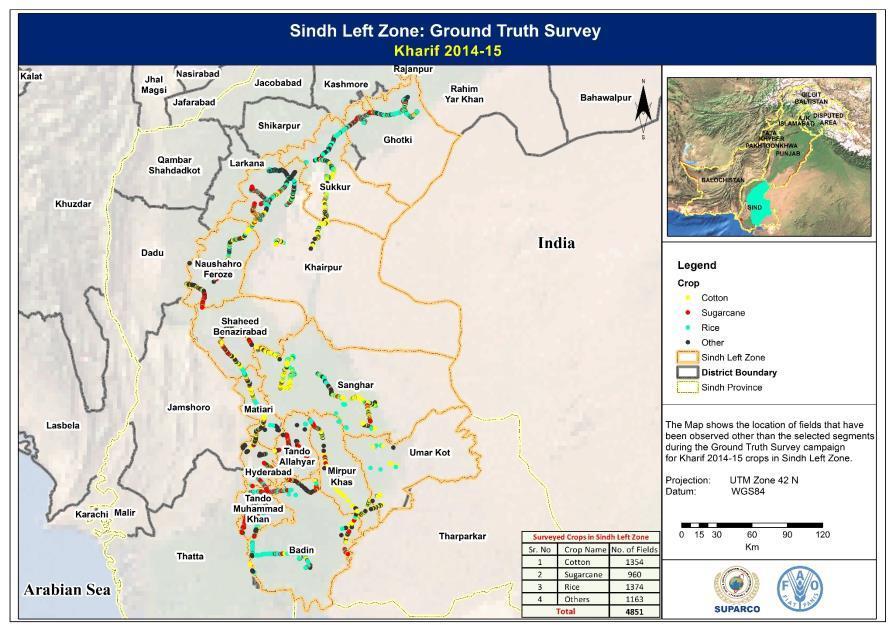
16 Sindh Left Zone (SLZ) During 1st and 2nd survey of Sindh Left Zone (SLZ) the thirteen (13) districts covered were: Badin, Ghotki, Hyderabad, Khairpur, Matiari, Mirpur Khas, Naushahro Feroze, Sanghar, Shaheed Benazirabad, Sukkur, Tando Allahyar, Tando Muhammad Khan, and UmerKot st Field Survey The ground validation data (Lat,Long) collected during 1st field survey of Sindh Left Zone are given in the map as follows: 9
17 10


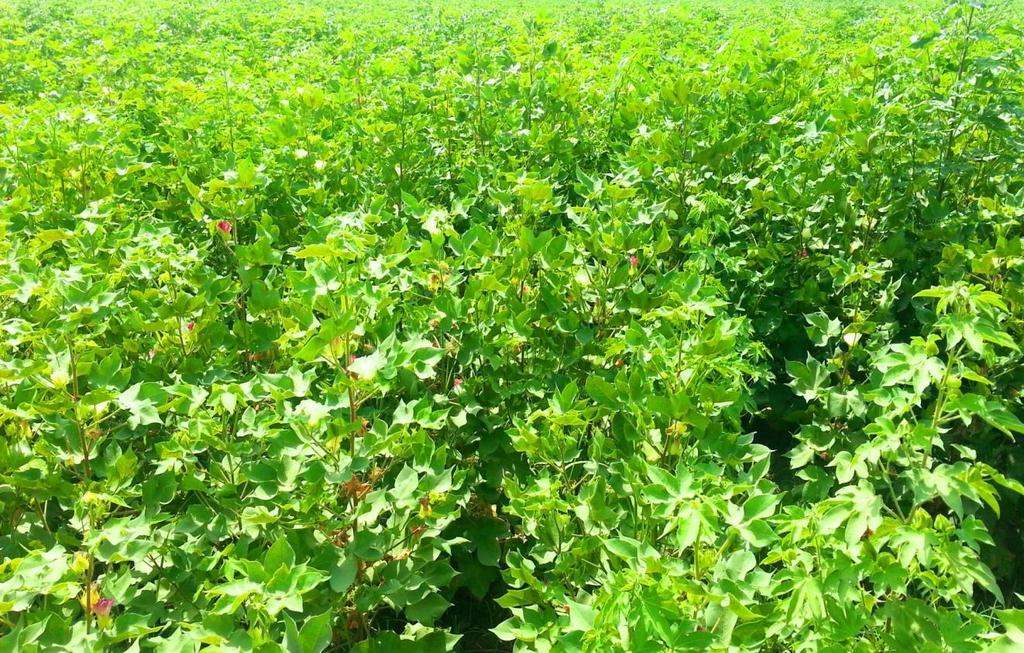
18 Table 1: Ground Truth Survey Pictures for Sindh Left Zone Sukkur: Cotton Hyderabad: Sugarcane Badin: Rice Sanghar: Cotton Tando Muhammad Khan: Sugarcane Tando Allahyar: Sugarcane Ghotki: Rice. Benazirabad: Cotton 11
 collected during 2 nd")
19 nd Field Survey The ground validation data (Lat, Long) collected during 2 nd field survey of Sindh left zone are given in the map as follows: 12

20 13


21 Table 2: Ground Validation Survey Pictures for Sindh Left Zone Mirpurkhas: Sugarcane Naushahro Feroze: Sugarcane Umerkot: Cotton Ghotki: Sugarcane Sanghar: Rice Matiari: Cotton Shikarpur:Rice Tando Muhammad Khan: Rice 14
 During 1st and 2nd field surveys of Sindh Right Zone (SRZ) the eight (08) districts covered were: Kashmore, Larkana, Qambar Shahdadkot, Shikarpur, Dadu, Jacobabad,")
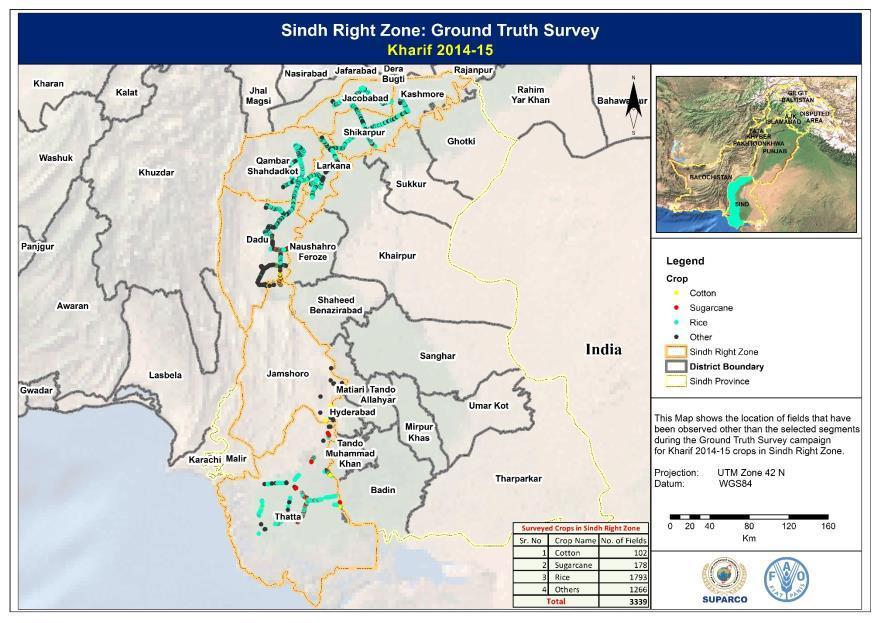
22 Sindh Right Zone (SRZ) During 1st and 2nd field surveys of Sindh Right Zone (SRZ) the eight (08) districts covered were: Kashmore, Larkana, Qambar Shahdadkot, Shikarpur, Dadu, Jacobabad, Jamshoro and Thatta st Field Survey The ground validation data (Lat, Long) collected during 1st field survey of Sindh Right zone are given in the map as follows: 15
23 16


24 Table 3: Ground Truth Survey Pictures for Sindh Right Zone Qambar Shahdatkot: Rice Jacobabad: Rice Larkana: Rice Dadu: Cotton Dadu: Rice Thatta: Sugarcane skashmore: Rice Jamshoro: Cotton 17
25 nd Field Survey The ground validation data (Lat, Long) collected during 2nd survey of Sindh Right zone are given in the map as follows: 18
26 19


27 Table 4: Ground Validation Survey Pictures for Right Sindh Dadu: Cotton Thatta: Rice Kashmore: Rice Qambar Shahdadkot: Rice Larkana: Cotton Shikarpur: Rice Jamshoro: Cotton Thatta: Sugarcane 20
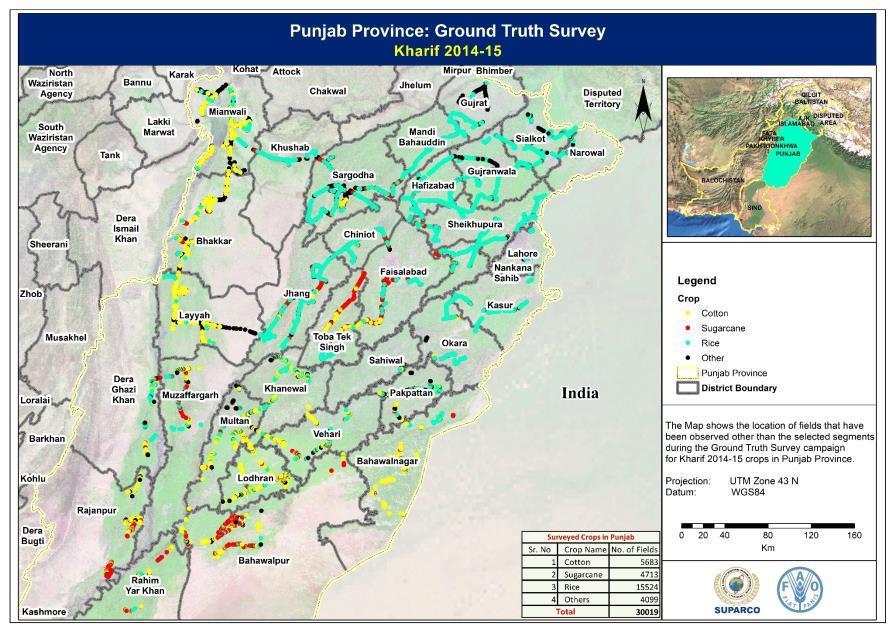
28 Ground Truth/Validation Surveys in Punjab Province To collect ground validation points in Punjab province, three teams each comprising of two members were formed. These teams collected ground validation points for Punjab Province in 32 districts in Southern, Central, and North East Zones. 21
29 22
30 23
 During 1 st and 2 nd field surveys of Punjab southern zone the twelve (12) districts covered were: Rajanpur, Rahim Yar Khan, Pakpattan, Muzaffargarh, Multan, Khanewal,")
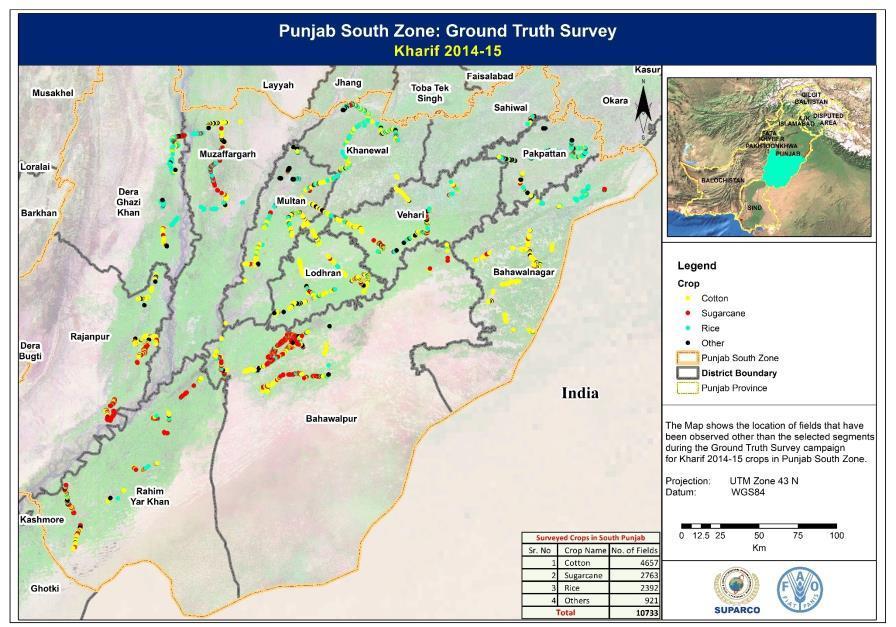
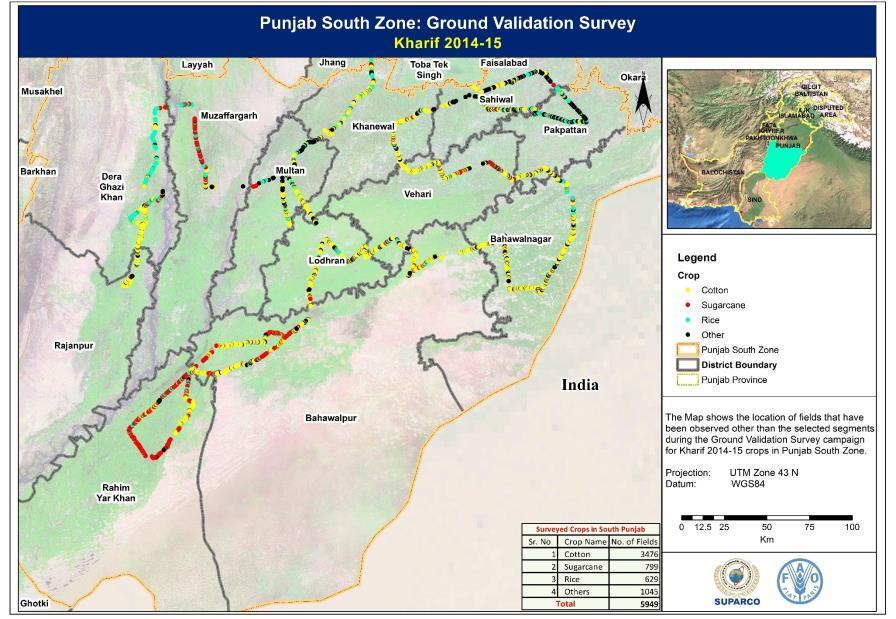
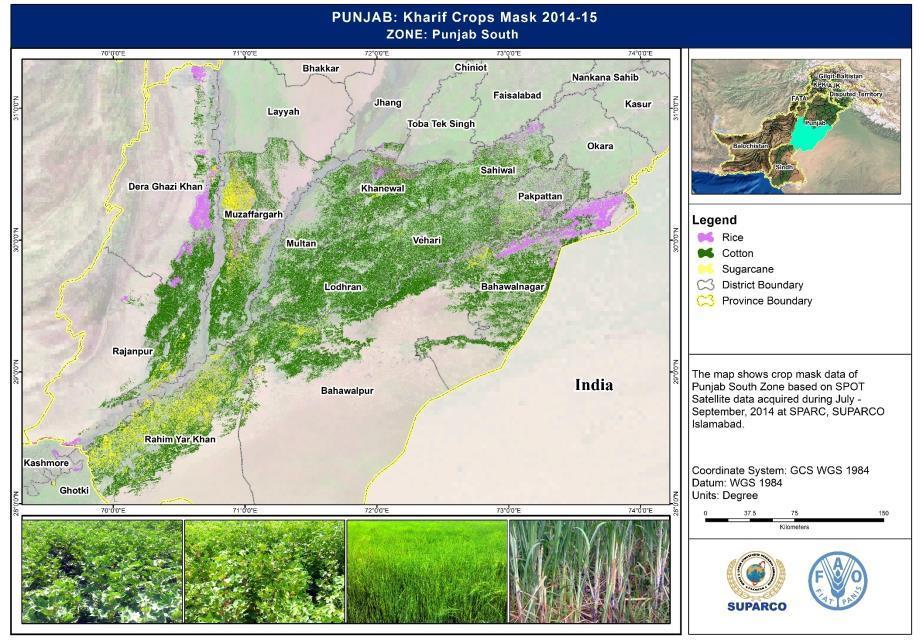
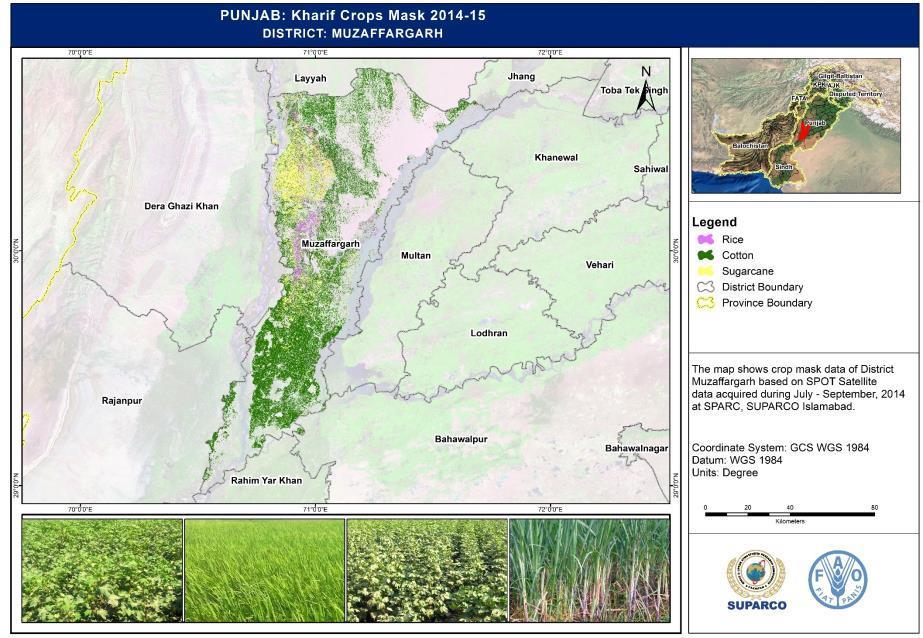
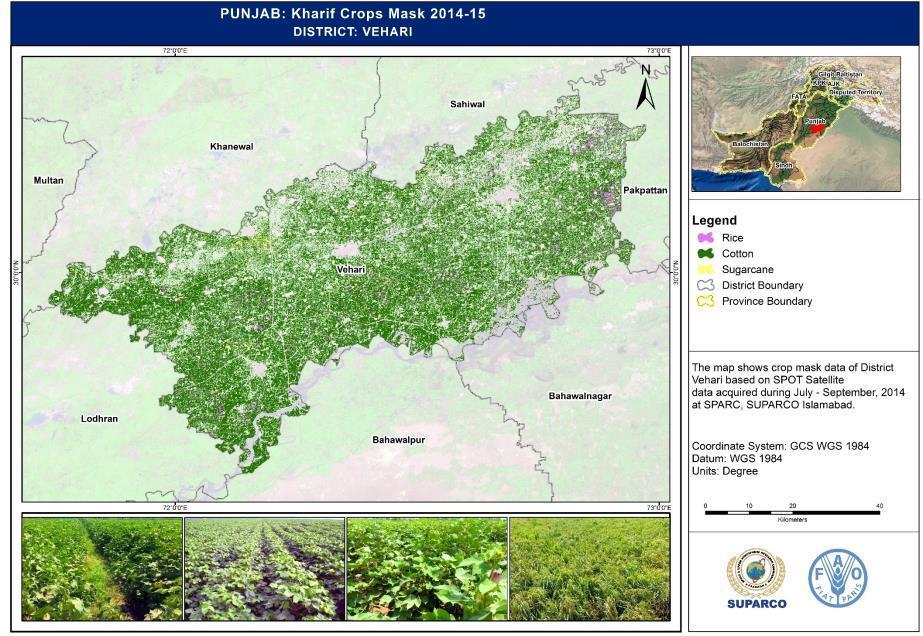
31 Punjab Southern Zone (PSZ) During 1 st and 2 nd field surveys of Punjab southern zone the twelve (12) districts covered were: Rajanpur, Rahim Yar Khan, Pakpattan, Muzaffargarh, Multan, Khanewal, Lodhran, Dera Ghazi Khan, Bahawalpur, Bahalwalnagar, Vehari and Sahiwal st Field Survey The ground validation points (Lat, Long) collected during 1 st field survey of Punjab southern zone are given in the map as follows: 24
32 25


33 Table 5: Ground Truth Survey Pictures for Punjab South Zone Pakpattan: Cotton Bahawalpur: Sugarcane Bahawalnagar: Rice Muzaffargarh: Rice Lodhran: Cotton Khanewal: Rice Pakpattan: Sugarcane Dera Ghazi Khan: Cotton 26
 collected during 2")
34 nd Survey The ground validation data (Lat, Long) collected during 2 nd survey of Punjab southern zone are given in the map as follows: 27
35 28


36 Table 6: Ground Validation Survey Pictures for Punjab South Zone Bahawalnagar: Rice Vehari: Rice Vehari: Cotton Dera Ghazi Khan: Rice Bahawalpur: Sugarcane Rahim Yar Khan: Sugarcane Khanewal: Cotton Bahawalnagar: Cotton Punjab Central Zone (PCZ) 29

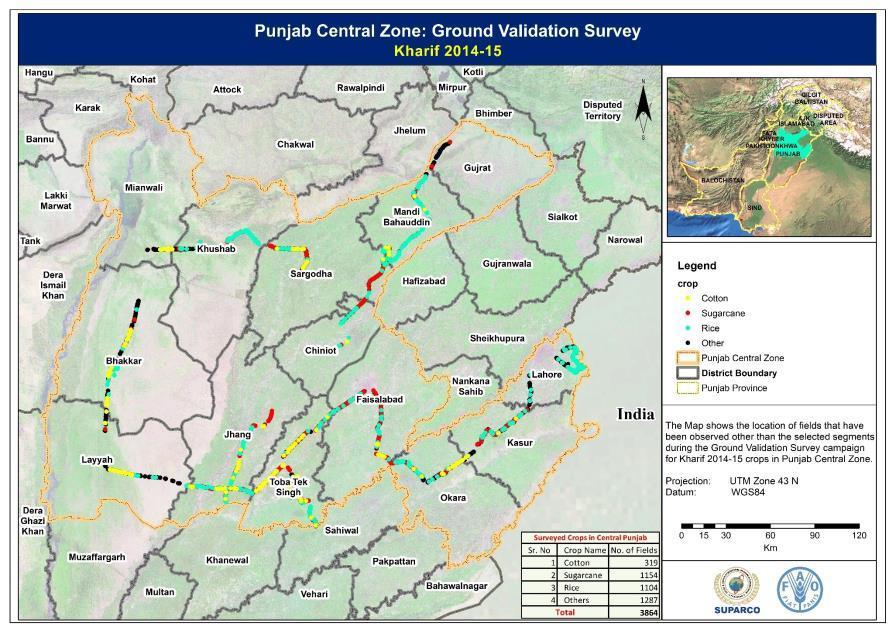
37 During 1 st and 2 nd field surveys of Punjab central zone the fourteen (14) districts covered were: Toba Tek Singh, Bhakkar, Chiniot, Faisalabad, Gujrat, Jhang, Kasur, Khushab, Lahore, Layyah, Mandi Bahauddin, Mianwali, Okara and Sargodha st Field Survey The ground validation data (Lat, Long) collected during 1 st field survey of Punjab central zone are given in the map as follows: 30

38 31


39 Table 7: Ground Truth Survey Pictures for Punjab Central Zone Bhakkar: Cotton Sargodha: Sugarcane Chiniot: Rice Kasur: Rice Jhang: Rice Faisalabad: Sugarcane Layyah: Cotton Toba Tek Singh: Cotton 32
40 nd Field Survey The ground validation data (Lat, Long) collected during 2 nd field survey of Punjab central zone are given in the map as follows: 33
41 34


42 Table 8: Ground Validation Survey Pictures for Punjab Central Zone Jhang: Rice Khushab: Rice Toba Tek Singh: Cotton Mandi Bahauddin: Rice Sargodha: Sugarcane Jhang: Cotton Okara: Rice Faisalabad: Sugarcane 35
 Zone During 1 st and 2 nd field surveys of Punjab north east zone the six (06) districts covered were: Gujranwala, Sialkot, Sheikhupura, Hafizabad, Nankana")
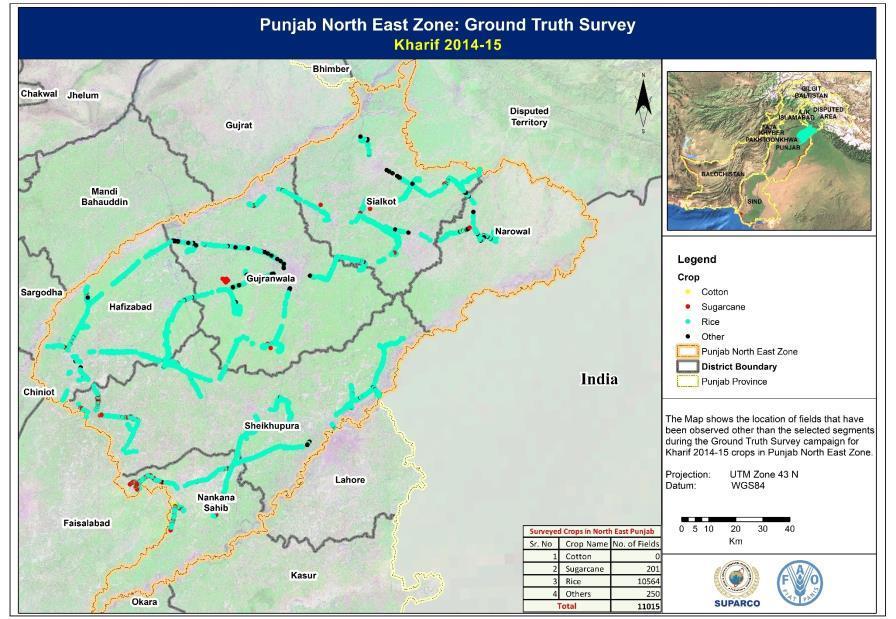
43 Punjab North East (PNE) Zone During 1 st and 2 nd field surveys of Punjab north east zone the six (06) districts covered were: Gujranwala, Sialkot, Sheikhupura, Hafizabad, Nankana and Narowal st Field Survey The ground validation data (Lat, Long) collected during 1 st field survey of Punjab north east zone are given in the map as follows: 36
44 37

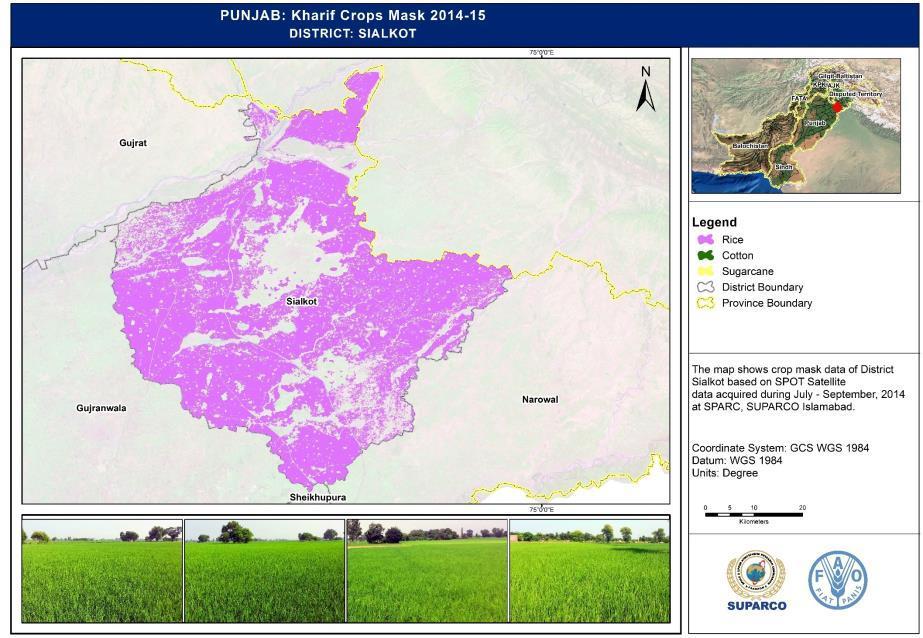
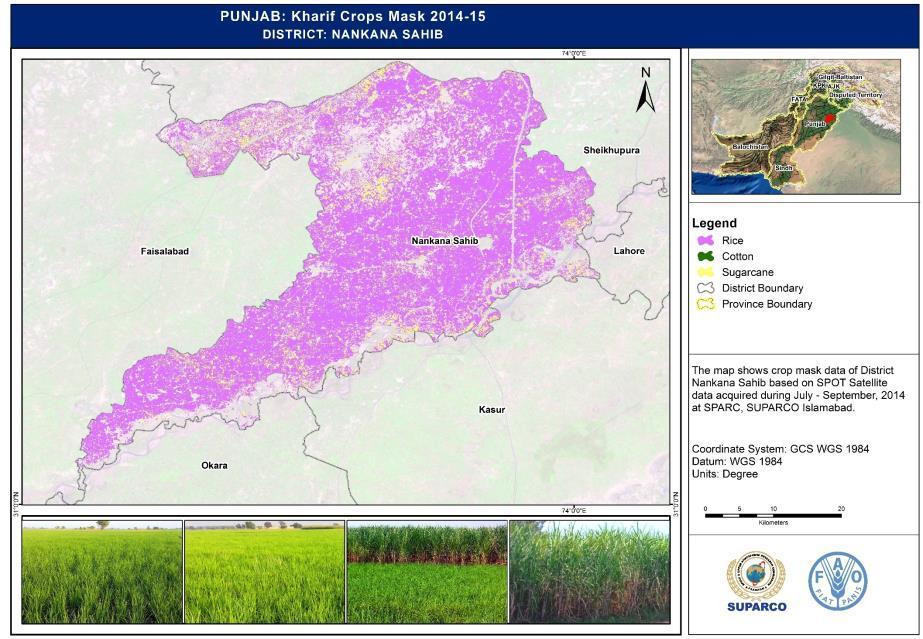
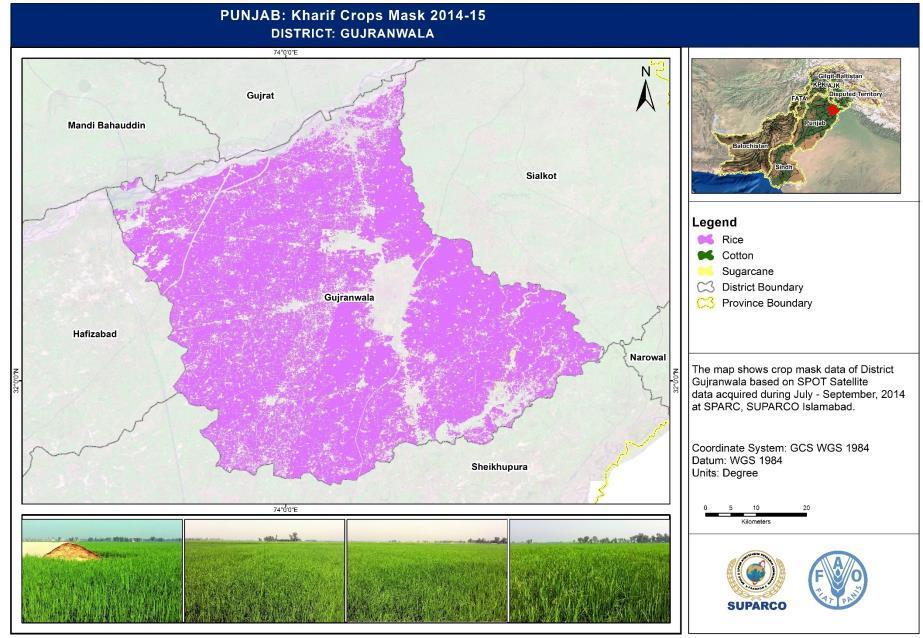
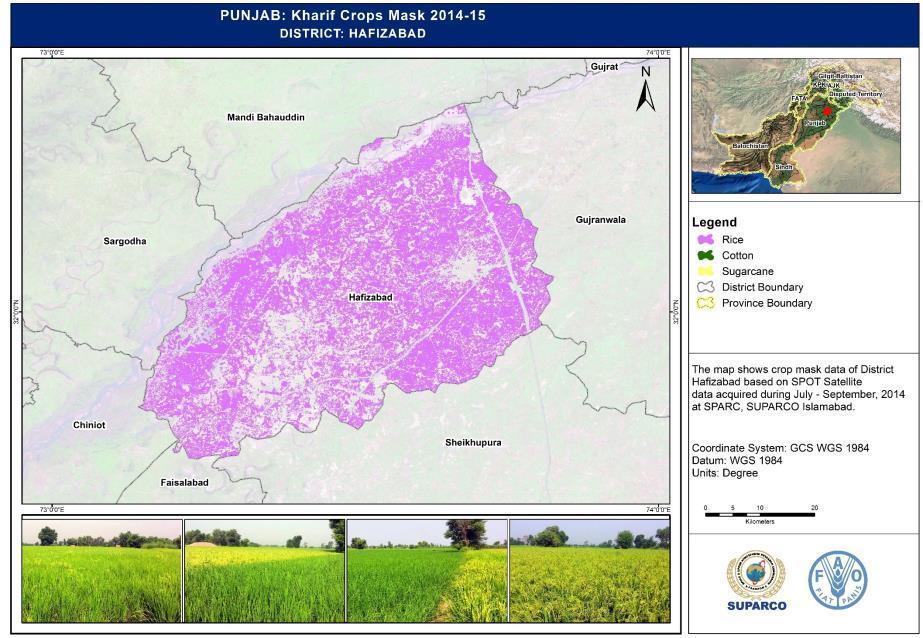
45 Table 9: Ground Truth Survey Pictures for Punjab North East Zone Gujranwala: Rice Hafizabad: Rice Sheikhupura: Rice Narowal: Rice Hafizabad: Sugarcane Nankana Sahib: Sugarcane & Rice Nankana Sahib: Rice Sialkot: Rice 38
 collected during 2")
46 nd Field Survey The ground validation data (Lat, Long) collected during 2 nd field survey of Punjab north east zone are given in the map as follows: 39
47 40


48 Table 10: Ground Validation Survey Pictures for Punjab North East Zone Gujranwala: Rice Hafizabad: Rice Nankana Sahib: Rice Sheikhupura: Rice Sialkot: Rice Hafizabad: Sugarcane Nankana Sahib: Sugarcane Narowal: Rice Accuracy Assessment of Satellite Image Classification 41


49 Ground Truth Crop Mask Development The Error Matrix (EM)/Confusion Matrix (CM) tests were applied to assess accuracy of classified data. In this matrix, classified data were compared with ground truth information. Different measures and statistics were derived from the confusion matrix. on sampled data collected during 1 st and 2 nd surveys is as follow: Accuracy Assessment of Satellite Image Classification - Sindh Province Sindh Left Zone (SLZ) The accuracy assessment of classification results of all the images carried out based on both the 1 st and 2 nd surveys of Sindh Left zone is as given in the table below: Figure 7: Field observation Table 11: Accuracy Assessment Mechanism Classification Results Sugarcane Rice Cotton Reliability /User s accuracy In addition Kappa coefficient, average and overall accuracy tests were also applied as: Average Accuracy= (1+2+3)/3 Overall Accuracy= +l) Sugarcane Rice Cotton Unclassified a b c d e f g h i j k l (a*100) / (a+e+i) (f*100) / (b+f+j) (k*100) / (c+g+k) Producer s accuracy (Precision) (a*100)/ (a+b+c+d) (f*100)/ (e+f+g+h) (k*100)/ (i+j+k+l) (a+f+k)/(a+b+---- The threshold level of accuracy for the Project was set at a minimum of 80 percent. In case the overall accuracy of data was substandard, the classification was revised either for whole of the image or subset. Ground validation of all the classification result images/subsets covering whole of the study area based Table 12: Accuracy Assessment-Sindh Left Zone S # District 1 st Survey 2 nd Survey Overall Accuracy (%) K- Statistics Sindh Right Zone (SRZ) Overall Accuracy (%) The accuracy assessment of classification results of all the images carried out based on both the 1 st and 2 nd surveys of Sindh Right zone is as given in the table below: Table 13: Accuracy Assessment- Sindh Right Zone K- Statistics 1 Sanghar Benazriabad Hyderabad Matiari Umerkot Naushehro Firoze Mirpurkhas Ghotki Badin Tando M.Khan Tando Allahyar Sukkur Khairpur S # District 1 st Survey 2 nd Survey Overall Accuracy (%) K- Statistics Overall Accuracy (%) K- Statistics 1 Kashmore Qambar Shahdadkot Jacobabad Shikarpur Dadu Larkana Thatta Jamshoro
50 Accuracy Assessment of Satellite Image Classification- Punjab Province Punjab Southern Zone (PSZ) The accuracy assessment of classification results of all the images, carried out based on 1 st and 2 nd surveys of Punjab southern zone is given in the table below: Table 14: Accuracy Assessment- Punjab South Zone S # District 1 st Survey 2 nd Survey Overall Accuracy (%) K- Statistics Overall Accuracy (%) Punjab Central Zone (PCZ) K- Statistics 1 Bahawalpur Khanewal Lodhran Vehari Rajanpur Rahim yar khan Multan Bahawalnagar DG Khan Muzaffargarh Sahiwal Pakpattan The accuracy assessment of classification results of all the images, carried out based on both the 1 st and 2 nd surveys of Punjab central zone is as given in the table below: Table 15: Accuracy Assessment- Punjab Central Zone S # District 1 st Survey 2 nd Survey Overall Accuracy (%) K- Statistics Overall Accuracy (%) Punjab North East (PNE) Zone K- Statistics 1 Bhakkar Toba Tek Singh Jhang Gujrat Chiniot Faisalabad Sargodha Khushab Kasur Mandi Bahauddin Lahore Layyah Mianwali Okara The accuracy assessment of classification results of all the images, carried out based on both the 1 st and 2 nd surveys of Punjab north east zone is as given in the table below: Table 16: Accuracy Assessment- Punjab North East Zone S # District 1 st Survey 2 nd Survey Overall Accuracy (%) K- Statistics Overall Accuracy (%) K- Statistics 1 Hafizabad Gujranwala Narowal Sialkot Sheikhupura Nankana Extraction of Target Crop Classes After completing all the accuracy assessment steps and reviewing the classification results where accuracy was less than 80%, only the target crop classes i.e. Sugarcane, Rice and Cotton crop classes were extracted from the classified images. 43
 Extracted Sugarcane Crop Class")


51 Figure 8: a) Thatta Classified image, Vectorization of Target Crop Classes After extraction of target crop classes from the classified images, raster format were converted to vector format Cross Checking of Vectorized Data Using minimum working scale of 1:25000, the vector files generated for all the Kharif crops were cross checked with the following: b) Extracted Sugarcane Crop Class of Thatta Original unclassified satellite images Classified images (to check the shift and area) Land use /Land cover data of Punjab and Sindh In addition, the vector files were also overlayed on multi-date satellite images for necessary addition/deletion. Figure 9: Cross Checking of Vectorized Data Supplementary Quality Control of Vectorized Data After cross checking of vectorized data, dedicated teams were formed to check the quality of vectorized data. These teams marked the areas where there was a likelihood of mixing of target crop with other crops Merging of Polygons for Final Crop Mask After cross checking of all vector data, shape files of each target Kharif crop class within a province were merged to get final zone/province wise crop mask showing spatial distribution of that crop. 44
52 5.16. Kharif Crop Mask-Sindh Province 45

53 46
54 47
55 48
56 49
57 Kharif Crop Mask-Sindh Left Zone 50
58 51

59 52

60 53
61 54
62 55
63 56
64 57
65 Kharif Crop Mask-Sindh Right Zone 58
66 59
67 60
68 61
69 62

70 63
71 5.17. Kharif Crop Mask-Punjab Province 64

72 65
73 66
74 67

75 68
76 69
77 Kharif Crop Mask-Punjab Southern Zone 70
78 71
79 72
80 73
81 74
82 75

83 76
84 77
85 Kharif Crop Mask-Punjab Central Zone 78
86 79

87 80
88 81
89 82
90 83
91 84
92 85
93 Kharif Crop Mask-Punjab North East Zone 86

94 87
95 88

96 89
97 90
98 91
99 92

100 93
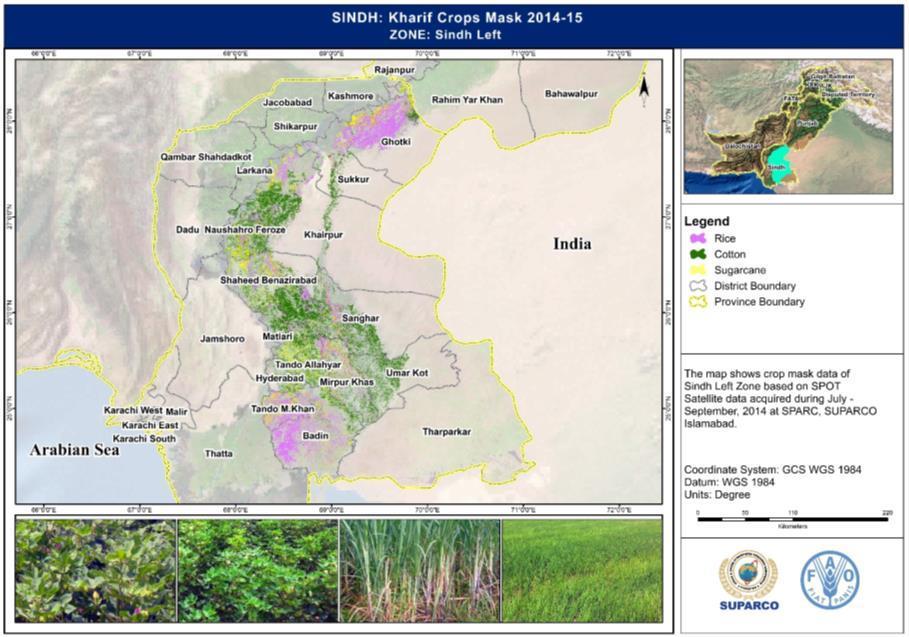
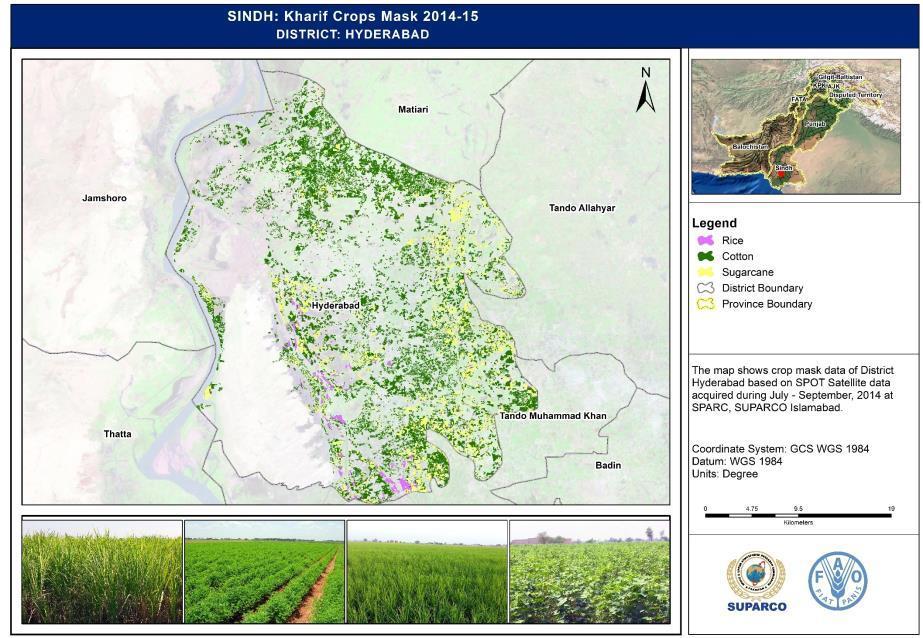
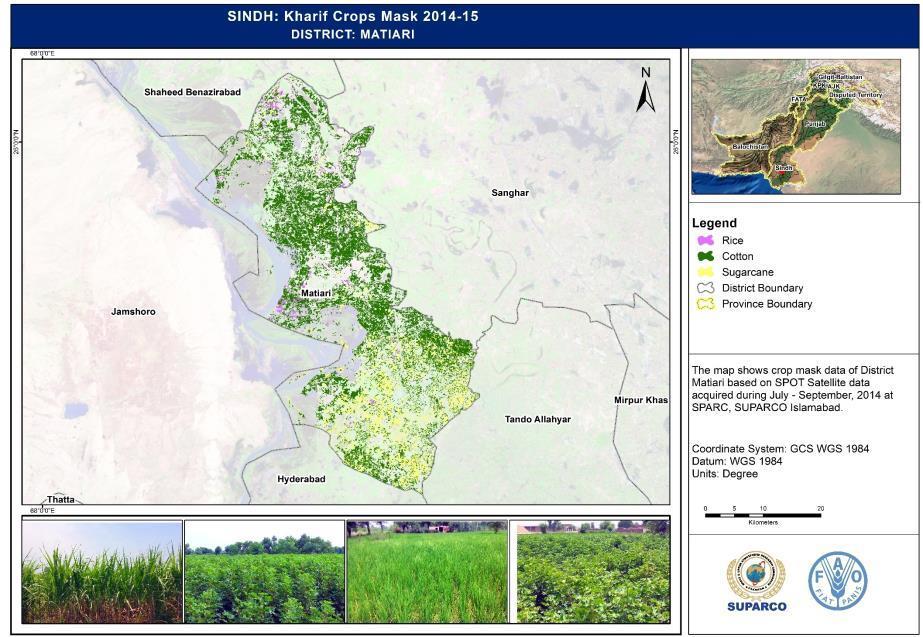
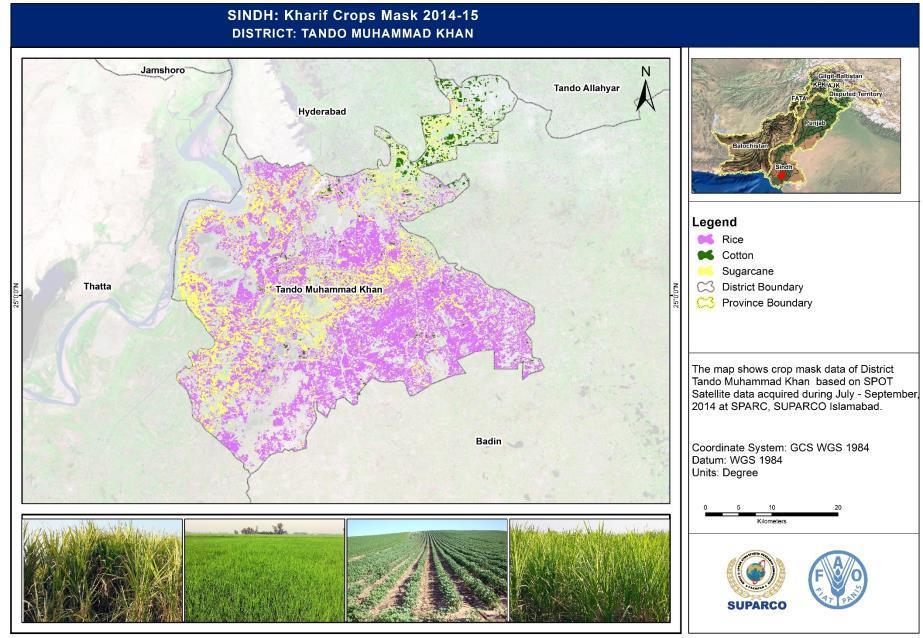
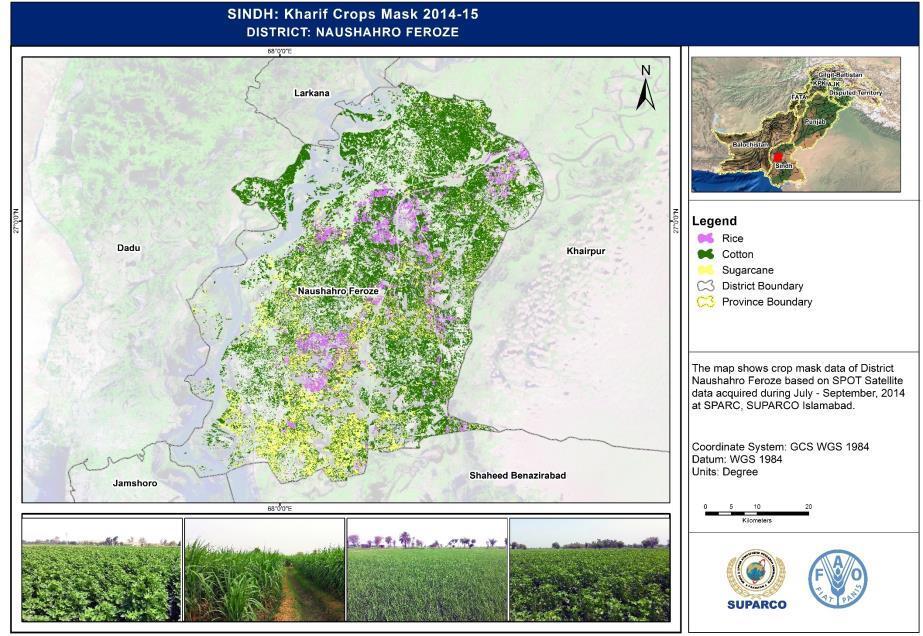
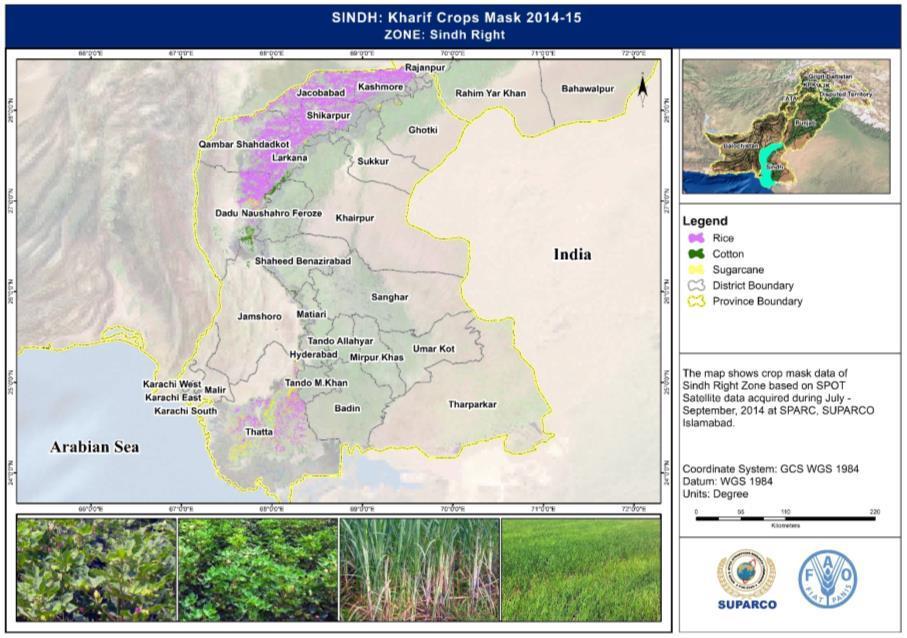
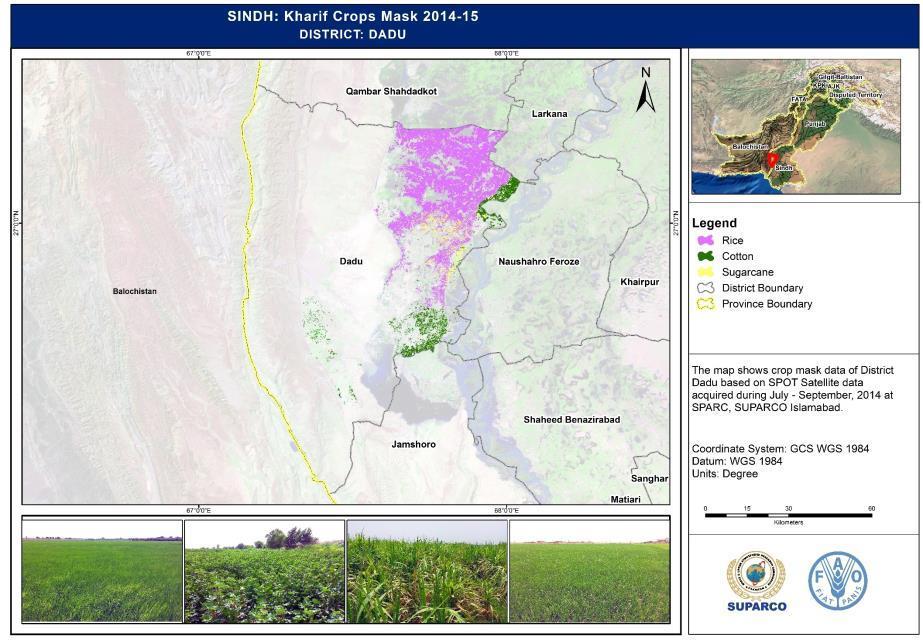
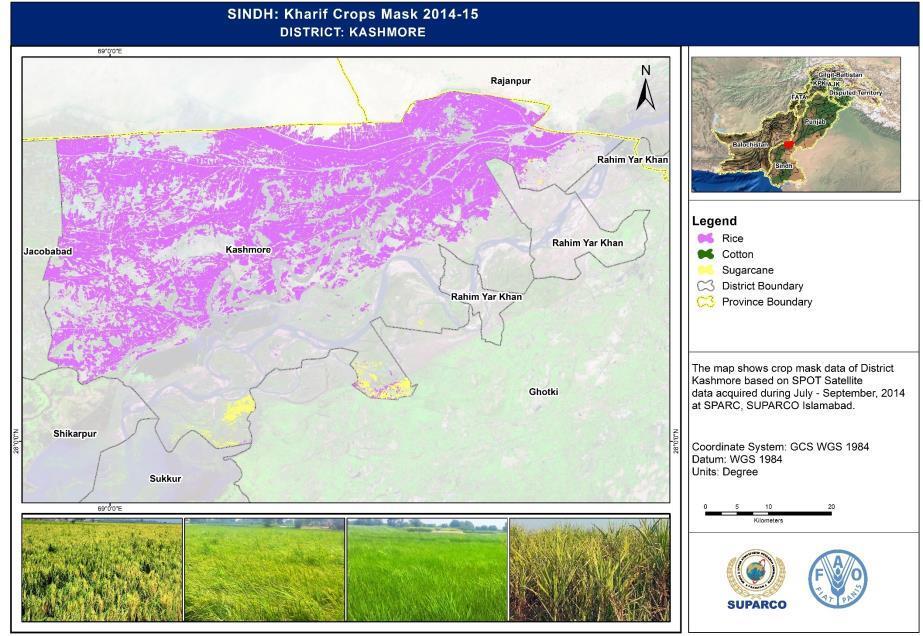
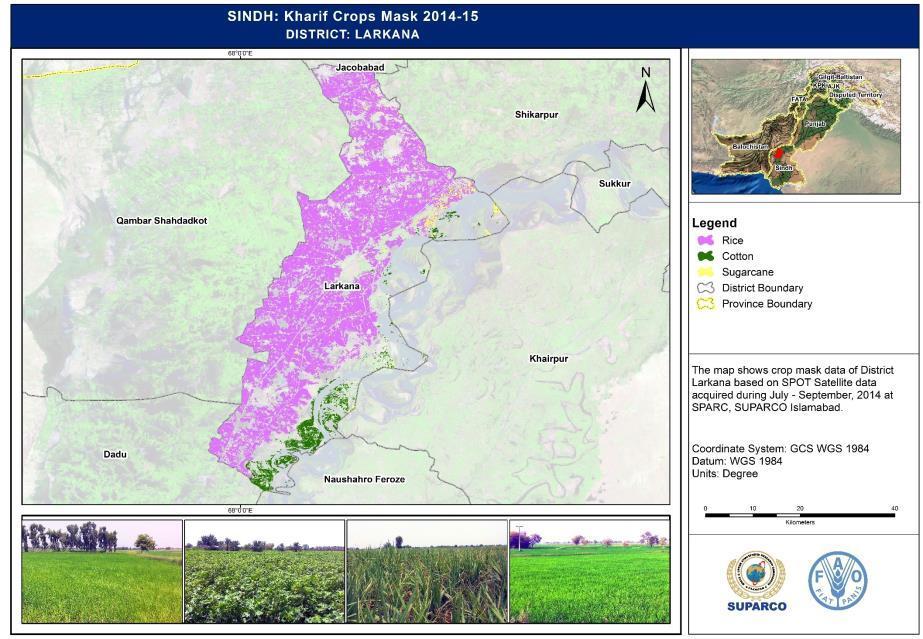
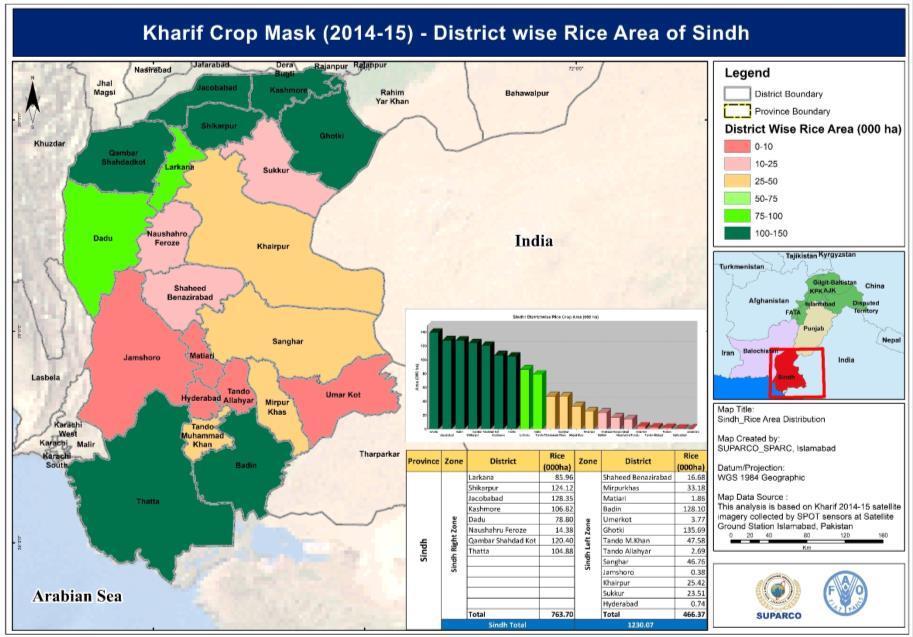
101 6. Statistics of Crop Mask Data for Kharif ( ) 6.1. Kharif Crop Mask ( ) - Sindh Province Using high resolution SPOT 5 data crop masks or digital information layers were developed for kharif crops ( ) i.e. cotton, rice and sugarcane crops varied in term of area under cultivation. Rice was observed to be at highest level with 1.23 million ha followed by cotton (0.77 million ha) and sugarcane (0.29 million ha). Crop percent contribution to the overall crop masks at Sindh province level was observed to be 34 percent for cotton followed by rice (53.6 percent) and sugarcane (12.9 percent). Sindh province was further subdivided into two zones based on variation in cropping pattern for kharif crops. Sindh Right Zone is characterized by dominance of Coarse IRRI rice crop. Sindh Left is zone of mixed cropping pattern where all three crops are grown and cotton & sugarcane crops are most dominant in term of area under cultivation. 94
102 95
103 96
104 97

, Badin (26.5 percent), Tando Muhammad Khan (9.8 percent) and Sanghar (9.7 percent).")
105 Kharif Crop Mask ( ) - Sindh Left Zone (SLZ) This zone is comprised of thirteen districts and dominated by Cotton and sugarcane crops. Overall contribution of the zone to the crop mask at Sindh level is 39.2 percent rice, 82.1 percent sugarcane and 95.5 percent cotton. Major Sugarcane growing districts at zone level are Shaheed Benazirabad (14.5 percent), Naushero Feroze (11.8 percent) and Badin (11.7 percent). Major rice growing districts at zone level are Ghotki (28.8 percent), Badin (26.5 percent), Tando Muhammad Khan (9.8 percent) and Sanghar (9.7 percent). Cotton growing districts at zone level are Sanghar (28.9 percent), Naushero Feroze (13.3 percent), Khairpur (12.5 percent) and Umer Kot (9.6 percent) Kharif Crop Mask ( ) - Sindh Right Zone (SRZ) This zone is comprised of eight districts and dominated by Rice crop. Overall contribution of the zone to the crop mask at Sindh level is percent rice, percent sugarcane and 4.54 percent cotton. Major Sugarcane growing districts at zone level are Thatta (28.2 percent), Jamshoro (9.5 percent), and Dadu (5.8 percent). Major rice growing districts at zone level are Jacobabad (17.1 percent), Shikarpur (16.6 percent), and Qambar Shahdadkot (16.1 percent). Cotton growing districts at zone level are Dadu (39.0 percent), Jamshoro (37.7 percent) and Larkana (18.9 percent). Figure 10: Kharif Crop Mask Area-Sindh Left Zone Figure 11: Kharif Crop Mask Area-Sindh Right Zone 98
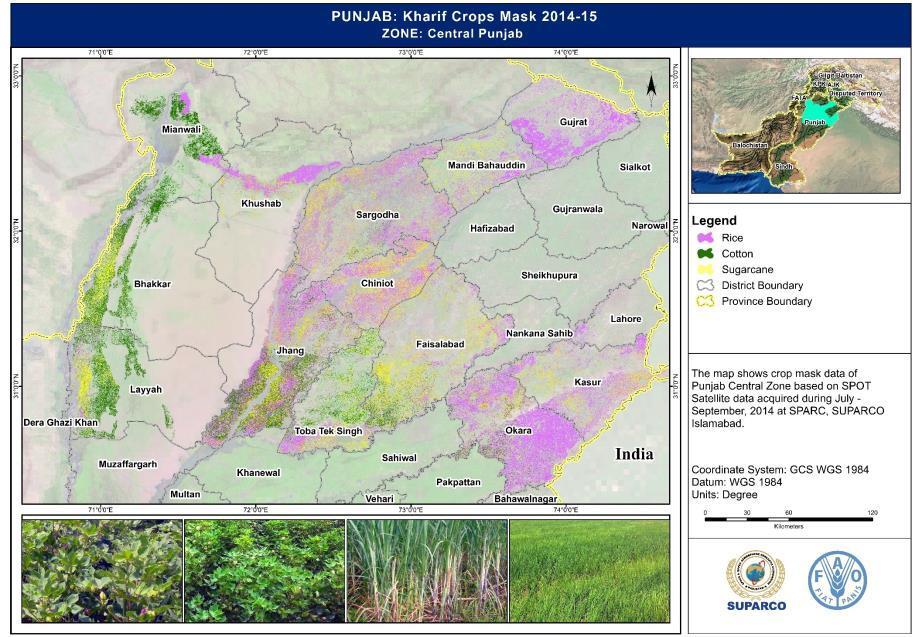
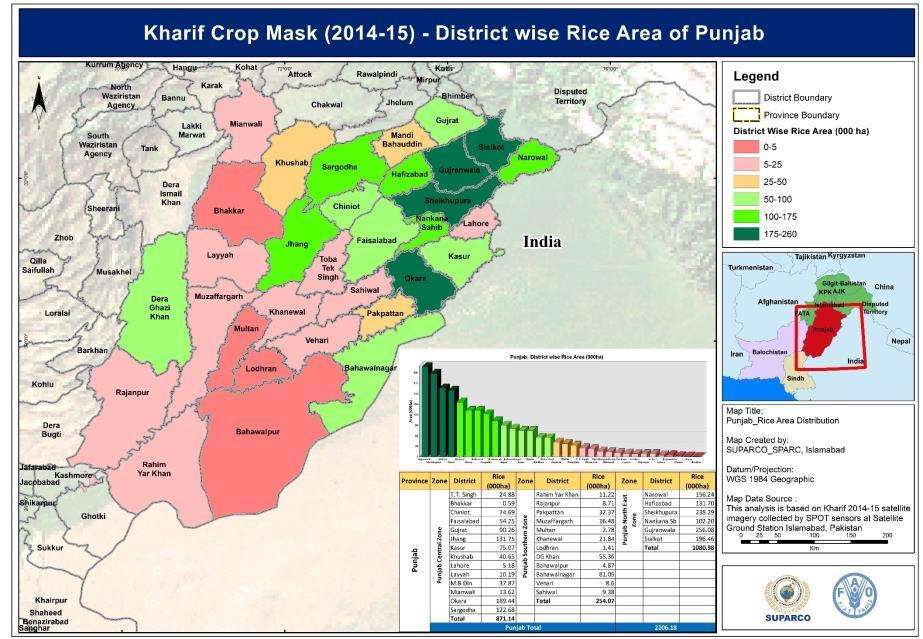
106 6.2. Kharif Crop Mask ( ) - Punjab Province Using high resolution SPOT 5 data crop masks or digital information layers were developed for kharif crops ( ) i.e. cotton, rice and sugarcane crops. These crops varied in term of area under cultivation. Cotton was observed to be at highest side with 2.38 million ha followed by rice (2.06 million ha) and sugarcane (0.605 million ha). Crop percent contribution to the overall crop mask at Punjab province level was observed to be 47 percent followed by rice (40 percent) and sugarcane (12 percent). Punjab province was further subdivided into three zones based on variation in cropping pattern for kharif crops. Punjab North East Zone is smallest zone and characterized by dominance of basmati rice crop. Central Punjab is zone of mixed cropping pattern where all three crops are grown and sugarcane is most dominating in term of area under cultivation. Punjab South zone is more dominant in terms of cotton crop. 99
107 100
108 101
109 102

, Bahawalpur (21.8 percent), Sahiwal (12.4 percent) and Rajanpur (8.")
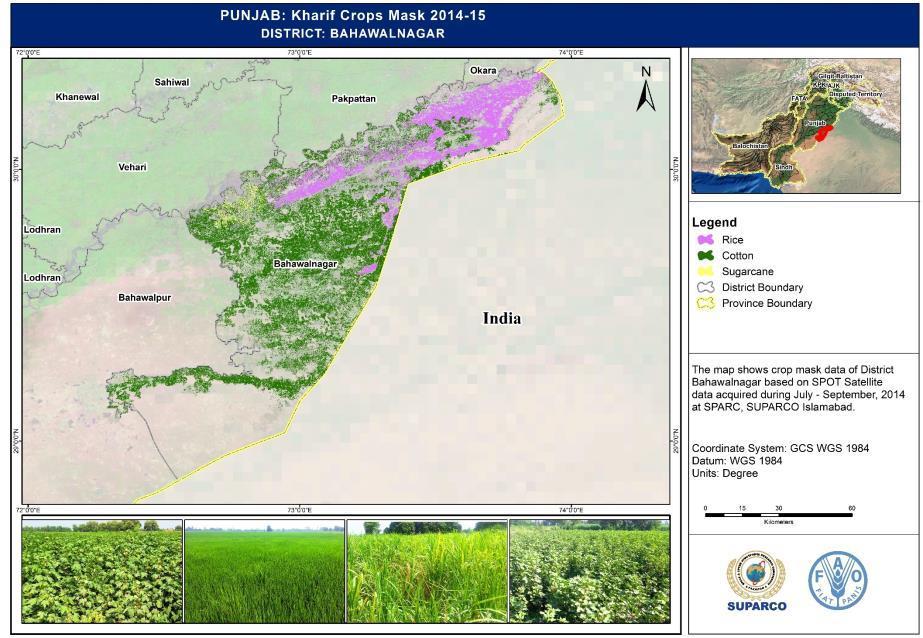
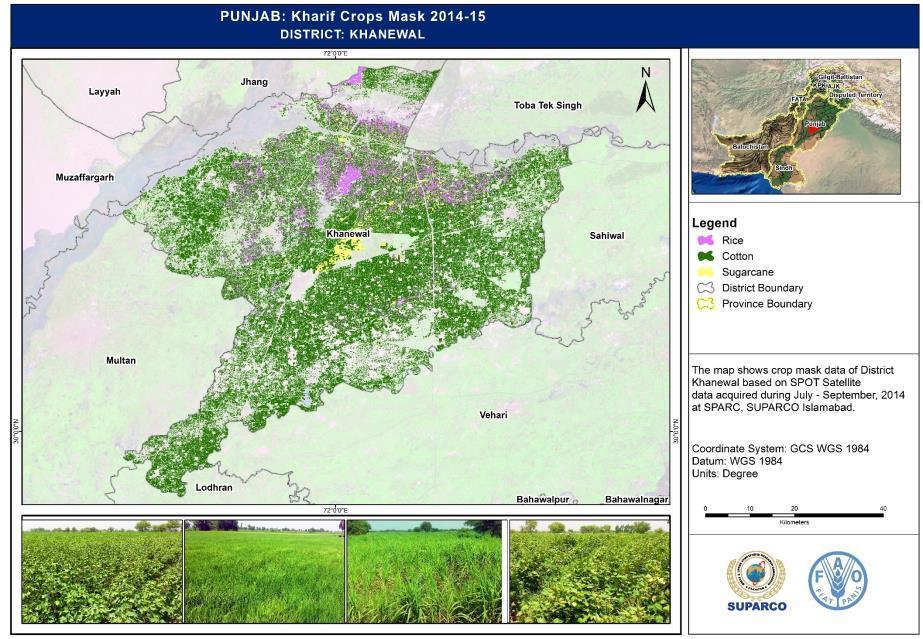
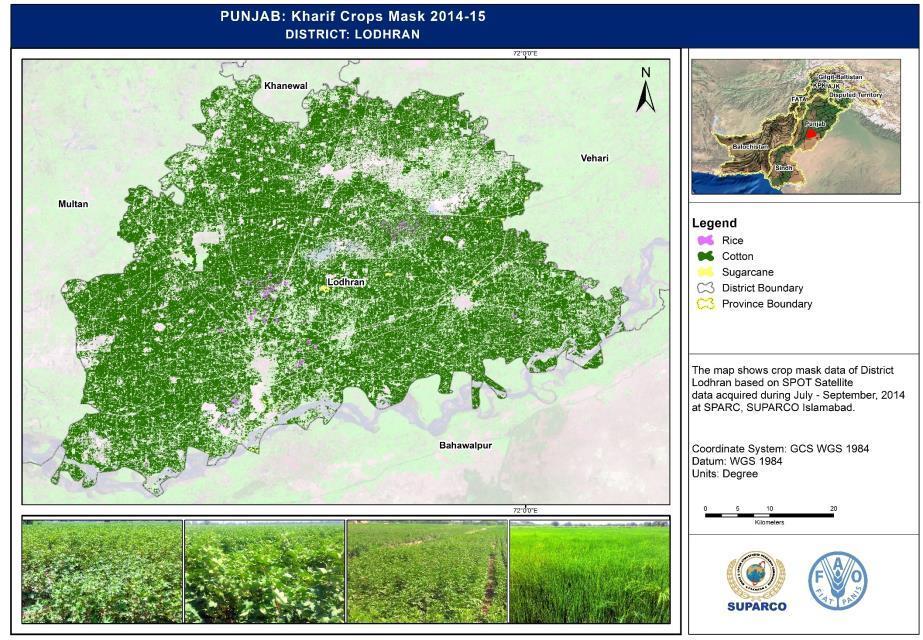
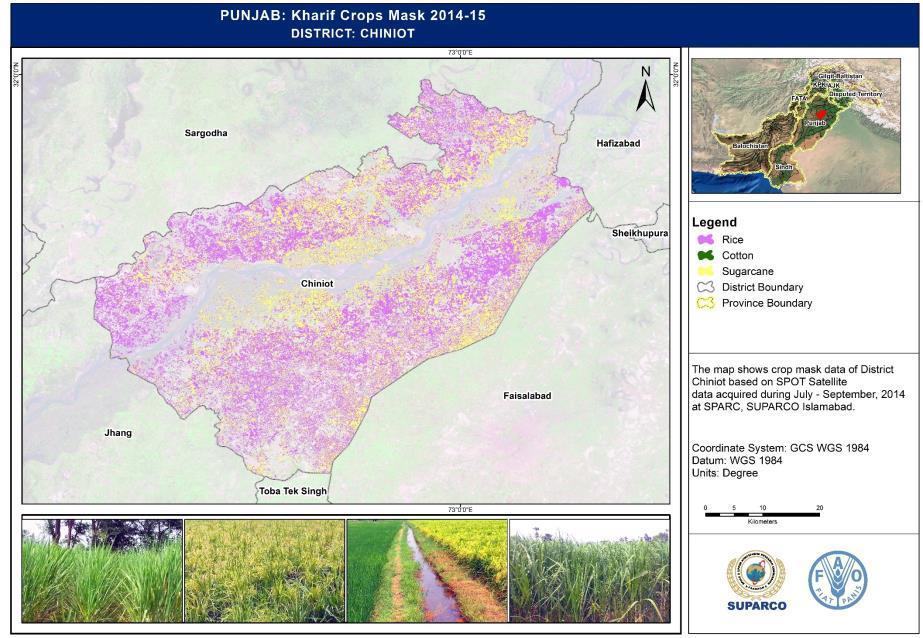
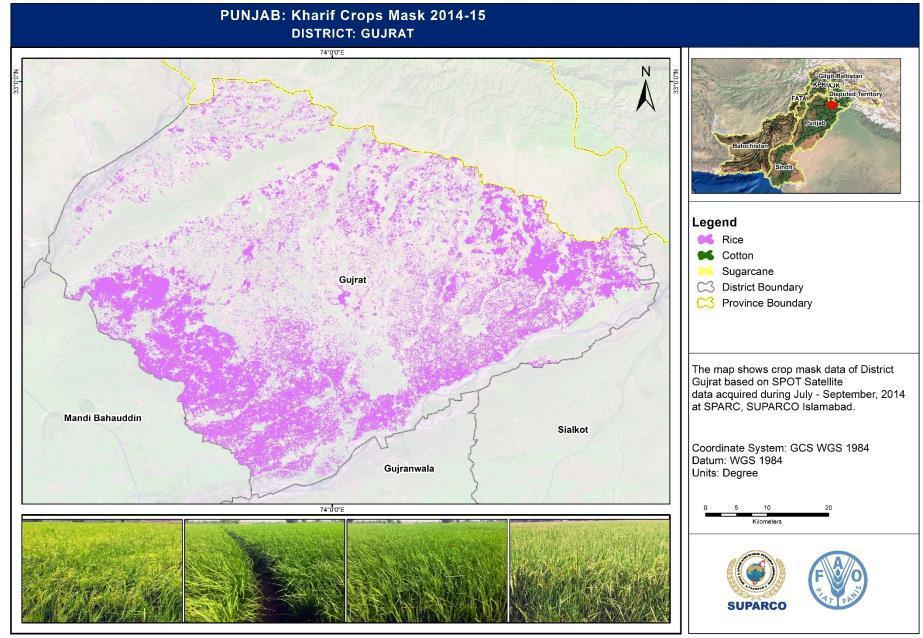
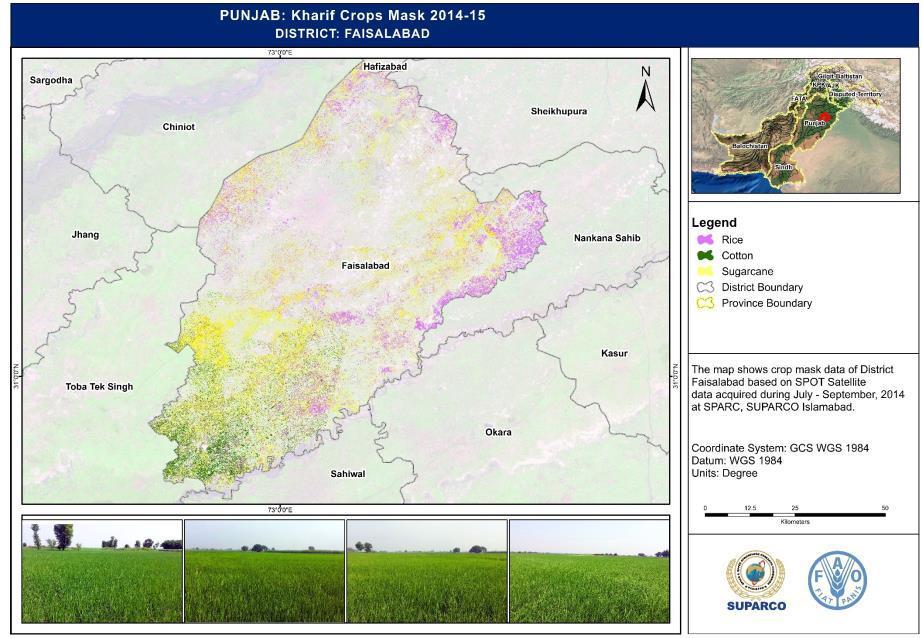
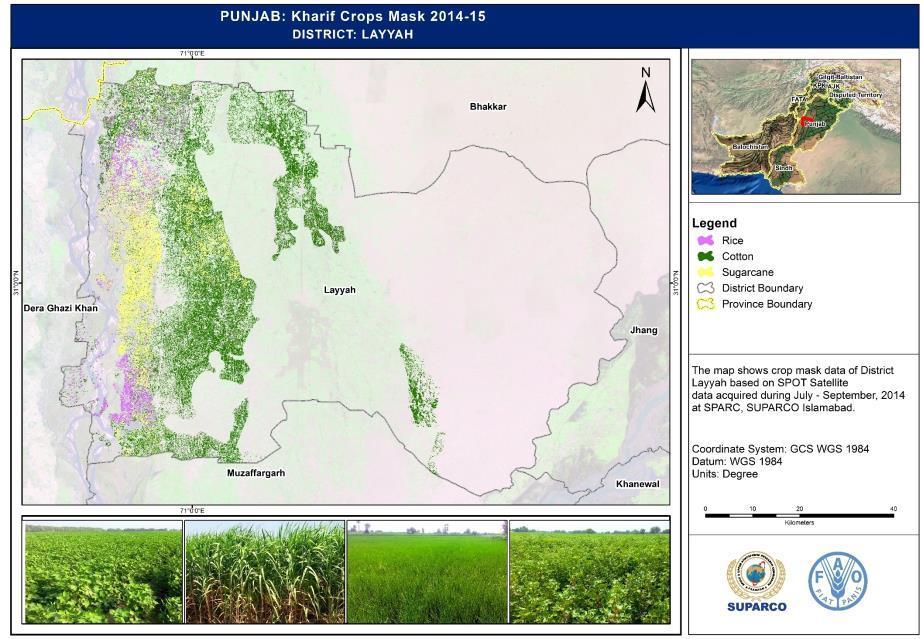
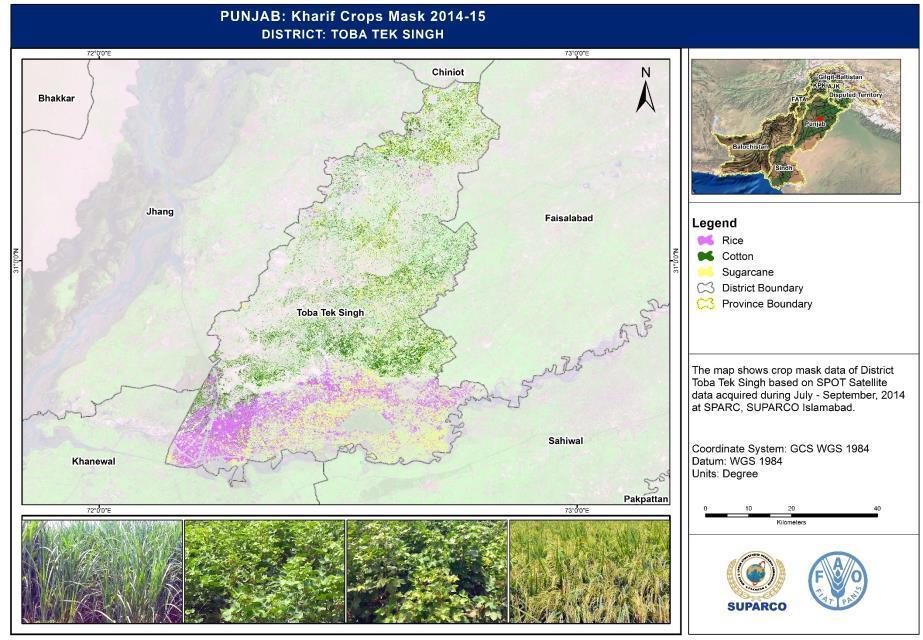
110 Kharif Crop Mask ( ) - Punjab Southern Zone (PSZ) This zone is comprised of twelve districts and dominated by cotton and sugarcane crops. Overall contribution of the zone at Punjab level to the crop mask is 12.3 percent rice, 37.0 percent sugarcane and 86.3 percent cotton. Major Sugarcane growing districts at zone level are Khanewal (50 percent), Bahawalnagar (20.2 percent), Multan (8.1 percent) and Rahim Yar Khan (6.1 percent). Major rice growing districts at zone level are Dera Ghazi Khan (32.0 percent), Bahawalpur (21.8 percent), Sahiwal (12.4 percent) and Rajanpur (8.6 percent) Cotton is most dominant crop in southern Punjab and major growing districts at zone level are Rahim Yar Khan (13.2 percent), Dera Ghazi Khan (11.3 percent), Khanewal (10.7 percent) and Bahawalnagar (10.6 percent) Kharif Crop Mask ( ) - Punjab Central Zone (PCZ) This zone is comprised of fourteen districts and mostly mixed cropping area. Overall contribution of the zone to the crop mask at Punjab level is 35.1 percent rice, 59.1 percent sugarcane and 13.7 percent cotton. Major Sugarcane growing districts at zone level are Faisalabad (25.13 percent), Jhang (16.8 percent), Chiniot (12.3 percent) and Toba Tek Singh (7.6 percent). Major rice growing districts at zone level are Jhang (18.3 percent), Okara (16.0 percent), Mandi Bahauddin (12.6 percent) and Gujrat (12.5 percent). Cotton is least grown crop in central Punjab and major growing districts are Jhang (25 percent), Layyah (18.8 percent) and Bhakkar (17.6 percent) Figure 12: Kharif Crop Mask Area- Punjab South Zone Figure 13: Kharif Crop Mask Area- Punjab Central Zone 103

111 Kharif Crop Mask ( ) - Punjab North East Zone This zone is comprised of six districts and mostly dominated by the rice crop. Overall contribution of the zone to the crop mask at Punjab level is 52.6 percent rice, 3.9 percent sugarcane and no cotton crop. Major rice growing districts at zone level are Gujranwala (23.7 percent), Sheikhupura (22.0 percent), Sialkot (18.2 percent) and Narowal (14.5 percent) at zone level. Nankana sahib (51.5 percent) and Sheikhupura (33.8 percent) are major growing districts for sugarcane in this zone. Farming community does not grow cotton crop in this zone. Figure 14: Kharif Crop Mask Area- Punjab North East Zone 104
112 7. Conclusion The crop masks developed will be useful for monitoring of changes in areas of Kharif crops cultivated in Punjab and Sindh. Digital information on Kharif crops will lead us to understand the crop rotation system through satellite remote sensing data by applying spatial query with seasonal crop mask. This will also outline the well differentiated cropping patterns of Rice - wheat, Cotton - Wheat and sugarcane areas. In addition, these masks will help to estimate cropping intensity of land use in various regions of these provinces. These will also be expedient for other geospatial studies regarding natural disasters viz. floods, droughts and others. The masks will be helpful in minimizing duplications of work. It would appreciably increase working efficiency by optimizing labor used and time consumed. 105